
Abstract
Background
Renal parenchymal volume (RPV) is considered an important index for clinical decisions. However, normal values have not been established, which hinders the clinical application of RPV.
Purpose
To test the accuracy and reproducibility of RPV and to investigate the normal values of RPV and kidney length as measured by non-enhanced multidetector computed tomography (CT).
Material and Methods
An animal model study was performed to test the accuracy and repeatability of RPV measured by CT. RPV of porcine kidneys was measured by water displacement (actual values) and non-enhanced multidetector CT. Individual RPV and kidney length were measured by non-enhanced CT in patients with no clinical history of renal disease (n = 722). Patient height, age, weight, body surface area (BSA), and body mass index (BMI) were assessed before each patient's CT examination was performed.
Results
RPV obtained by the CT method was within 2% of the RPV determined by the water displacement method. The normal values of RPV (M ± 1.96 standard deviation [SD]) were 145.72 ± 54.37 mL for men and 132.46 ± 41.94 mL for women. The normal values of kidney length (M ± 1.96 SD) were 10.27 ± 1.98 cm for men and 9.93 ± 1.58 cm for women. RPV did not significantly correlate with BSA or weight in women, but correlated significantly with height and age in both men and women. Of the assessed factors age, weight, height, BSA, and BMI, age, and height were the independent factors that best reflected RPV, in both men and women.
Conclusion
The present animal study results showed that non-enhanced multidetector CT findings accurately reflect the RPV. The subsequent study performed in humans showed that the RPV of the presently sampled Chinese population was lower than the commonly quoted reference values obtained from Western populations.
Renal diseases often cause morphological changes in the kidneys, which can be temporary or permanent depending upon the etiology of the primary disease. Kidney length is a parameter that can detect kidney abnormalities. However, because of the complexity and variability of the kidney shape, kidney length does not always appropriately reflect the status of the renal parenchyma (1).
In contrast, renal parenchymal volume (RPV) includes the volumes of the cortex and medulla without renal sinus volume. This is a better surrogate for renal function than renal volume and kidney length (2–4). RPV correlates well with glomerular filtration rate (GFR) in kidney donors and patients with renal artery stenosis (4, 5). In addition, RPV is useful for surgical planning, as it can predict renal function postoperatively (6). Based on these factors, establishing the normal values of RPV is clinically important.
Although many studies have reported values for renal length, only a few studies have reported RPV measured by ultrasonography, including only two that assessed the RPV of adults (7, 8). Measurement of the RPV by ultrasonography is operator-dependent, and is limited by the need to assume the kidney as an ellipsoid, which does not take into account the complexity of the kidney shape (2). As a result, errors in volume calculations may occur (8, 9). In contrast to ultrasonography, CT and magnetic resonance imaging (MRI) have been regarded to be a feasible and reliable method for measuring RPV with a negligible error rate (8, 10–12). However, measuring RPV by MRI is expensive and more time-consuming compared to CT. The above factors limit MRI as a routine non-invasive method for measuring RPV.
To date, few studies have reported normal values of RPV measured by CT (13). Furthermore, the results of RPV measurements may be controversial, since CT type (single slice/multislice), reconstruction thickness, and usage of contrast agent varies in the different reports.
Therefore, the aim of this study was to measure the RPV and kidney length under standardized conditions to establish normal reference values using non-enhanced multidetector CT (MDCT).
Material and Methods
Study population
This prospective study included 722 adult patients (357 men and 365 women) who visited the first affiliated hospital of Chongqing Medical University between September 2007 and April 2010. Patient medical records, CT diagnosis, and images were carefully analyzed to confirm that the participants had normal kidneys. Patients included outpatients and inpatients that underwent abdominal non-enhanced multidetector CT scans for abdominal trauma, unexplained back or abdominal pain, or diseases other than renal disease. Patients were excluded from the study if they had abnormal findings on CT examination that could affect kidney volume, such as renal artery stenosis, multiple renal cysts, polycystic kidney disease, or a unilateral kidney. Patients with hypertension and diabetes mellitus were also excluded because of the potential for renal pathology. All patients provided informed consent that data from their CT examination could be used for research purposes before undergoing the clinically requested CT examination. This study was approved by the ethics board of our institution.
Animal model study
To evaluate the accuracy of non-enhanced multidetector CT for measuring RPV in vivo, we first performed an animal model study. Ex vivo porcine kidneys were used to mimic in vivo kidneys of patients. Renal pedicle tissue and all surrounding tissues of 10 porcine kidneys were removed without damaging the integrity of the renal parenchyma. RPV values of ex vivo porcine kidneys measured by the water displacement method were considered actual values (14).
Assessment of RPV by water displacement
Each kidney was immersed in 0.9% saline and the displaced solution was measured using a graduated cylinder to determine RPV. Measurements were repeated six times, and the mean was determined for each kidney. RPV measurements of ex vivo porcine kidneys by CT and by water displacement were completed within 2 hours (Fig. 1).
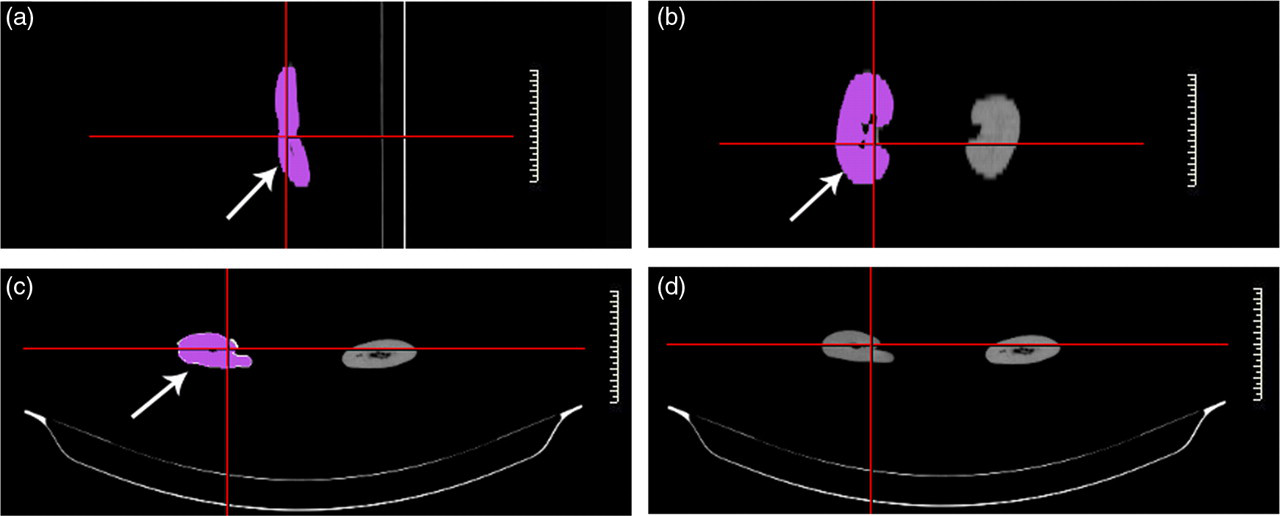
Renal parenchymal volume (RPV) of a porcine kidney measured by 16-slice multidetector spiral CT scanner. (a) Sagittal section. (b) Coronal section. (c) and (d) Cross-sections. The red area indicates the edge of the RPV (arrow)
Assessment of multidetector CT renal volume
All CT examinations used a 16-slice multidetector spiral CT scanner (Somatom Emotion 16, Siemens Medical Solutions, Forchheim, Germany) without a contrast agent. Scans were acquired using a single breath hold with the following parameters: 5 mm beam collimation, 24 mm/speed, 80–90 mA, 130 kV, and a rotation time of 0.6 s. Images were re-constructed at 1.5-mm intervals. All CT images were transferred to a workstation for RPV calculation using the voxel count method. For this method, the edge of RPV was traced on each section and then total RPV was calculated automatically by adding all voxels within the boundaries of the kidney (Fig. 2).
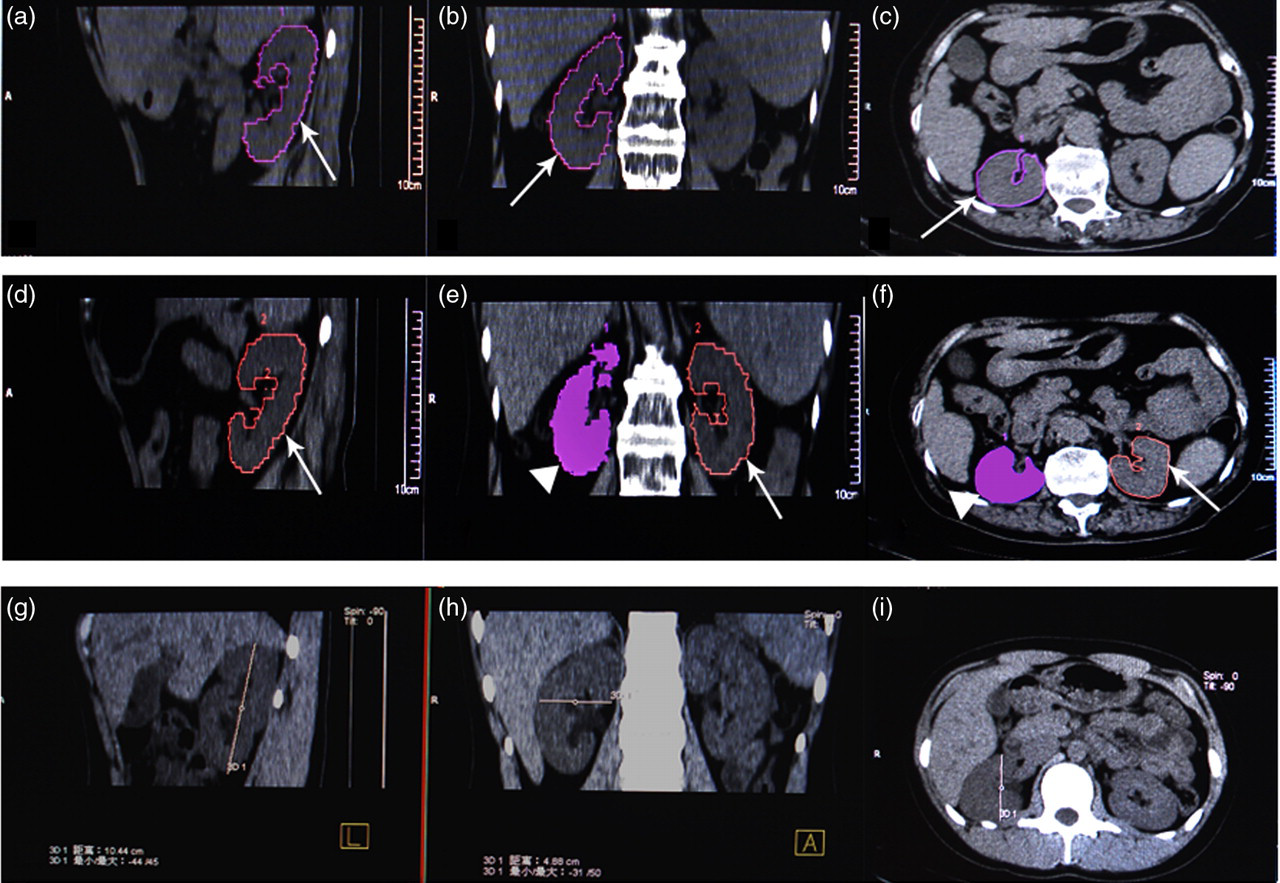
The renal parenchymal volume (RPV), kidney length, transverse dimension and anteroposterior dimension of a patient measured by 16-slice multidetector spiral CT scanner. (a–c) RPV of right kidney. (d–f) RPV of left kidney. (g–i) kidney length, transverse dimension and anteroposterior dimension of right kidney. The curve indicates the edge of the RPV (arrow), triangle indicates the edge of the RPV of the right kidney. (g) Kidney length of left kidney. (h) Kidney transverse dimension of the left kidney. (f) Kidney anteroposterior dimension. (a), (d) and (g) Sagittal section of CT images. (b), (e) and (h) Coronal sections of CT images. (c), (f) and (i) Cross-sections of CT images
Assessment of kidney length, transverse dimension, and anteroposterior dimension by CT
Kidney length was measured in sagittal sections, the span of the transverse dimension was measured in coronal sections, and the span of the anteroposterior dimension was measured in cross-sections of CT images. We calculated the maximum values of kidney length, transverse dimension and anteroposterior dimension from all coronal sections (Fig. 2).
Sample size estimation
Sample size estimation was calculated by the following equation according to a previous study (15):

Body index assessment
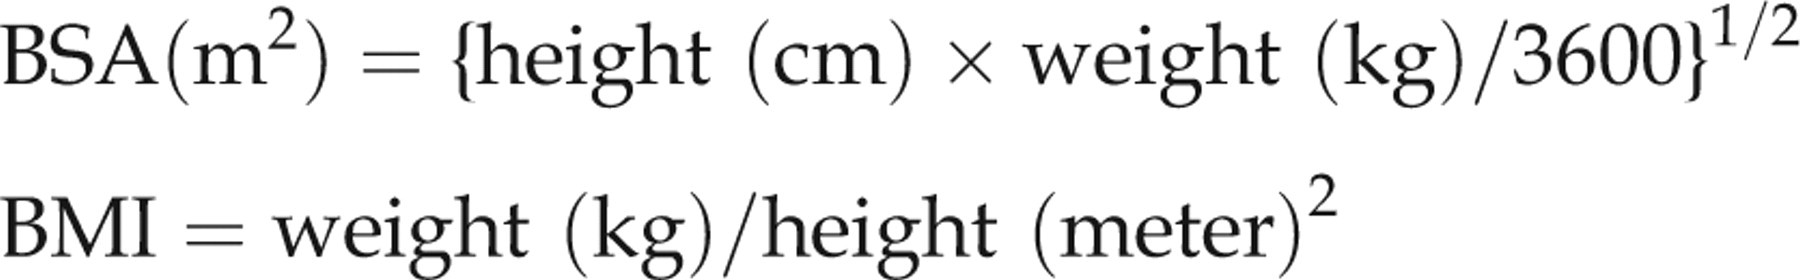
Each patient's age, height, and weight data were obtained before performing CT. Body surface area (BSA) and body mass index (BMI) were calculated as described previously (16):
Statistical analysis
Differences in RPV measured by water displacement and CT voxel count were analyzed by paired samples t-test. Correlation of RPV with other parameters was analyzed by determining Spearman correlation coefficients. Significance of multiple variables for RPV was analyzed by multiple regression (Medcalc 9.6.2.0). Differences among age groups (<40 years, 40–60 years, and ≥60 years) were analyzed by an analysis of variance (ANOVA). Because of the relatively small number of patients, we did not divide patients into age groups by decade. All statistical analyses were performed using commercially available analysis software, namely Statistical Package for the Social Sciences (SPSS 10.0.1, Inc., IBM, New York, NY, USA) and Medcalc (MedCalc Software9.6.2.0, Inc, Mariakierke, Belgium). Results were considered significant when P was below 0.05.
Results
Patient results
Patient age did not differ significantly between men and women (P > 0.05). The men were taller, heavier, and larger BSA values than women (P < 0.05). BMI values were larger for women than men (P < 0.05) (Table 1).
Subject characteristics
No significant age differences were seen between men and women (P > 0.05)
*Parameters were significantly different between men and women (P < 0.05)
Animal model study
The accuracy of CT measurement was verified by comparing the RPV of 10 porcine kidneys measured by water displacement method (103.7 ± 12.8 mL) to values obtained using the CT voxel count method (102.9 ± 12.9 mL). We assumed RPV values measured by the water displacement method as the actual renal parenchymal volumes. The errors of the CT method were no more than 2% compared to actual renal volumes. No significant differences in RPV were observed between measurements using CT voxel count and water displacement method (P > 0.05).
Sample size estimation and the results of non-enhanced multidetector CT
Our sample size (357 men and 365 women) exceeded our minimum sample size estimation (189 men and 335 women, see equation in Methods), indicating that a sufficient number of patients was included to achieve significant results. Since the RPV and kidney length were found to be normal for both men and women according to the Kolmogorov-Smirnov test (P > 0.05), we calculated the 95% confidence interval for RPV and kidney length by mean ± 1.96 SD. The normal values of RPV (M ± 1.96 SD) were 145.72 ± 54.37 mL for men and 132.46 ± 41.94 mL for women. The normal values of kidney length (M ± 1.96 SD) were 10.27 ± 1.98 cm for men and 9.93 ± 1.58 cm for women (Table 2). Compared to women, the kidneys of men were longer with a larger RPV (P < 0.05) (Table 2). The left kidneys were longer and had much larger RPVs than right kidneys both in men and women (P < 0.05, Table 2).
Normal reference value of renal parachymal volume (RPV) and kidney length measured by CT
*Significant difference between right RPV and left RPV length (P < 0.05)
†Significant difference between men and women (P < 0.05)
L-RPV = renal parachymal volume of left kidney; R-RPV = renal parachymal volume of right kidney; L-Length = left kidney length; R-Length = right kidney length; M ± SD = normal value of 68.27% confidence interval; M ± 1.96 SD = normal value of 95% confidence interval
Kidney length correlated better with RPV than with kidney transverse or anteroposterior dimension, both in men and women (Table 3). RPV did not correlate with BSA or weight in women (P > 0.05) (Table 3). However, RPV did correlate with height and age in men and in women (P < 0.05) (Table 3). Multiple regression analysis showed that among the five factors considered (age, weight, height, BSA, and BMI), age and height were the independent factors that best reflected RPV value (Table 4).
Correlation between RPV and kidney (body) parameters
*Significant relationship between two parameters (P < 0.05)
BSA = body surface area; BMI = body mass index; Tran-D = transverse dimension; Ant-D = anteroposterior dimension
Multiple regression analysis for men and women
Multiple regression analysis determined the relationship between parameters affecting RPV in men and women. Age and height were independent factors that affected RPV in women by multiple regression (P < 0.01). BSA, BMI, and patient weight were not independent factors, and not included in the model
BSA = body surface area; BMI = body mass index
When the patients were divided into three age groups (<40 years, 40–60 years, and ≥60 years), an ANOVA showed that RPV tended to decline with age in both the right and left kidneys. The RPV of patients older than 60 years was smaller than that of patients <40 years or that of patients that were 40–60 years old (P < 0.05) (Fig. 3). Although RPV tended to decline between the <40 years group and the 40–60 years group, these comparisons did not reach the statistical significance for either men or women (P > 0.05) (Fig. 3).
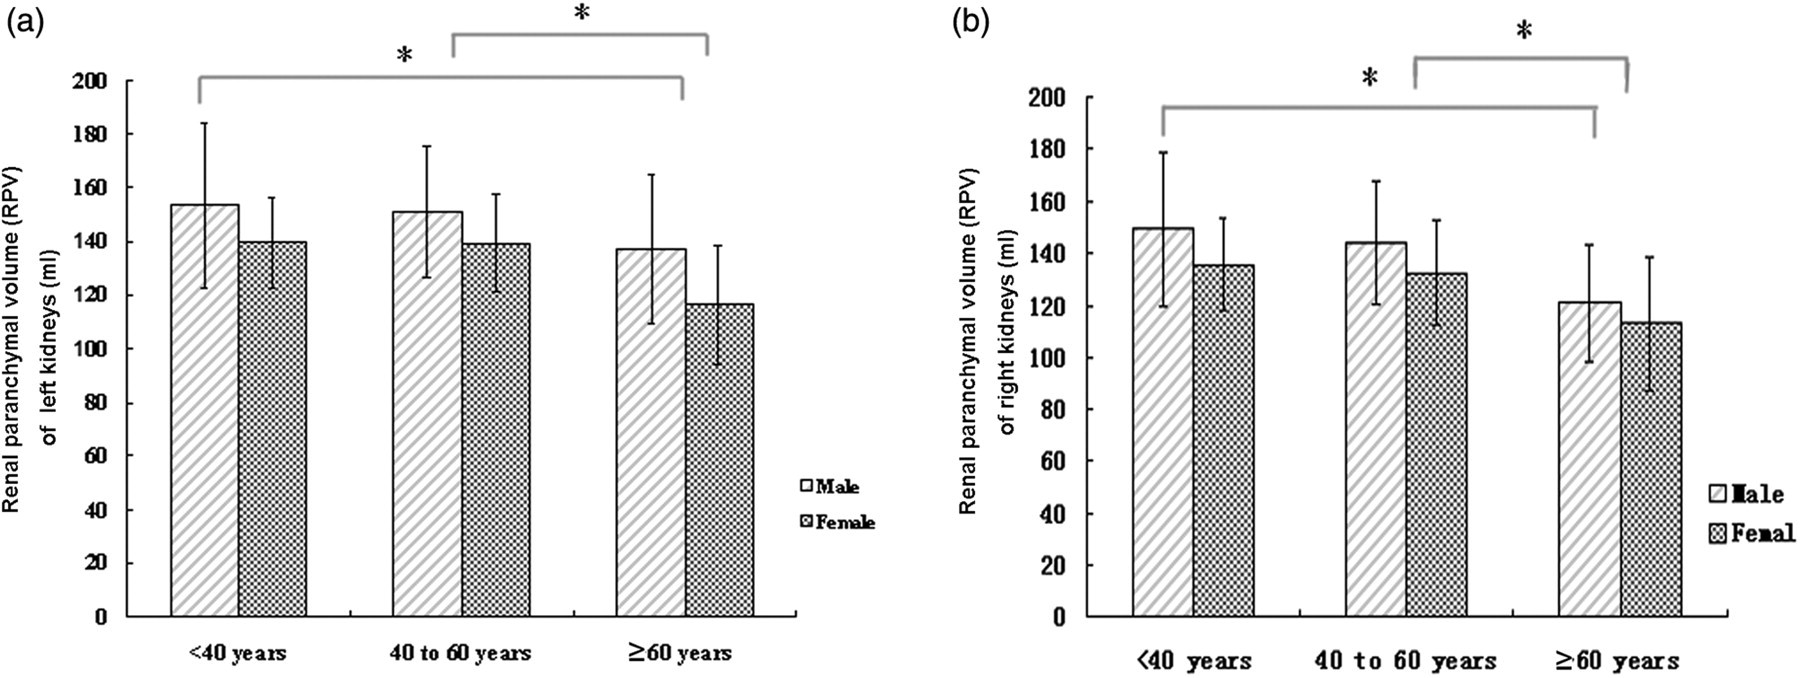
(a) Renal parenchymal volume (RPV) of left kidneys in three different age groups. (b) RPV of right kidneys in three different age groups *Significant difference between the two groups in men and women (P <0.05)
Discussion
In this study, RPV and kidney length reference values were established, and possible independent factors affecting RPV value were analyzed. To evaluate the accuracy of the voxel-count method as applied to CT, we performed an animal model experiment, wherein the water displacement method was used as the gold standard. RPV values calculated by the voxel-count method for CT did not differ from the actual RPV values measured by the water displacement method. The error of the CT method was no more than 2% relative to the water displacement data, suggesting that RPV can be measured reliably by non-enhanced multidetector CT.
Using non-enhanced multidetector CT, we determined normal values for kidney length and RPV (M ± SD) for a Chinese population specifically: for men, 10.27 ± 1.01 cm kidney length and 145.72 ± 27.74 mL RPV; and for women, 9.93 ± 0.81 cm kidney length and 132.46 ± 21.40 mL RPV. These values are smaller than previously reported MRI measurements. For example, Cheong reported kidney lengths and renal volumes of adults measured by MRI (n = 150) as: for men, 12.4 ± 0.9 cm kidney length and 202 ± 36 mL volume; and for women, 11.6 ± 1.1 cm kidney length and 154 ± 33 mL volume (14). Bakker et al. reported a mean RPV (n = 20) of 180 mL measured by MRI (8). The smaller values obtained in the present CT study relative to these prior MRI studies may be related to two reasons. First, RPV measured by MRI includes a small portion of renal sinus tissue that may produce RPV measurements that are slightly larger than actual values. Second, the prior studies were performed in Western populations, whereas this study included only Chinese subjects. The organs of Asians are generally accepted to be smaller than that of Westerners (17). Hence, our results indicate that the normal reference value of Western populations is may not be suitable for Chinese populations.
Although our data were similar to the RPV values of normal adult volunteers measured by ultrasonography in a Western population (median renal volumes were 146 mL for left kidney and 134 mL for right kidney) (7), this similarity cannot be taken as indicating that the RPV of Chinese populations is similar to that in Western populations since ultrasonography is prone to inaccuracy and poor reproducibility. Indeed, compared to MRI, renal volumes determined by ultrasonography are underestimated by ∼25% on average (8).
Similar to previous studies, we found that the RPVs and kidney lengths of adult men were larger than those of adult females (7, 13, 14). One study reported no differences in the renal volume of boys and girls under 14 years of age, while detecting a sex difference for subjects over 15 years of age, with there being a larger renal volume in boys larger than in girls (18). We presume the difference in RPV between men and women may be due to differences related to sex hormones.
Whether there is truly a difference between the RPV of the right and left kidneys is controversial. Some studies have reported a larger RPV for the left kidneys than for right kidneys, while others found no significant difference between the two sides (7, 14, 19). The present data showed a larger RPV for the left kidney than the right kidney, in both men and women. A smaller right kidney might be related to compression by the liver.
The RPV may be related to height, weight, BSA, and BMI (7, 14). In contrast to previous studies, our results did not suggest that RPV correlated with BSA or weight in women. However, we did find that RPV correlated well with height and age in both genders, suggesting that taller and younger persons may have larger kidneys with greater volume RPV.
Many factors may influence RPV, such as age, weight, height, BSA, and BMI. Such factors may influence RPV singly or in combination. In previous studies, univariate analyses explored each factor separately, irrespective of other factors (7, 13, 14). In this study, to avoid the limitations of univariate analyses, we used multiple regression to analyze the interaction among the above five factors, and found that age and height were independent factors affecting RPV. The relationship between height and RPV may explain, at least in part, the difference in RPV between men and women, since men are generally taller than women.
Although age independently reflected RPV by negative correlation, the reason for the tendency of RPV to change with age is unknown. A previous study reported that the renal parenchymal may become shorter and thicker with age (7). When we divided our cohort into age groups to explore the potential relationship between RPV and age, we found that the RPV of patients that were ≥60 years old was smaller than that of patients younger than 60 years of age. This finding suggests that RPV may decrease with age, particularly after 60 years of age.
Kidney length, kidney transverse dimension, and kidney anteroposterior dimension are parameters that are generally used to indicate kidney size. Of these, renal length is traditionally used clinically to detect variance in kidney shape. As previously found (4), we observed that renal length correlated best with RPV, indicating that length may be a preliminary screening index for abnormal RPV, since measuring RPV is more time-consuming than measuring length.
This study had several limitations. First, although the voxel count method was found to measure RPV accurately and reproducibly, RPV was not assessed automatically, so the method is time-consuming. Developing CT software for assessing volume will make this approach more convenient and easy to use. Second, we considered patients with no clinical history of renal disease as a normal population. However, we cannot exclude the possibility that some patients may have had some subclinical renal disease. Finally, although the sample size was sufficient to achieve statistical significance (15), it was still modest for the strict exclusion criteria. Only patients who had normal CT images and who had no exclusion criteria were included in the analysis. We are now collecting data prospectively and anticipate results from a larger population with a broader age range.
In conclusion, the non-enhanced multidetector CT method was shown to accurately access RPV. Normal RPV values were 145.72 ± 54.37 mL for men and 132.46 ± 41.94 mL for women. Kidney length was 10.27 ± 1.98 cm for men and 9.93 ± 1.58 cm for women. Of the personal variables examined (age, weight, height, BSA, and BMI), age and height were the independent factors that best reflected RPV for both men and women.