
Abstract
Background
Volumetry of lymph nodes potentially better reflect asymmetric size alterations independently of lymph node orientation in comparison to metric parameters (e.g. long-axis diameter).
Purpose
To distinguish between benign and malignant lymph nodes by comparing 2D and semi-automatic 3D measurements in MSCT.
Material and Methods
FDG-18 PET-CT was performed in 33 patients prior to therapy for malignant melanoma at stage III/IV. One hundred and eighty-six cervico-axillary, abdominal and inguinal lymph nodes were evaluated independently by two radiologists, both manually and with the use of semi-automatic segmentation software. Long axis (LAD), short axis (SAD), maximal 3D diameter, volume and elongation were obtained. PET-CT, PET-CT follow-up and/or histology served as a combined reference standard. Statistics encompassed intra-class correlation coefficients and ROC curves.
Results
Compared to manual assessment, semi-automatic inter-observer variability was found to be lower, e.g. at 2.4% (95% CI 0.05–4.8) for LAD. The standard of reference revealed metastases in 90 (48%) of 186 lymph nodes. Semi-automatic prediction of lymph node metastases revealed highest areas under the ROC curves for volume (reader 1 0.77, 95%CI 0.64–0.90; reader 2 0.76, 95%CI 0.59–0.86) and SAD (reader 1 0.76, 95%CI 0.64–0.88; reader 2 0.75, 95%CI 0.62–0.89). The findings for LAD (reader 1 0.73, 95%CI 0.60–0.86; reader 2 0.71, 95%CI 0.71, 95%CI 0.57–0.85) and maximal 3D diameter (reader 1 0.70, 95%CI 0.53-0.86; reader 2 0.76, 95%CI 0.50–0.80) were found substantially lower and for elongation (reader 1 0.65, 95%CI 0.50–0.79; reader 2 0.66, 95%CI 0.52–0.81) significantly lower (p < 0.05).
Conclusion
Semi-automatic analysis of lymph nodes in malignant melanoma is supported by high segmentation quality and reproducibility. As compared to established SAD, semi-automatic lymph node volumetry does not have an additive role for categorizing lymph nodes as normal or metastatic in malignant melanoma.
FDG-18-PET (fluorodeoxyglucose positron emission tomography) is an accepted modality for lymphonodal staging of malignant melanoma (1–3) with high accuracy for the detection of metastases at stage III to IV. In clinical routine, functional assessment with PET-CT substitutes anatomical assessment of lymph nodes. Revised RECIST 1.1 (Response Evaluation Criteria in Solid Tumors) have underlined the importance of multislice computed tomography (MSCT) as the primary lymph node imaging modality, and proposed measurement values and rules for categorizing lymph nodes (4). Lymph node measurement is recommended to be performed in the short axis for solid tumors (SAD), since the SAD (>15 mm) is regarded to be more predictive of malignancy (5) as compared to the long axis diameter (LAD). Both parameters refer to the axial plane only and are greatly influenced by the orientation of the lymph node within the body. Additionally, manual acquisition of unidimensional parameters is not only time-consuming but also bears inherent sources of error (e.g. high inter-observer and intra-observer variability (6, 7).
Limitations of manual measurements and innovations in hardware and software promoted development of semi-automatic tumor measurements in oncology. Semi- automatic volumetry was recently found to be reproducible and more accurate than manual assessment (8). Three- dimensional volumetric parameters have the potential to better reflect asymmetric size alterations of lymph nodes independently of lymph node orientation (5). RECIST working group recently requested clinical validation studies evaluating a volumetric approach for lymph node assessment (6). Until now the role of semi-automatic three-dimensional parameters remains unclear.
This study aims to distinguish between benign and malignant lymph nodes identified in patients with malignant melanoma stage III and IV by comparing 2D and semi-automatic 3D measurements in FDG-PET-CT.
Material and Methods
Patients
Thirty-three consecutive patients (15 men [46%], 18 women [54%]) with a histological diagnosis of advanced stage of malignant melanoma (five patients at stage III and 28 patients at stage IV according to the classification of the American Joint Committee on Cancer [AJCC]) were finally included in this retrospective study (mean age 61.5 ± 10.8 [standard deviation (SD)] years; October 2007 to September 2008). All patients underwent diagnostic FDG-PET-CT examination with contrast-enhanced CT scan, either of the cervical-thoracic region or the abdomen, or both. Patients (n = 2) already on chemotherapy and patients with a non-diagnostic PET-CT (inappropriate bolus timing or insufficient image fusion, substantial motion artifacts) were excluded.
Written informed consent for CT was obtained from all patients. The study was approved by the local ethics committee and conducted according to the guidelines of the institutional review board.
PET-CT
All examinations were performed on a PET-CT hybrid scanner (Biograph Sensation 16, 16-slice; Siemens Medical Solutions, Forchheim, Germany). Patients were examined after at least 8 h fasting. Four MBq 18F-FDG (fluorodeoxyglucose)/kg body weight was given intravenously 60 minutes before PET-CT scan, after ensuring that the blood glucose level was below 120 mg/dl.
Performance of a low-dose CT scan for attenuation correction was followed by clinically established contrast-enhanced CT scans at 120 KV, using a special dose modulation template for radiation exposure reduction (CARE dose) with a 16x1.2 mm collimation (9). The contrast agent (Ultravist 300®, Bayer Schering Pharma AG, Leverkusen, Germany) was applied in the following dosages: cervical CT: 80 mL (delay 45 s), thoracic and abdominal CT: 120 mL (delay 70 s) with a constant injection rate of 3 mL/s. CT data-sets were reconstructed at a slice thickness of 3.0 mm with a slice overlap of 2.0 mm using a standard soft tissue kernel (B30). 18F-FDG-PET data were reconstructed iteratively using the ordered subset expectation maximization algorithm.
Lymph node evaluation
Lymph nodes and reference standard
CT and PET data-sets were sent to a separate workstation (Syngo® MMWP; Siemens Medical Solution, Forchheim, Germany) for lymph node selection and preparation by an unblinded radiologist (4 years experience in PET-CT), who was not involved in lymph node assessment. Lymph nodes ≥ 5 mm at different localizations were tagged. The reference standard consisted of a combination of FDG uptake in lymph nodes (n = 33), findings from histological examinations (n = 15) and/or PET-CT follow-up examinations for a minimum of 3 months (mean 525 days, range 90–1440 days; n = 30). Metastasis were assumed for lymph nodes with an uptake value twofold and higher than the mean SUV (standard uptake value) in the liver and therapy and/or histological confirmation. Additionally therapy induced shrinkage of lymph nodes in follow-up PET-CT examinations was considered as malignancy. Lymph nodes with a maximal uptake in the range of the liver or lower without size changes during follow-up PET-CT examinations were regarded as non-metastatic. Lymph nodes in different locations (cervico-axillary, abdominal, inguinal) were considered separately. All included lymph nodes were tagged with numbers (Onco®; Siemens Medical Solution, Forchheim, Germany) to minimize correlation and mapping errors between different readers.
Manual evaluation
Manual assessment was performed by two blinded radiologists (both with more than 6 years of experience in oncologic radiology). The tagged lymph nodes were evaluated separately and independently by each radiologist. Manual assessment encompassed caliper measurements of long-axis diameter (LAD, mm) and short-axis diameter (SAD, mm) on axial CT images on reader's choice (cine mode).
Semi-automatic evaluation
Semi-automatic lymph node segmentation was performed by two blinded radiologists (both with more than 6 years of experience in oncologic radiology) using dedicated lymph node segmentation software (Onco®, Siemens Medical Solution, Forchheim, Germany). This software contains an algorithm for semi-automatic lymph node evaluation based on an extended version of the lung lesion segmentation approach, which is described in detail elsewhere (10, 11). Each radiologist separately and independently evaluated the preselected and tagged lymph nodes.
The semi-automatic segmentation process was started by drawing a diameter on the lymph node either on an axial, coronal or sagittal plane. After a few seconds the software automatically estimated a volume of interest (VOI) and thresholds (histogram analysis within the VOI) for initial segmentation of the lymph node. Based on region-growing- based algorithms initial segmentation results were displayed, whereas watershed transformation and distance transformation algorithms separated adjacent structures of similar density. The segmented lymph node could be verified visually using the implemented 3D viewer. Unsatisfactory segmentation results could be modified by entering additional information (e.g. that a lesion was rather round, ovoid, or irregular) or by assisting the segmentation manually by using dedicated correction tools. The number of correction steps needed was documented. Qualitative still insufficient segmentation results were evaluated as ‘inadequate segmentation’ after the second correction step and excluded from further analysis.
The following parameters were documented: long-axis diameter (mm), short-axis diameter (mm), maximal 3D diameter (mm), elongation (elongation = maximal longitudinal diameter/maximal perpendicular diameter) and volume (mL).
Statistical and data analysis
Statistical analyses were performed using SAS (version 9.2 for Windows, SAS Institute Inc., Cary, NC, USA), S+ (version 8.1 for Windows, TIBCO Software Inc., Palo Alto, CA, USA) and SPSS Statistics (version 17.0.0 for Windows, SPSS Inc., Chicago, IL, USA).
In the case of metric parameters, receiver-operating characteristic (ROC) curve analyses were performed. The area under the ROC curves was calculated by applying the trapezoidal rule. Associated asymptotic 95% confidence intervals were obtained non-parametrically. The results of the different readers were compared with each other, by analyzing corresponding areas under the ROC curves for possible systematic differences by means of Wald-type significance tests. In order to assess inter-observer variability semi-automatic (LAD, SAD and volume) and manual parameters (LAD, SAD) were compared between both readers. For this purpose, mean relative values (%) ±SD, 95% confidence intervals (upper and lower limits) as well as intraclass correlation coefficients (ICC) were calculated. Concordance correlation coefficient values ranged between −1 (perfect discordance) and +1 (perfect concordance). Significance was assumed as p < 0.05.
Results
Lymph node characteristics
In total, 186 lymph nodes were analyzed manually and semi-automatically in 33 patients (mean 5.6 ± 3.3 [SD] lymph nodes/patient). Lymph nodes were localized as follows: 62 cervico-axillary (including submandibular and submental), 71 abdominal (mesenteric, retroperitoneal, and iliac), and 53 inguinal lymph nodes.
Based on the combined reference standard, 90 of 186 (48 %) lymph nodes were regarded as metastases. Lymph node size ranged from 7 to 30 mm in transversal plane with a mean size of 15.3 ± 4.3 (SD) mm (negative lymph nodes 13.4 ± 3.4 [SD] mm, range 7.4–25.9 mm, 2.9 ± 1.3 [SD] lymph nodes/patient; positive lymph nodes 17.0 ± 4.4 [SD] mm, range 8.4–30.0 mm, 2.8 ± 1.4 [SD] lymph nodes/patient). Distribution of lymph nodes is illustrated in Fig. 1.
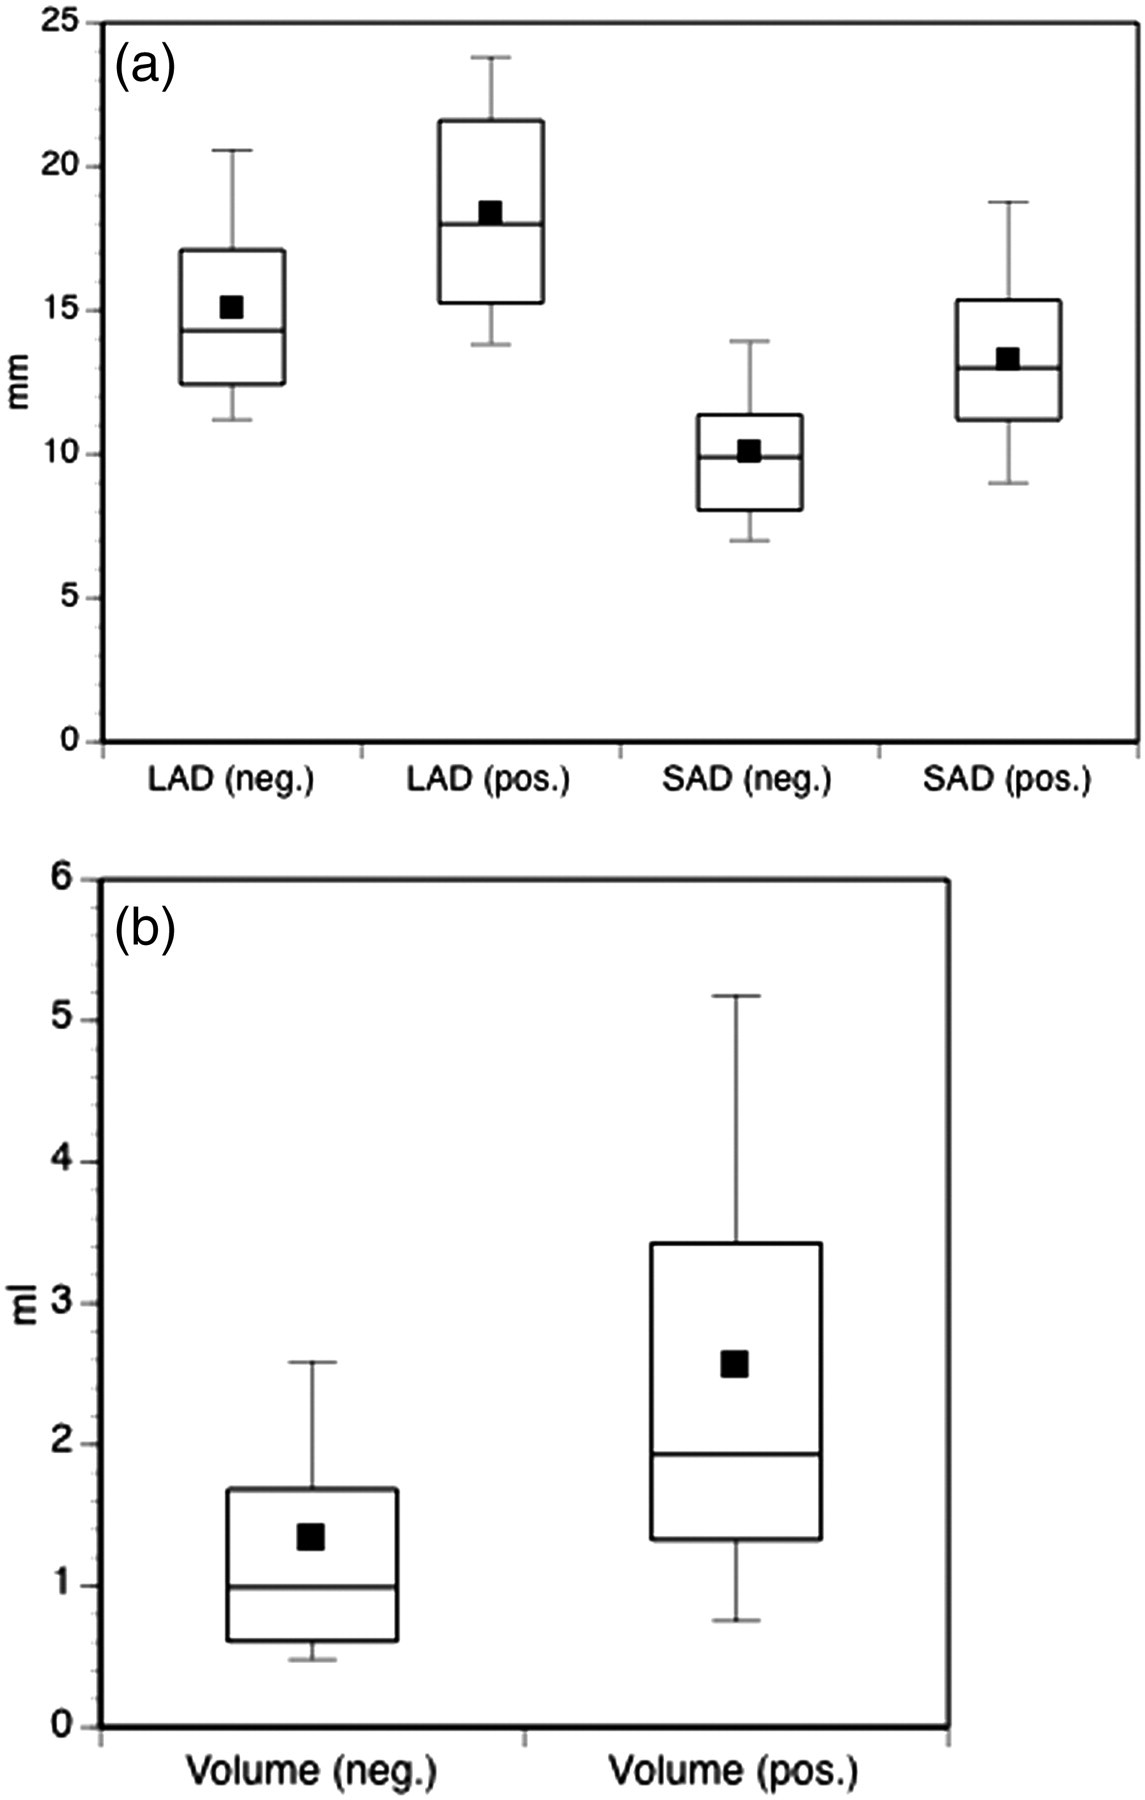
Box plot diagram of semi-automatic measurements: mean value (black square), median (axial line), 95% percentiles and range of SAD (a), LAD (a) and volume (b) are presented for benign (neg.) and malignant (pos.) lymph nodes. Compared to LAD and SAD superior discrimination between benign and malignant lymph nodes is shown for volume
Semi-automatic evaluation
Segmentation quality
Semi-automatic segmentation (Fig. 2) was adequately performed in the first attempt in most of cases without need for further correction (145 of 191, 76%). Additional optimization and correction of initial segmentation results were achieved in the second attempt (one correction step necessary) in 23 of 191 (12%) and in the third attempt (two correction steps necessary) in 18 of 191 (9%) lymph nodes concordant for both readers. In five of 191 (3%) cases, segmentation results remained not acceptable after more than two correction steps and were excluded from further evaluation. Hence, 186 of 191 (97 %) lymph nodes were finally included for further assessment.
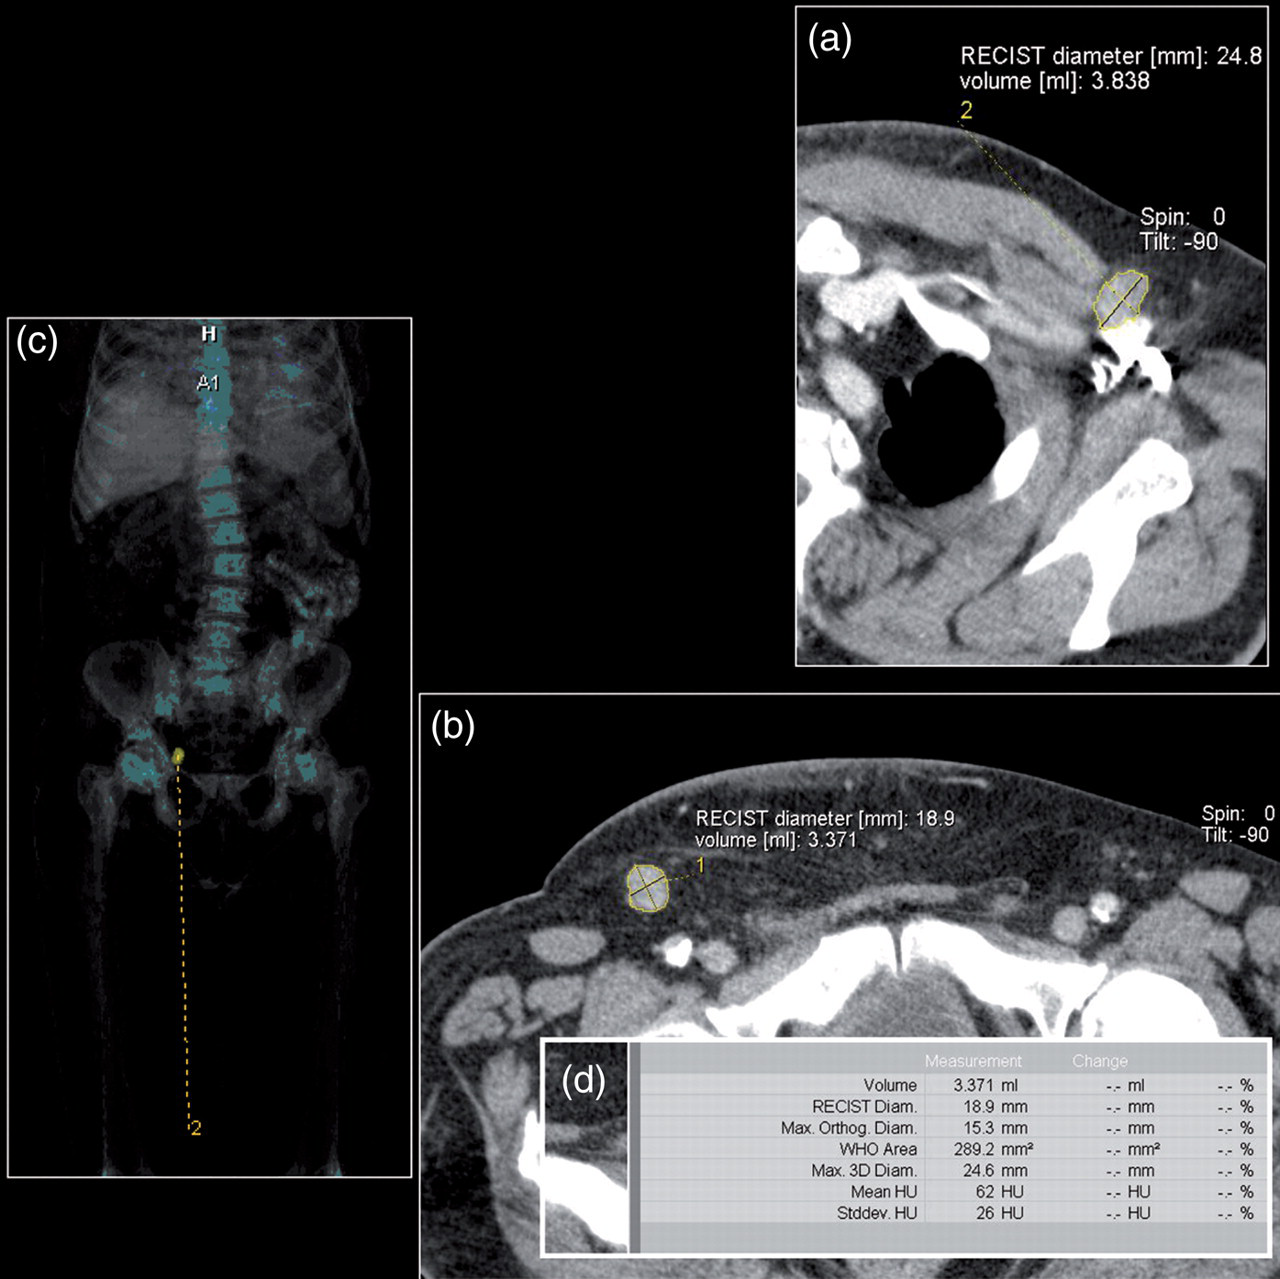
Semi-automatic lymph node segmentation of a cervico-axillary and inguinal lymph node. A few seconds after starting the segmentation the result is displayed (yellow lines) in multiplanar reconstructions (a, b) and orthogonal views. The localization and shape of the marked and segmented lymph node can be derived from 3D whole-body overviews (c). A synopsis (d) of different segmentation parameters (e.g. volume) is provided automatically once the segmentation result was confirmed to be adequate
Assessment of inter-observer variability
For manual lymph node analysis the mean inter-observer variability was 10.8% (95%CI 8.8–12.7%) for LAD and 13.6% (95%CI 10.8–16.3%) for SAD over all localizations. Intra-class coefficients in terms of inter-observer variability were 0.812 for LAD and 0.796 for SAD. In comparison, semi-automatic inter-observer variability was found to be lower, at 2.4% (95%CI 0.05–4.8%) for LAD and 0.03% (95%CI –2.5–2.6%) for SAD (volume 6.7%, 95%CI 0.8– 12.6%) over all localizations. These tendencies were supported by intra-class correlation coefficients of 0.739 for the LAD, 0.822 for the SAD and 0.803 for lymph node volume. Additionally, manually and semi-automatically obtained lymph node parameters showed good correlations with mean intra-class coefficients of 0.721 for LAD and 0.668 for SAD over all localizations.
ROC analysis and predictive value
The localization specific ROC curves are illustrated in Fig. 3. The areas under the curves (ROC) for semi-automatic measurements are documented in Table 1.
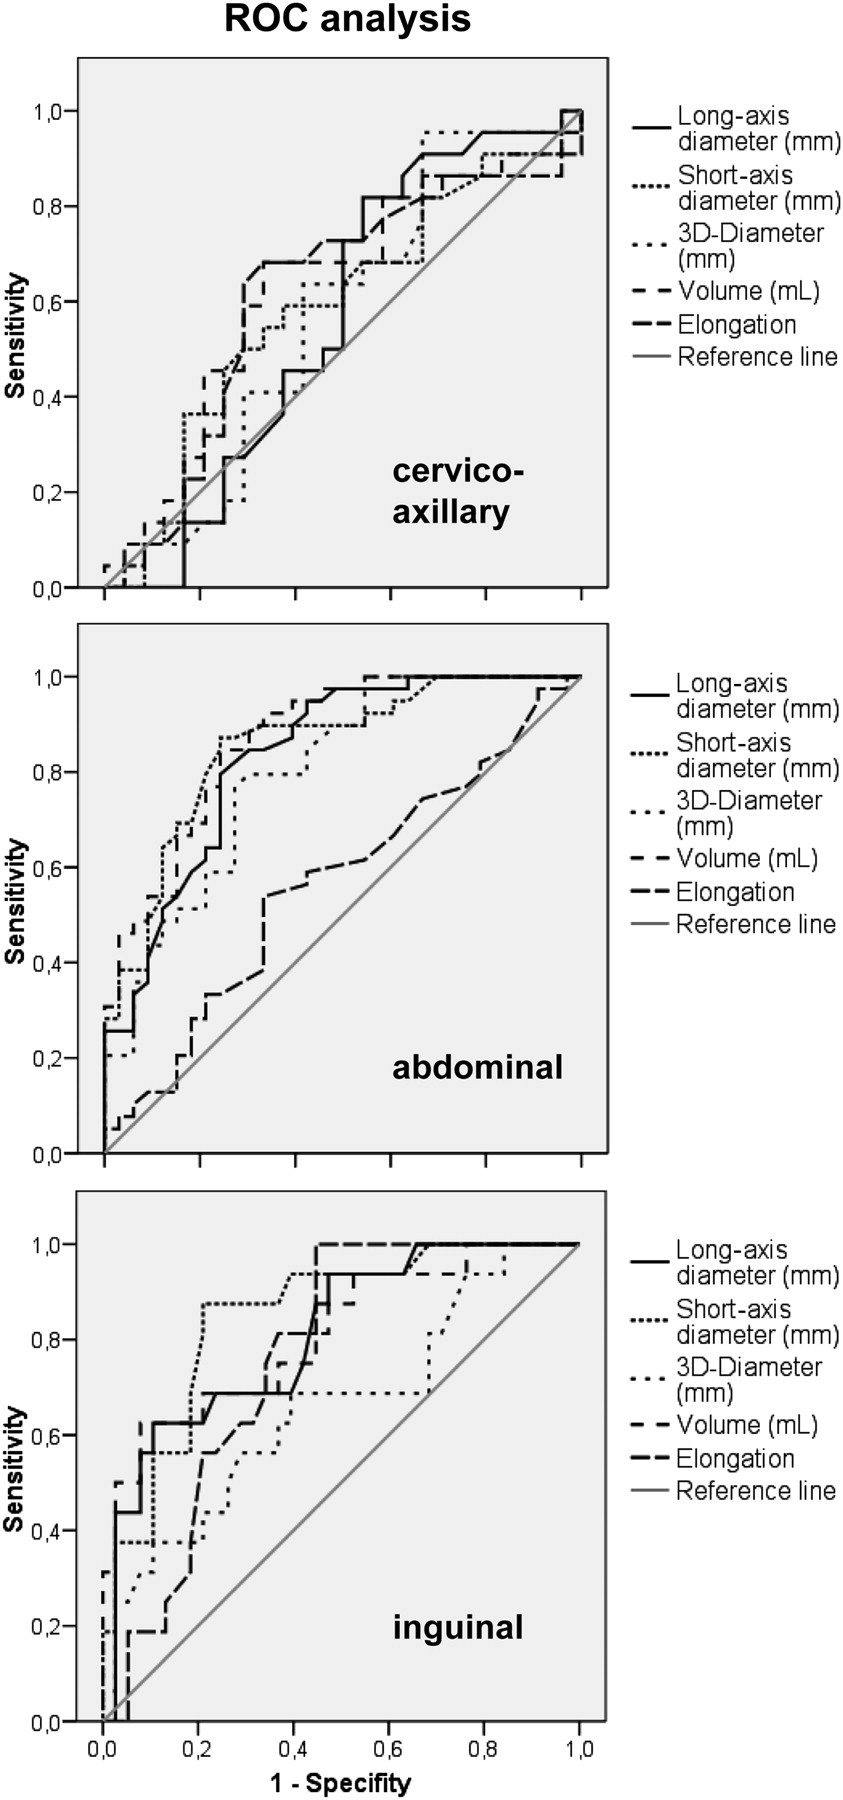
ROC curve for prediction of lymph node malignancy by semi-automatic assessment. Areas under the ROC curves were seen higher for SAD and volume compared to LAD and maximal 3D parameter of lymph nodes. The criteria ‘lymph node elongation’ showed significantly lower areas under the curve for the abdominal localization (0.564–0.604) in comparison to SAD (p = 0.0012) or volume (p = 0.0045). ROC analysis revealed higher accuracies for metric and volumetric parameters in the abdominal and inguinal region
Prediction of lymph node malignancy by semi-automatic assessment (ROC)
This table summarizes ROC area under the curve (95%CI) for each criteria and reader separately. Semi-automatic prediction of lymph node metastases revealed highest areas under the ROC curves for volume and SAD. Furthermore, higher accuracies for metric and volumetric parameters were observed in the abdominal and inguinal region
Independent of lymph node localization and reader, accuracies were found higher (p > 0.05) for volume (0.755–0.769) and SAD (0.751–0.763) in comparison to LAD (0.713–0.733) and maximal 3D parameter (0.653–0.695).
Unlike these metric and volumetric parameters, the criterion ‘lymph node elongation’ showed substantially lower areas under the curve for the cervico-axillary localization (0.614–0.651) and significantly lower areas under the curve for the abdominal localization (0.564–0.604) in comparison to SAD (p = 0.0012) or volume (p = 0.0045).
Additionally, ROC curve analysis revealed higher accuracies for metric and volumetric parameters in the abdominal region in comparison to the cervico-axillary region.
Discussion
Three imaging modalities or metrics currently posed to play a role in lymphonodal disease assessment are PET-CT, dynamic contrast-enhanced MRI (DCE-MRI) and 3D tumor measurements. However, at present there is either no sufficient standardization of MRI or widespread availability (PET-CT) for general adoption of these assessment methods (5, 12–15). In the absence of functional information oncological staging is therefore mainly based on anatomical assessment. Revised RECIST 1.1 has underlined the importance of MSCT as the primary lymph node imaging modality in clinical radiology practice (5).
Apparently, anatomical parameters in MSCT should warrant reliable categorising of lymph nodes as normal or pathologic (4, 5). Metric prediction of lymph node metastasis is mainly based on SAD or LAD (4, 5, 12, 16) as recommended by the RECIST 1.1. However, manually obtained metric criteria in CT refer to the axial plane only. The arbitrary character of the widely used LAD and SAD is evident when we recall that this criterion is strongly influenced by the orientation of the lymph node (5). The LAD or SAD is obtainable only if the lymph node is oriented parallel or orthogonal to the z-axis. Other orientations are prone to overestimation of LAD and SAD (13, 14, 16). Therefore, additional lymph node parameters are required to overcome potential measurement inaccuracies.
In this study, semi-automatic lymph node segmentation was a reliable tool and allowed for segmentation in the first attempt in most of cases (76%). Fabel et al. found similar levels of correct initial segmentation result (∼80%) (8). Adequate quality of the semi-automatic segmentation and measurements is supported by acceptable correlation coefficients (0.67–0.72) between manually and semi-automatically derived SAD and LAD. Furthermore, we found a substantially lower inter-observer variability for semiautomated than for manual measurements. The upper limit of agreement for manual assessment was 13% for LAD and 16% for SAD, meaning that a mean increase in LAD/SAD of just 13%/16% or more is – with 95% confidence – likely to be real growth rather than measurement inaccuracy between readers. Those upper limits were found substantially lower for semi-automated measurements with 4.8%/2.6% for LAD/SAD, respectively.
Numerous studies calculated sensitivities and specificities on the basis of size cut-offs (12, 15–18). However, variability in the definition of cut-offs makes comparison of these studies difficult. The evaluation in this study is strengthened by calculation of ROC curves and AUC (area under the curve) values, which are independent from size thresholds. As revealed by ROC analysis, mean accuracies were found higher for SAD compared to LAD (e.g. reader 1 0.76 vs 0.73) independently of location. Although not statistically significant, this trend is in good agreement with recently published revised RECIST 1.1 data (5), which recommend lymph nodes to be measured in the short axis.
The ratio (L/T) between the longest diameter (L) and the orthogonal transversal diameter (T) has been transferred from ultrasound to CT imaging (19–21). ROC analysis consistently revealed the elongation (L/T) of a lymph node as less helpful as compared to the other metric and volumetric parameters. This observation is contrary to several other studies, in which the elongation was estimated a superior criterion with reported sensitivities/specificities of 97%/97% (12). The slightly better accuracies for cervical lymph nodes are in line inasmuch that most studies were performed in head and neck malignancies (12, 20, 21).
In order to heed the suggestion of RECIST 1.1 (4, 5), we addressed the question whether semi-automatic 3D lymph node assessment is of potential to better predict lymph node involvement in malignant melanoma patients. However, we found the maximal 3D diameter (0.65/0.70) to be less accurate than SAD (0.76/0.75). Consequently, considerations in daily routine to measure the maximal lymph node diameter in ‘multiplanar reformations’ (e.g. sagittal) are not helpful to improve accuracy. Recently, promising volumetric assessment results have been published for pulmonary nodules and liver lesions (22–25). Consistently for all localizations the areas under the curve for lymph node volume (0.76–0.77) were similar to established SAD (0.76/0.75). Thus, the assumed better reflection of asymmetric size alterations of the lymph node in three dimensions (8) might be of minor importance. Furthermore, the level of accuracies observed in this study pinpoints the limitation of anatomic 2D and 3D parameters in differentiating between benign and malignant lymph node enlargement. The promising role of lymph node volume for remission appraisal in follow-up studies, however, is beyond the scope of this work, which was performed not undergoing chemotherapy. However, the promising role of volumetric parameters is limited considering lymph node evaluation in a follow-up setting. Therapy response could be missed using metric of volumetric parameters in case of oncological treatments initially causing necrosis in lymph nodes without substantial size reduction.
Additionally, ROC revealed substantially higher accuracies for metric and volumetric parameters in the abdominal and inguinal region as compared to the cervico-axillary region. Unlike the inguinal and abdominal region, lymph nodes in the cervical region might be suspected to be very prone to reactive lymph node changes due to trivial infections (common cold). This might aggravate the separation from metastases.
This study is limited to the extent that it does not allow histological correlation of all lymph nodes. A pure histopathological ground truth may exhibit selection bias and mapping errors inasmuch as – depending on the surgical regime – only suspicious lymph nodes are exstirpated and, methodically, a one-to-one correlation with pre-surgical imaging findings is impaired (2, 12, 26–28). We therefore tagged all included lymph nodes with numbers in order to minimize correlation and mapping errors between different readers. On account of reliable F-18-FDG-glucose uptake in patients with malignant melanoma at stage III and IV, PET-CT is accepted for staging purposes (1, 3, 4). The reference standard is strengthened by using – in accordance to Strobel et al. (2) – a combined approach (PET-CT, PET-CT follow-up, histology) (3, 12). This allowed to minimize a potential contamination with false-positives and negatives.
The results of this study are based on a single disease and can therefore not be directly applied to other forms of cancer, such as lymphoma, for which different ROC values may apply (27–33). Unlike melanoma, lymphoma dissemination in lymph nodes starts in the germinal centre with rapid lymph node growth. The ROC results derived in this study therefore might be transferrable to cancers with similar dissemination patterns (e.g. renal or breast carcinoma).
In conclusion, primarily semi-automatic lymph node analysis is supported by high segmentation quality and high reproducibility as compared to manual assessment. Prediction of lymphonodal melanoma manifestations should not be based on the maximal 3D diameter or the elongation. Volumetric lymph node analysis supplements but does not substitute established short-axis diameter for prediction of lymph node target lesions in malignant melanoma and may be an adjunct for partial volume correction of PET data. Assessment of SAD remains the most accurate and simple to achieve criterion.