




Abstract
Background
Measurement of muscle hardness is important for objective evaluation of the muscle condition. Muscle hardness may be related to muscle size, but this relationship has not yet been examined.
Purpose
To examine the relationship between the size and hardness of the medial gastrocnemius muscle (MG) at different ankle joint angles.
Material and Methods
Twelve young male subjects comprised the present study. Muscle thickness of the right MG (MTMG) was measured by ultrasonography as an index of muscle size. The MTMG was determined at 30% of the lower leg length from the popliteal crease to the lateral malleolus. At the same site, muscle hardness of the right MG (MHMG) was measured with ultrasound real-time tissue elastography. Both measurements were taken while each subject was instructed to lie in a prone position on a test bench. The right ankle was secured to a handmade apparatus by a non-elastic belt, with the hip and knee joints fully extended and the ankle positioned at +30°, 0° and –20° (0°: neutral position, positive values indicating plantar flexion).
Results
There were no significant differences in the MTMG among the ankle joint angles whereas the MHMG significantly increased as the ankle was moved from plantar flexion to dorsiflexion. As a result, there was a difference in the MTMG-MHMG relationship between the angles. The MTMG significantly correlated with the MHMG only at +30° (r = 0.635, P < 0.05) where passive torque around the ankle has been shown to be near zero in previous studies.
Conclusion
The hardness of the relaxed MG with no passive tension appears to depend on its size.
Muscles become harder under several conditions, including those involving cramps, spasms, and damage (1–3). Hence, quantitative measurement of muscle hardness is useful to objectively evaluate the muscle condition (4, 5). Although muscle hardness may be related to muscle size (6), this association has not yet been empirically verified.
Magnetic resonance elastography has often been used to evaluate muscle hardness (6–10), but this has poor applicability to practical uses in field studies dealing with large numbers of subjects. We expected that ultrasound real-time tissue elastography could overcome this concern. In fact, some researchers (3, 5, 11) have demonstrated the potential of this technique to measure muscle hardness and to produce a two-dimensional hardness map of the muscle. Considering that cramping commonly occurs in muscles of the legs and feet (12), this study quantified the hardness of the medial gastrocnemius muscle (MG), one of the plantar flexors, at several ankle joint angles using ultrasound real-time tissue elastography and investigated their relationships with the size of the MG.
Material and Methods
Subjects
After having provided written informed consent, 12 young male subjects (age 25 ± 4 years, body height 173 ± 5 cm, body mass 65 ± 8 kg; mean ± standard deviations [SDs]) participated in the present study. They had no orthopedic abnormality in their right legs. The Ethics Committee of the Japan Institute of Sports Sciences approved this study.
Measurement of muscle thickness of MG
In this study, muscle thickness of the right MG (MTMG) was measured by ultrasonography as an index of muscle size because muscle thickness is closely related to the cross-sectional area (13–15) and volume (16) of limb muscles. An experienced examiner performed this measurement. The MTMG was determined at 30% of the lower leg length from the popliteal crease to the lateral malleolus (17). At this point, almost the maximum cross-sectional area of the MG was observed (18) and at the part where the MTMG was the thickest in the mediolateral direction (19). During the measurement of the lower leg length to the nearest 0.5 cm with a cloth tape, the subjects stood with their leg muscles relaxed. After the measurement site was marked with a pen, each subject was instructed to lie in a prone position on a test bench and the right ankle was secured to a handmade apparatus made of duralumin by a non-elastic belt, with the hip and knee joints fully extended (Fig. 1). The apparatus was placed onto a test chair. Measurements of the MTMG with the ankle positioned at +30°, 0°, and –20° (0°: neutral position, positive values indicating plantar flexion) were performed twice using a B-mode ultrasonic apparatus (EUB-7500, Hitachi Medical Corporation, Chiyoda-Ku, Tokyo, Japan), respectively. An electronic linear array probe (EUP-L53, 7.5 MHz wave frequency, Hitachi Medical Corporation, Chiyoda-Ku, Tokyo, Japan) was prepared with water-soluble transmission gel and was longitudinally applied on the posterior skin surface over the belly of MG at the measurement site without depression of the tissues. After obtaining the longitudinal ultrasound images, the MTMG defined as the distance from the adipose tissue-muscle interface to the MG-soleus interface was measured to the nearest 0.1 mm using ImageJ software (National Institute of Health, Bethesda, MD, USA). Mean values of the two measurements were used for further analysis. The coefficient of variation (CV) for them was 1.3 ± 1.0% with an intraclass correlation coefficient (ICC) (1, 2) of 0.993 (P < 0.001).

Experimental set-up and images obtained by ultrasound real-time tissue elastography. MG = medial gastrocnemius
Measurement of muscle hardness of MG
Muscle hardness of the right MG (MHMG) was determined using real-time tissue elastography images obtained by the aforementioned ultrasonic apparatus while the subjects maintained the same posture as for the MTMG measurement. The basis of tissue elasticity imaging with this ultrasonic apparatus has been described previously (20, 21). An experienced operator did the MHMG measurement. As shown in Fig. 1, two types of custom-made tissue mimicking materials (OST Co., Ltd., Kashiwa-shi, Chiba, Japan) of known hardness were placed at the posterior skin surface over the belly of MG at a site similar to the MTMG measurement site. The harder tissue mimicking material (30 kPa: W 60 mm × L 110 mm × H 5 mm) was applied on the skin and the softer one (7 kPa: W 60 mm × L 110 mm × H 10 mm) was put on top of it. To visualize the MHMG, the electronic linear array probe was placed on the tissue mimicking materials and was manually and repeatedly pressed into them while monitoring the bar of the pressing velocity incorporated into the ultrasonic apparatus (Fig. 1). This rhythmical compression-relaxation cycle was regard as proper only if the bar showed 3–4 on a scale from 1 to 7 (3). Water-soluble transmission gel was applied to each contact surface.
Ultrasound real-time tissue elastography generated color-coded images with a scale from red (soft) to blue (hard) depending on the magnitude of strain automatically calculated by comparison of two consecutive frames (Fig. 1). Up to 218 elastography images were saved in the ultrasonic apparatus at 14–16 Hz. Of these images, a single image, on which (a) the colors of each tissue mimicking material were clearly visible and (b) the number shown in the bar of the pressing velocity was 3 or 4, was selected to determine the MHMG (Fig. 1). In the image, the rectangular regions of interest (ROIs) were individually set on the tissue mimicking materials and MG to be as large as possible (Fig. 1). The strains within each ROI were automatically measured using the built-in software in the ultrasonic apparatus. In each condition, an equation for calculating the hardness from the strain was derived from the linear relationship between hardness and strain of the tissue mimicking materials and the measured strain of MG was substituted into this equation to calculate the MHMG.
Initially, the MHMG measurement was performed once at each ankle joint angle. The order of angles was set randomly for each subject. This procedure was then repeated. That is, the MHMG was determined twice at each ankle joint angle. The mean value of two MHMG measurements was adopted as the representative value. The CV in the two measurements was 3.6 ± 2.8% and the ICC (1, 2) was 0.866 (P < 0.001).
To ensure day-to-day reproducibility of the measurements, the same procedures were performed on another day for three subjects. The CVs of the two measured values were 2.2 ± 1.5% for the MTMG and 5.2 ± 3.0% for the MHMG.
Statistical analyses
Descriptive data are presented as means ± SDs. A one-way analysis of variance (ANOVA) with repeated measures followed by Bonferroni's test was used to test the differences in each of the MTMG and MHMG among the ankle joint angles. For each ankle joint angle, Pearson's product-moment correlation coefficients between the MTMG and MHMG were calculated. All statistical analyses were performed using SPSS software (12.0J, SPSS Inc., Chicago, IL, USA). Statistical significance was set at P < 0.05.
Results
The MTMG and MHMG at each ankle joint angle are shown in Fig. 2. There were no significant differences in the MTMG among these angles. However, the MHMG was significantly higher at −20° than at others (vs. 0°: P < 0.05; vs. +30°: P < 0.001) and the MHMG at 0° was significantly higher than that at +30° (P < 0.01). The MHMG was significantly correlated with the MTMG at +30° (r = 0.635, P < 0.05) whereas the corresponding correlations were not significant at 0° (r = 0.174, P > 0.05) and −20° (r = −0.017, P > 0.05) (Fig. 3).

Muscle thickness and hardness of medial gastrocnemius (MTMG (▴) and MHMG (▪), respectively) at each ankle joint angle (n = 12). The ankle joint angle of 0° was the neutral position, and positive values reflect plantar flexion. *(P < 0.05), **(P < 0.01), ***(P < 0.001) = Significant difference between ankle joint angles
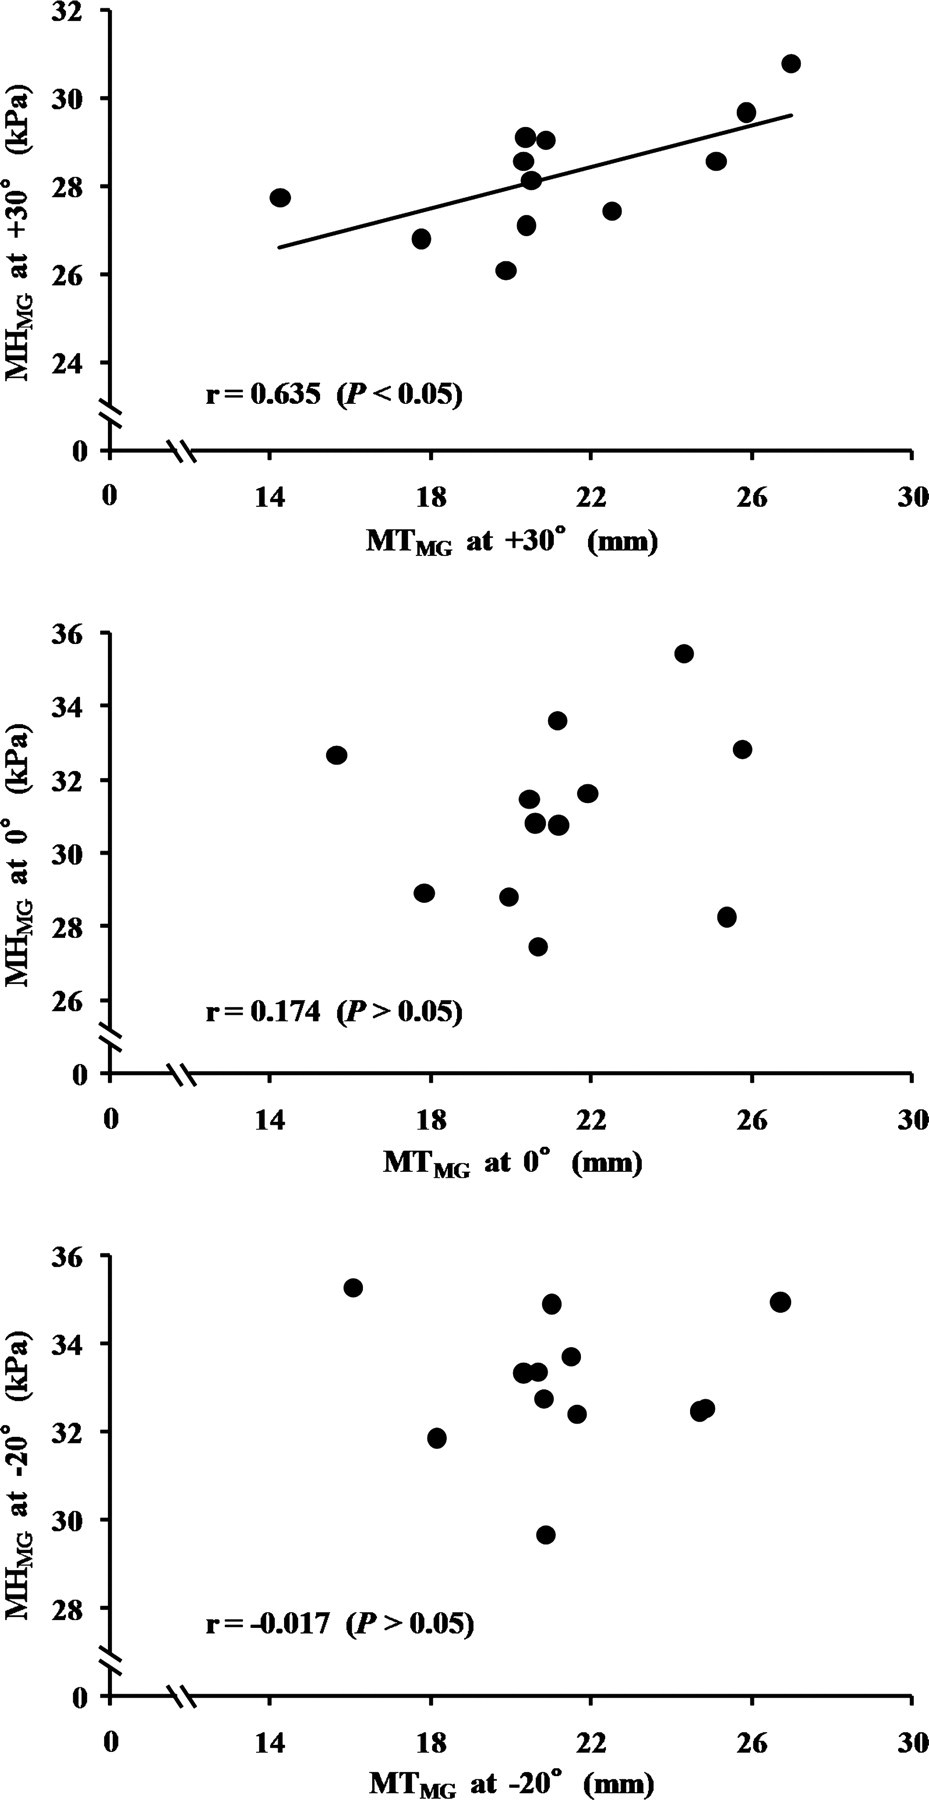
Relationship between muscle thickness and hardness of medial gastrocnemius (MTMG and MHMG, respectively) at each ankle joint angle (n = 12). The ankle joint angle of 0° is the neutral position, and positive values indicate plantar flexion
Discussion
The MHMG could be determined by ultrasound real-time tissue elastography, and was found to vary significantly among the ankle joint angles (Fig. 2), supporting a previous study of muscle hardness of the lateral gastrocnemius (one of the plantar flexors) determined by magnetic resonance elastography (22). As the ankle is moved from plantar flexion to dorsiflexion, the passive tension of the plantar flexors is increased. Considering the model of muscle hardness developed by Dresner et al. (6), this fact should result in differences in MHMG among ankle positions. However, there were no significant differences in the MTMG among them. This is consistent with a previous report (23). Thus, the discrepancy in ankle joint angle dependence between MTMG and MHMG appears to affect the difference in the MTMG-MHMG relationships among their angles (Fig. 3).
Only at +30° of ankle joint angle, where the MG length was lower than at other angles and passive torque around the ankle has been shown to be near zero (24, 25), was the MTMG-MHMG correlation significant (Fig. 3). This indicates that the hardness of the relaxed MG with no passive tension is affected by its size. Wakahara et al. (26) reported that inter-individual differences in mechanical loading on muscle during daily life can result in corresponding variability in muscle size. Therefore, there is a possibility that larger muscles subjected to higher muscle loading during daily life accumulate damage and thus become harder. Meanwhile, at 0° and –20°, the passive tension of the plantar flexors increased the MHMG as described in a previous study (6). Hence, it is likely that the MTMG-MHMG correlations disappeared at these ankle joint angles. When muscle hardness is evaluated by palpation, the relaxed muscle with no tension seems to be mainly examined. Moreover, given that the frequent occurrence of nocturnal muscle cramp is explained by the human habit of sleeping with extended feet and thus shortened plantar flexors (27), cramp is suggested to occur typically in the plantar flexed position. From a viewpoint of objective evaluation of muscle condition, therefore, the hardness of a muscle without passive tension appears to be more important than that with it. Taking this idea into account together with the present results, the greater muscle affects more positively the muscle force-producing characteristics (28, 29) and more negatively the muscle condition. We need to note this possibility in order to find a way to increase the muscle size while preventing related muscle injuries.
Limitations associated with the present approach are as follows. The electronic linear array probe was manually and repeatedly pressed into the tissue mimicking materials to obtain ultrasound real-time tissue elastography images, indicating that ability of operators is required to use ultrasound real-time tissue elastography. In other words, this ability may affect the values of muscle hardness obtained by this technique. However, the above rhythmical compression-relaxation cycle was performed while monitoring the bar of the pressing velocity incorporated into the ultrasonic apparatus. In addition, a single image on which the number shown in the bar of the pressing velocity was 3 or 4 on a scale from 1 to 7 (3) was selected to determine the MHMG (Fig. 1). Thus, the present approach was designed to reduce the operator-dependence on the values of muscle hardness beforehand. In this study, an experienced operator performed the MHMG measurement. The repeatability of the two measured values of MHMG (CV: 3.6 ± 2.8%, ICC (1, 2): 0.866 [P < 0.001]) and the day-to-day reproducibility of the MHMG measurement (CV: 5.2 ± 3.0%) were good. Consequently, the aforementioned drawback of ultrasound real-time tissue elastography measurement should have a small effect on the present findings.
Another limitation is that only young male subjects who had no orthopedic abnormality in their right legs participated in the present study. Previously, it has been shown that muscle hardness differs between normal and diseased MG (7). Hence, the comparison between them is considered to be essential for testing the generalizability of the present findings. Moreover, the muscle size-hardness relationship may also depend on age and gender because these are suggested to be factors capable of influencing muscle hardness (8, 10). Thus, further studies of both men and women with a wide range of age are also required to more precisely discuss the present theme. In the current study, however, it was first shown that the muscle size can be a determinant of muscle hardness by experimental data. This is expected to be useful for finding a way to develop training programs and/or to prevent muscle injuries.
In conclusion, we could quantify the MHMG using ultrasound real-time tissue elastography. The MHMG significantly increased as the ankle was moved from plantar flexion to dorsiflexion. Only at +30° of ankle joint angle, i.e. at neutral plantar flexion, the MTMG significantly correlated with the MHMG, suggesting that the hardness of the relaxed MG with no passive tension depends on its size.
Footnotes
Acknowledgements
We thank Dr Yoshihiko Arao for his advice on the material mechanics. This study was partly supported by a Grant-in-Aid for Research Activity Start-up (No. 22800089; RA).