




Abstract
Background
Computed tomography (CT) of the brain is performed with high local doses due to high demands on low contrast resolution. Advanced algorithms for noise reduction might be able to preserve critical image information when reducing radiation dose.
Purpose
To evaluate the effect of advanced noise filtering on image quality in brain CT acquired with reduced radiation dose.
Material and Methods
Thirty patients referred for non-enhanced CT of the brain were examined with two helical protocols: normal dose (ND, CTDIvol 57 mGy) and low dose (LD, CTDIvol 40 mGy) implying a 30% radiation dose reduction. Images from the LD examinations were also postprocessed with a noise reduction software with non-linear filters (SharpView CT), creating filtered low dose images (FLD) for each patient. The three image stacks for each patient were presented side by side in randomized order. Five radiologists, blinded for dose level and filtering, ranked these three axial image stacks (ND, LD, FLD) as best to poorest (1 to 3) regarding three image quality criteria. Measurements of mean Hounsfield units (HU) and standard deviation (SD) of the HU were calculated for large region of interest in the centrum semiovale as a measure for noise.
Results
Ranking results in pooled data showed that the advanced noise filtering significantly improved the image quality in FLD as compared to LD images for all tested criteria. No significant differences in image quality were found between ND examinations and FLD. However, there was a notable inter-reader spread of the ranking. SD values were 15% higher for LD as compared to ND and FLD.
Conclusion
The advanced noise filtering clearly improves image quality of CT examinations of the brain. This effect can be used to significantly lower radiation dose.
A recent dose survey stated that CT examinations account for 7% of all radiological examinations but contribute with 56% of the total patient radiation dose of all radiological examinations (1). Thus, computed tomography (CT) accounts for a disproportionately large part of the population radiation dose generated by radiological examinations.
CT of the brain has high demands on low contrast resolution because the difference between gray and white matter attenuation is not more than approximately 7–9 Hounsfield units (HU). Detection of this difference or the diminishment of it, as for example in acute stroke, requires a narrow window width, which increases sensitivity to image noise. Thus, CT of the brain demands higher local doses as compared to other body areas in order to reach acceptable noise levels (2). Collected evidence for the true risk level for morbidity of any kind associated with the high dose levels used in brain CT is still insufficient. The few studies addressing this question are mainly performed on pediatric patients at dose levels considerably exceeding current reference values (3, 4). However, it is generally accepted that dose reduction and dose optimization has high priority in CT, especially in high dose examinations as brain CT.
Dose reduction from established dose levels is accompanied by artifacts such as increased image noise that may deteriorate image quality below diagnostic requirements (5). It is possible to decrease radiation dose with preserved original noise levels if image noise can be reduced by postprocessing. Several approaches for noise reduction in CT have been presented in recent years and most CT manufacturers offer proprietary noise reduction strategies in their recent scanners (6–9). SharpView CT (SharpView AB, Linköping, Sweden), however, is an advanced filtering module compatible with any CT scanner regardless of manufacturer and model. It postprocesses reconstructed CT images in order to reduce noise while maintaining structural information (10, 11).
The purpose of this study was to evaluate the impact of postprocessing with SharpView CT on the image quality of brain CT and whether this postprocessing can compensate for image quality loss due to a radiation dose reduction by 30%.
Material and Methods
Study group
Thirty outpatients aged 65 years or older (mean age 78.1 years, range 65–92 years) referred to our department for clinical non-enhanced CT of the brain were included. The study was approved by the local ethic committee and all patients provided their written informed consent.
Scanning protocol
Patients were examined on a 64-slice scanner in 16-slice mode (Brilliance 64, Philips, Best, The Netherlands). Each patient underwent two consecutive scans without repositioning and using the same scout view. The tube current for the normal dose (ND) examination was 355 mAseff resulting in CTDIvol 57.1 mGy, mean DLP 1050 mGycm, and effective dose of 2.2 mSv. The corresponding values for the low dose (LD) examination were 248 mAseff, 40 mGy, mean DLP 736, and 1.5 mSv, resulting in a dose reduction of 30% compared to the normal dose examination. The dose reduction level was chosen based on initial tests on an antropomorphic scull phantom at different dose levels. At the level of 30% dose reduction a clearly visible but not too obvious increase of image noise was seen and filtering these test images resulted in noise levels very similar to normal dose. For this reason 30% dose reduction was assumed as an appropriate level for this study.
Other scan parameters were identical for the two scans: spiral mode, FOV 220 mm, collimation 16 × 0.625 mm, pitch 0.683, rotation time 0.75 s, tube voltage 120 kV, reconstruction filter UB (standard), reconstructed slice thickness 1 mm, reconstruction increment 0.5 mm.
Filtering and image stack preparation
The SharpView CT system uses a hierarchical approach to identify image features at different abstraction levels (11). A combination of adaptive noise suppression, edge enhancement, and spatial consistency are applied to enhance image quality. The image data are divided into several sub-bands which are processed separately. Each band mainly contains similarly sized structures, which allows for processing of anatomical structures by size. After the processing of each frequency band, the enhanced bands are adaptively combined to a result image. Furthermore, the enhancement can be performed at different HU ranges, corresponding to tissue typical HU ranges. The parameters can thus be adapted to different tissue types. According to the manufacturer, filtering with SharpView CT results in enhancement of edges and lines, reduction of noise and artifacts, and enhancement of image contrast. As part of a hospital network SharpView CT can serve all local CT scanners (10). SharpView AB filed for insolvency 2010 and product licenses were taken over by ContexVision AB, Linköping, Sweden.
The 1-mm slices of the low dose examination were sent from the CT scanner to the SharpView CT server for processing with default filter parameters as recommended by the manufacturer and then transferred to a workstation. The mean processing time for a brain CT was less than 1 min.
The three 1-mm image stacks for each patient: normal dose (ND), filtered low dose (FLD), and low dose (LD) were reconstructed into 5-mm axial multiplanar reformations (MPR) and transferred to the PACS for measurements and image quality assessment.
Image quality ranking, measurements
Ranking of ND, LD, and FLD image stacks regarding image quality was performed by five radiologists (four senior neuroradiologists and one experienced resident), all used to the image quality of the ND images but blinded to dose levels and filtering. For each patient the three image stacks were presented randomly side by side on a dual monitor PACS workstation and linked at the same level. Window settings (window width 80 HU, window level 40 HU) and zoom factors were identical allowing the radiologist to scroll simultaneously through all three stacks which were ranked as 1 (best) to 3 (poorest) for three image quality criteria: gray-white matter discrimination (GWD), delineation of basal ganglia (DBG), and general image impression (GI).
Measurements of mean HU were performed in large ROIs (150 mm2) in a homogeneous part of the centrum semiovale by a senior neuroradiologist and the standard deviation (SD) of the HU was calculated.
Statistical evaluation
Mean ranking values for each modality (ND, FLD, LD) and each quality criteria were calculated both for the individual radiologists and for pooled data.
The 2-tailed sign test was used for statistical evaluation and significance was assumed at P < 0.05.
Results
Image quality ranking
In pooled data for all radiologists, ND was ranked 1 (best) in 41.3% for GWD,
A significant difference for all criteria was seen between FLD and LD as well as between ND and LD in favor of FLD and ND, respectively (Table 1). There was a non-significant tendency for better mean ranking values for ND as compared to FLD for all criteria (Table 1). LD showed the poorest mean ranking values for all criteria.
Mean ranking (1 = best, 3 = poorest, best value for each criteria in bold) for pooled data of all radiologists with P values
*Significant P < 0.05
Mean ranking values and P values for each individual radiologist are shown in Table 2. Focusing on the difference between ND and FLD the distribution of the mean ranking values shows that radiologist 1 preferred FLD over ND (significant for 1 criteria) and radiologist 5 ranked ND significantly better than FLD for all three criteria. The other three radiologists (including the resident) showed mixed preferences.
Mean ranking (1 = best, 3 = poorest, best value for each criteria in bold) for the individual radiologists with P values
*Significant P < 0.05
HU measurements
HU measurements showed no differences between the three modalities with almost identical mean values for ND (25.93 HU), FLD (25.79 HU), and LD (25.69 HU).
Mean SD values, as a measure for noise, were similar for ND (2.97 HU) and FLD (3.03 HU) and 15% higher for LD (3.43 HU) as compared to ND. Distribution of the SD values is also presented as a boxplot (Fig. 1).
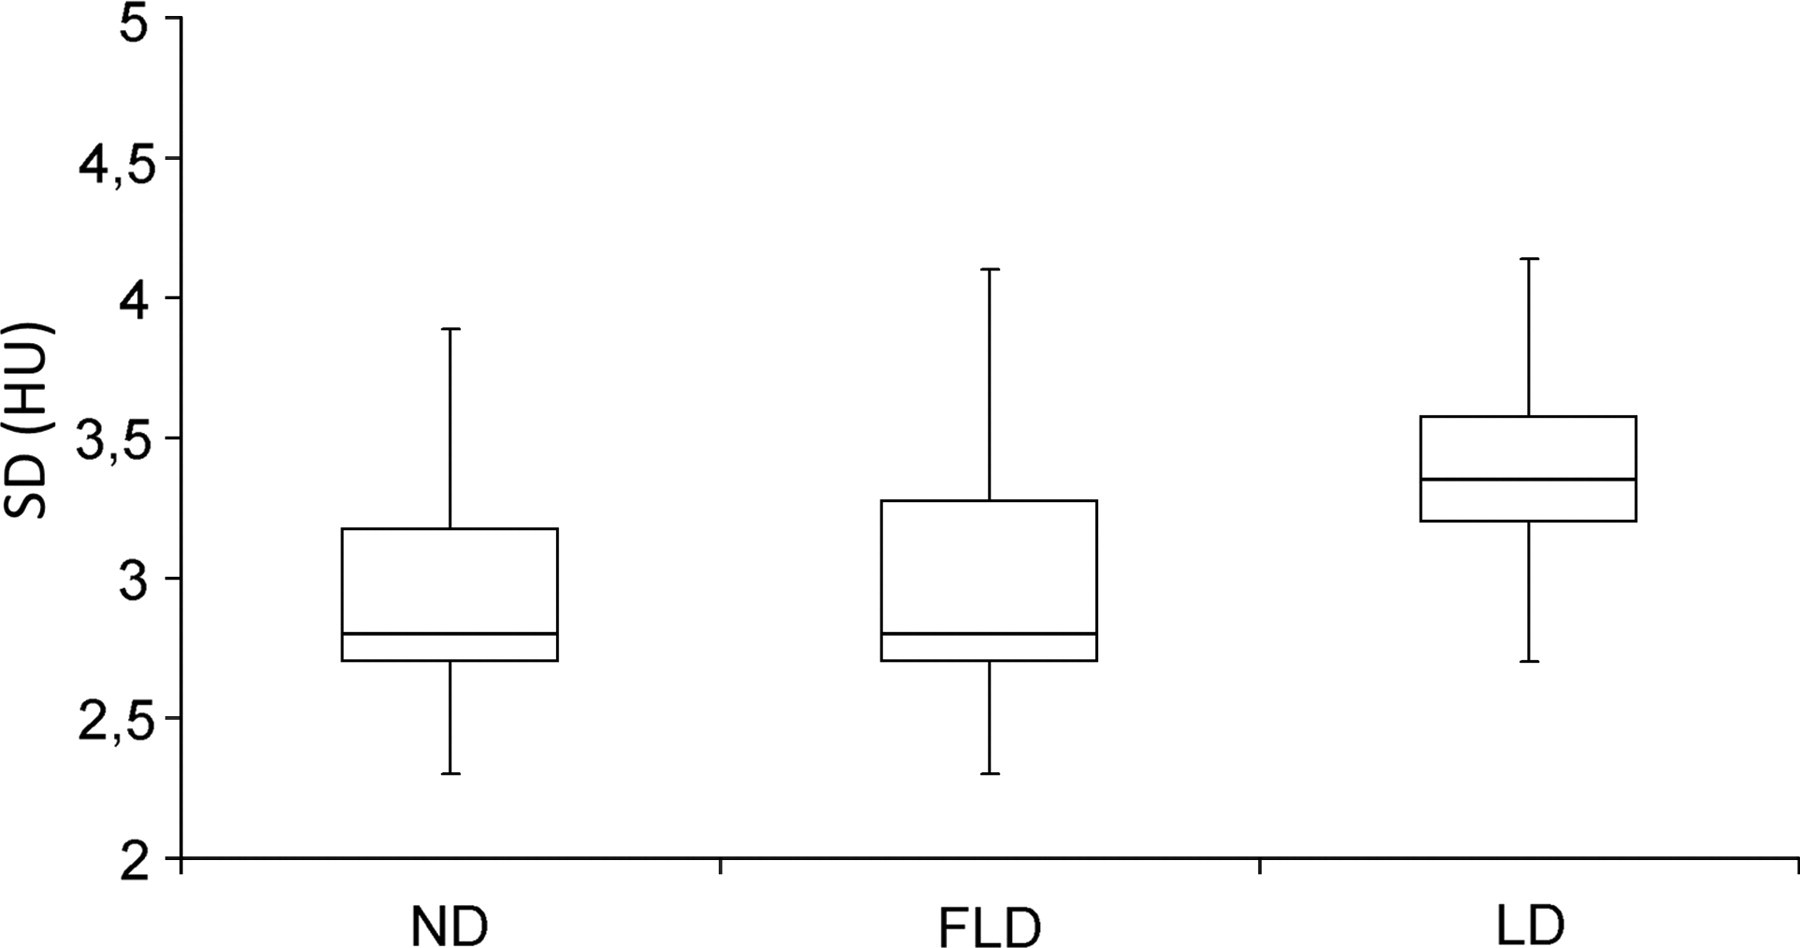
Noise levels. Boxplot of the distribution of mean SD of HU, as a measure for noise, in the centrum semiovale for the three modalities
Discussion
CT of the brain is, compared to body CT, read at a narrower window width because of its high demands on low contrast resolution. For this reason brain CT demands lower noise levels as acceptable in body examinations in order to avoid diminishment of crucial image information, e.g. grey white matter discrimination. This is one reason for the markedly higher reference levels for local dose for brain CT (routine head, 60 mGy) as compared to body CT (routine abdomen, 35 mGy) in the European guidelines on quality criteria for CT (2).
The purpose of the postprocessing filter SharpView CT, evaluated in the present work, is to reduce the increased image noise due to dose reduction while maintaining structural information. Although solutions for filtering are offered by many vendors in their recent scanners an apparent benefit of SharpView CT is its vendor independency as well as its applicability in older scanners.
The results of this study show that SharpView CT significantly improves image quality of examinations performed with 30% lower dose (FLD) as compared to the non-filtered images (LD).
Even though normal dose examinations (ND) received more frequently best ranking for two of the three criteria and showed higher mean ranking for all criteria as compared to FLD, no significant differences between ND and FLD were found in pooled data. Furthermore, the distribution of the HU SD values indicates that the noise levels are similar for ND and FLD. These results indicate that SharpView CT is able to compensate for image quality loss due to a radiation dose reduction of 30% from 57 to 40 mGy (Table 1, Fig. 1).
However, analysis of the ranking results for the individual readers reveals a general problem in subjective image quality assessment. There is a notable spread of preferences even in this group of radiologist adapted to the same image quality. One reader (radiologist 3) even ranked LD images non-significantly better than ND images for one criterion and indicated that the graininess of increased noise to some extent might be perceived as an increased sharpness. One reader (radiologist 5) ranked FLD significantly inferior compared to LD and ND for all criteria, which might be explained by the fact that some radiologists reported a slightly artificial noise impression and smoothing of the FLD images. Noise appearance in brain CT might further be improved by an adjustment of the filtering parameters in SharpView CT.
A few studies investigating the capability of SharpView CT to compensate for dose reduction are published. Three studies investigated clinical or phantom CT of the upper abdomen and found a potential dose reduction in the range of 30–50% (12–14). Results from another study on CT of the paranasal sinuses indicated a dose reduction potential up to 58% (15).
A study addressing the potential for dose reduction with SharpView CT in CT of the brain was presented by Ledenius et al. (16). In this study on pediatric patients artificial noise was added to the raw data of clinical examinations, simulating a dose reduction in two pediatric age groups (1–5 and 6–10 years). Similar to our study several image quality parameters were evaluated but in a rating procedure for each image stack independently and not in a direct side-by-side comparison. The authors concluded that SharpView CT enables a dose reduction of 15% (27 to 23 mGy) in the supratentorial part of the brain for the older age group with maintained image quality, whereas the results for the younger age group were inconclusive. However, compared to our study, dose levels for normal dose examinations were rather low considering the difference in head size between pediatric and adult patients. Thus, it can be assumed that the noise levels in normal dose examinations were higher in the study of Ledenius et al. (16) as compared to normal dose examinations in our study, although noise values are not specified.
The difference in reachable dose reduction between our study and Ledenius et al. (16) indicates that the performance of SharpView CT also depends on the basic noise level. Noisy source image material most likely limits the processing algorithms to restore structural information.
Evaluating the effect of dose reduction measures in clinical examinations is ideally done by assessing the differences in image quality and accuracy regarding a variety of subtle pathologies in a patient group with reduced dose examinations and a control group with normal dose examinations. However, this approach is time-consuming and needs large numbers of patients in order to perform comparisons in matching patient groups. Another apparent drawback of this approach is the heterogeneous comparison material with high inter-individual differences in image quality, which tends to diminish detectable differences in image quality.
The approach chosen for this study was instead to assess a set of diagnostic imaging criteria by means of image quality ranking performed by several radiologists. Normal dose examinations (ND) as the gold standard were compared in a side by side setup to filtered low dose (FLD) and low dose examinations (LD) with every included patient as its own control and the readers blinded for dose and filter related information. The benefit of this design is an exceptionally comparable image material throughout the three tested modalities with identical slice positions at all levels, enabling detection of subtle changes in image quality, even in a small study group. The most noise and low-contrast sensitive quality criteria in the European guidelines on quality criteria for CT were used for the ranking of the image quality (2).
For further studies a comparison between image data-based postprocessing filters like SharpView CT with recent partly raw data-based filters offered by several CT vendors like ASIR (GE), iDose (Philips), SAFIRE (Siemens), and AIDR (Toshiba) would be interesting to perform in the future (6–9).
In conclusion, filtering with SharpView CT clearly improves image quality of CT examinations of the brain. This effect can be used to significantly lower radiation dose. No significant differences were found between image quality ranking of normal dose examinations at 57 mGy and filtered low dose examinations with 30% reduced dose.
Footnotes
ACKNOWLEDGEMENTS
The authors thank Håkan Lövkvist, Competence Centre for Clinical Research, Skåne University Hospital, Lund for statistical evaluations. This work was supported by grants from the Center for Medical Imaging and Physiology, Skåne University Hospital, Lund, Sweden and SharpView AB, Linköping, Sweden.