
Abstract
Background
Tissue-specific gadolinium-based contrast agents such as Gd-BOPTA, Gd-EOB-DTPA are increasingly used for liver imaging. Despite the added value of the hepatobiliary phase a proper arterial phase is still critical, especially in patients with chronic liver diseases. So far, there are limited data in the literature about the effect of the injection speed of Gd-EOB-DTPA in liver and vessel enhancement.
Purpose
To evaluate the effect of injection rate on the enhancement of liver parenchyma and vasculature in Gd-EOB-DTPA-enhanced liver MRI.
Material and Methods
Eighty patients who underwent Gd-EOB-DTPA-enhanced liver MRI (1.5T multichannel MR-system) were retrospectively evaluated. We used a Care Bolus technique with an injection rate of 2 mL/s in group 1 (n = 40) and a Care Bolus technique with an injection rate of 1 mL/s in group 2 (n = 40) to determine the start of the arterial-dominant phase. Signal intensities were measured in vascular structures and liver parenchyma. Signal-to-noise-ratio (SNR), SNR increase (SNRi), and percentage enhancement (PE) were calculated and compared by a students t-test.
Results
The SNR, SNRi, and PE of the aorta in the arterial phase were significantly higher in group 2 in comparison to group 1 (P = 0.007, P = 0.0043, and P < 0.001, respectively). There were no significant differences concerning the SNR, SNRi, or PE of the portal vein and the normal liver parenchyma between both groups at all time points.
Conclusion
The study shows that a lower injection rate of 1 mL/s enables a higher enhancement in the aorta in the arterial phase compared with Gd-EOB-DTPA-enhanced MRI with the more commonly used injection rate of 2 mL/s.
Keywords
MRI including dynamic post-contrast imaging is considered to be one of the most sensitive modality for the detection and accurate characterization of focal liver lesions (1–9). Recently, tissue-specific gadolinium-based contrast agents (Gd-BOPTA, Gd-EOB-DTPA) have gained importance for liver imaging (10–14). Despite the added value of the hepatobiliary phase a proper arterial phase is still critical, especially in patients with chronic liver diseases (6,15,16).
For the more recently approved Gd-EOB-DTPA (Primovist, Eovist, Bayer Schering Pharma, Berlin, Germany) it is known that its relaxivity in human plasma is higher than in standard ECCM approximately by a factor of 2 (17), hence low dose use of Gd-EOB-DTPA is possible due to its higher relaxivity.
So far, there are limited data in the literature about the effect of the injection speed of Gd-EOB-DTPA in liver and vessel enhancement. In an animal study, Zech et al. were able to show a significant improvement of the arterial enhancement of the aorta by reducing the injection rate of Gd-EOB-DTPA from the standard value of 2 mL/s to 1 mL/s (18). In a study in humans, MR fluoroscopic triggering technique and slow rate injection improved the quality of arterial phase images in Gd-EOB-DTPA-enhanced MR imaging (19). However, it remained unclear whether the benefit in aortic SNR is due to the better timing or the decreased injection rate. In the study by Chung et al. (20) the benefit of a slower injection rate has been demonstrated on a 3T MR system. However, there are still no data showing the situation at 1.5 T.
The purpose of this study was to compare the enhancement of the liver vasculature and liver parenchyma at arterial, portovenous, and early delayed phase (2 min) following injection of a standard dose of 25 μm Gd-EOB-DTPA at two different injection rates on a 1.5T MR system.
Material and Methods
Study design
This study was designed as a retrospective, interindividual open-label study to compare two different injection rates of Gd-EOB-DTPA-enhanced MRI of the liver.
Patients
Eighty patients (mean age, 58 years) who underwent a dynamic contrast-enhanced MRI with Gd-EOB-DTPA at the same scanner due to clinical indications between March 2009 and November 2009 were included in this study retrospectively. A change in injection speed was introduced in our routine protocol in between this time interval, so that equal groups with each 40 patients were formed. None of the patients had an impaired arterial or portovenous blood supply of the liver or a venous congestion. In all patients we used a Care Bolus technique to determine the start of the arterial-dominant phase of the liver after bolus injection of 25 μmol Gd-EOB-DTPA/kg BW. For this Care bolus technique a time-resolved single slice T1-weighted sequence in sagittal orientation was planed covering the aortic arch. Once enhancement was seen in the aortic arch the sequence was started with a delay of 8 s (in the clinical routine we found that this delay is optimal to get not only “angiographic” enhancement) and that we like to have not only – whereas it should be noted that for other designed dynamic sequences that might be different). In group 1 an injection rate of 2 mL/s and in group 2 an injection rate of 1 mL/s was used. In all cases a saline chaser of 25 mL NaCl was injected directly afterwards with the same injection rate as the contrast agent was injected. Due to motion artifacts one patient in the second group had to be excluded from the study, so that the study cohort comprised 79 patients. Written and oral informed consent for the MR examination was obtained from each patient prior to the procedure. The study endorsed the principles of the Declaration of Helsinki and subsequent amendments (21). Due to the retrospective nature of the evaluation and since examinations and change of injection rate for the clinical protocol were part of the routine diagnostic, approval of this study was not necessary.
MR imaging
All patients were positioned supine in a 1.5 T MR system (Magnetom Avanto, Siemens Healthcare, Erlangen, Germany) a covered with a phased-array-coil. The routine MR-protocol consisted of unenhanced T1-weighted (w) gradient-echo (GRE) (2D Flash) sequences in- and opposed phased, a single shot T2w sequence (HASTE), a T1w 3D GRE sequence with fat suppression (VIBE) before and 20, 50, and 120 s (depending on patients circulation) after intravenous contrast medium injection as described above, a multishot T2-weighted turbo spin echo sequence with fat saturation and, after a break of 15 min, a T1w GRE with fat saturation (2D FLASH) and the same T1w 3D GRE sequences with fat saturation (VIBE) as used in the dynamic phase. Parallel imaging with an acceleration factor of 2 was used for all sequences. For this retrospective study, only the T1w images unenhanced and T1w images in the arterial, portovenous, and equilibrium phase were evaluated. The exact parameters of this sequence are shown in Table 1.
Sequence parameters of the evaluated T1w 3D GRE sequence
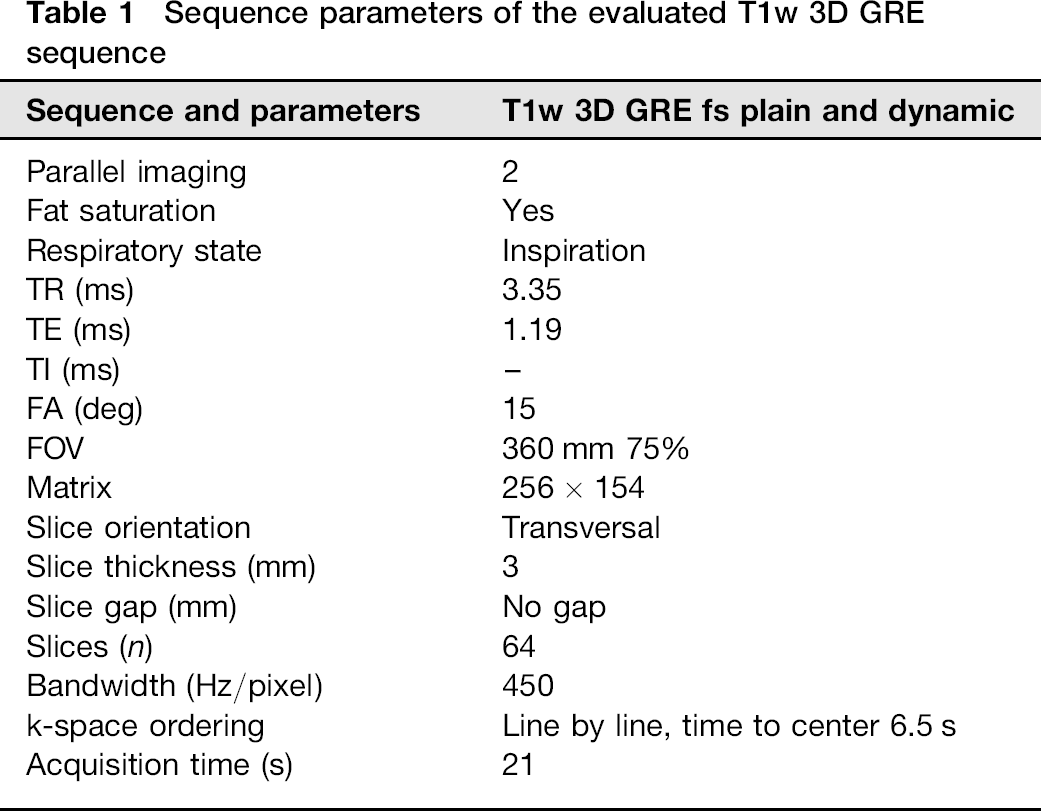
Image evaluation
For the quantitative evaluation, signal intensities (SI) of normal liver parenchyma, aorta, and intrahepatic portal vein (PV) were measured at four different time points: in unenhanced, arterial, portovenous, and equilibrium phase on T1 w 3D GRE sequences. Additionally, image noise was measured as the standard deviation of a region-of-interest in the left corner outside the body volume. Afterwards signal-to-noise-ratio (SNR), SNR increase (SNRi), and percentage enhancement (PE) were calculated as follows:
SNR = SI (structure) / Noise (standard deviation of a region-of-interest outside) SNRi = SNR (structure at each time point) - SNR (unenhanced structure) PE = (SNR (structure after application of contrast media) - SNR (unenhanced structure)) / SNR (unenhanced structure) × 100
The SNR values for each structure were subtracted from the corresponding unenhanced image so that the baseline SNR increase (SNRi) is 0 by definition. The SNRi for each structure and time point was calculated and arithmetic means were computed. For the percentage enhancement also means were calculated. The one-sample Kolmogorow-Smirnov test indicated that each sample is normally distributed; therefore, the mean values were compared with a paired two-tailed student t-test with a significance level of 0.05.
Results
The evaluation of the SNR and SNRi showed a signal increase in the aorta, the intrahepatic PV, and also in the normal liver parenchyma after contrast agent injection.
The evaluation of the signal changes in the aorta showed a significant difference in the arterial phase: the mean SNR in the aorta in the arterial phase was significantly higher with 667.0 + / - 349.7 in group 2 with an injection rate of 1 mL/s compared to the SNR = 468.5 + /–286.9 in group 1 with an injection rate of 2 mL/s (P = 0.007) (Fig. 1). There were no significant differences in the aorta in the other time points. There were no significant differences in the SNR of the liver parenchyma and the portal vein between group 1 and group 2 at any time point.
SNR of the aorta. Differences between both groups concerning the 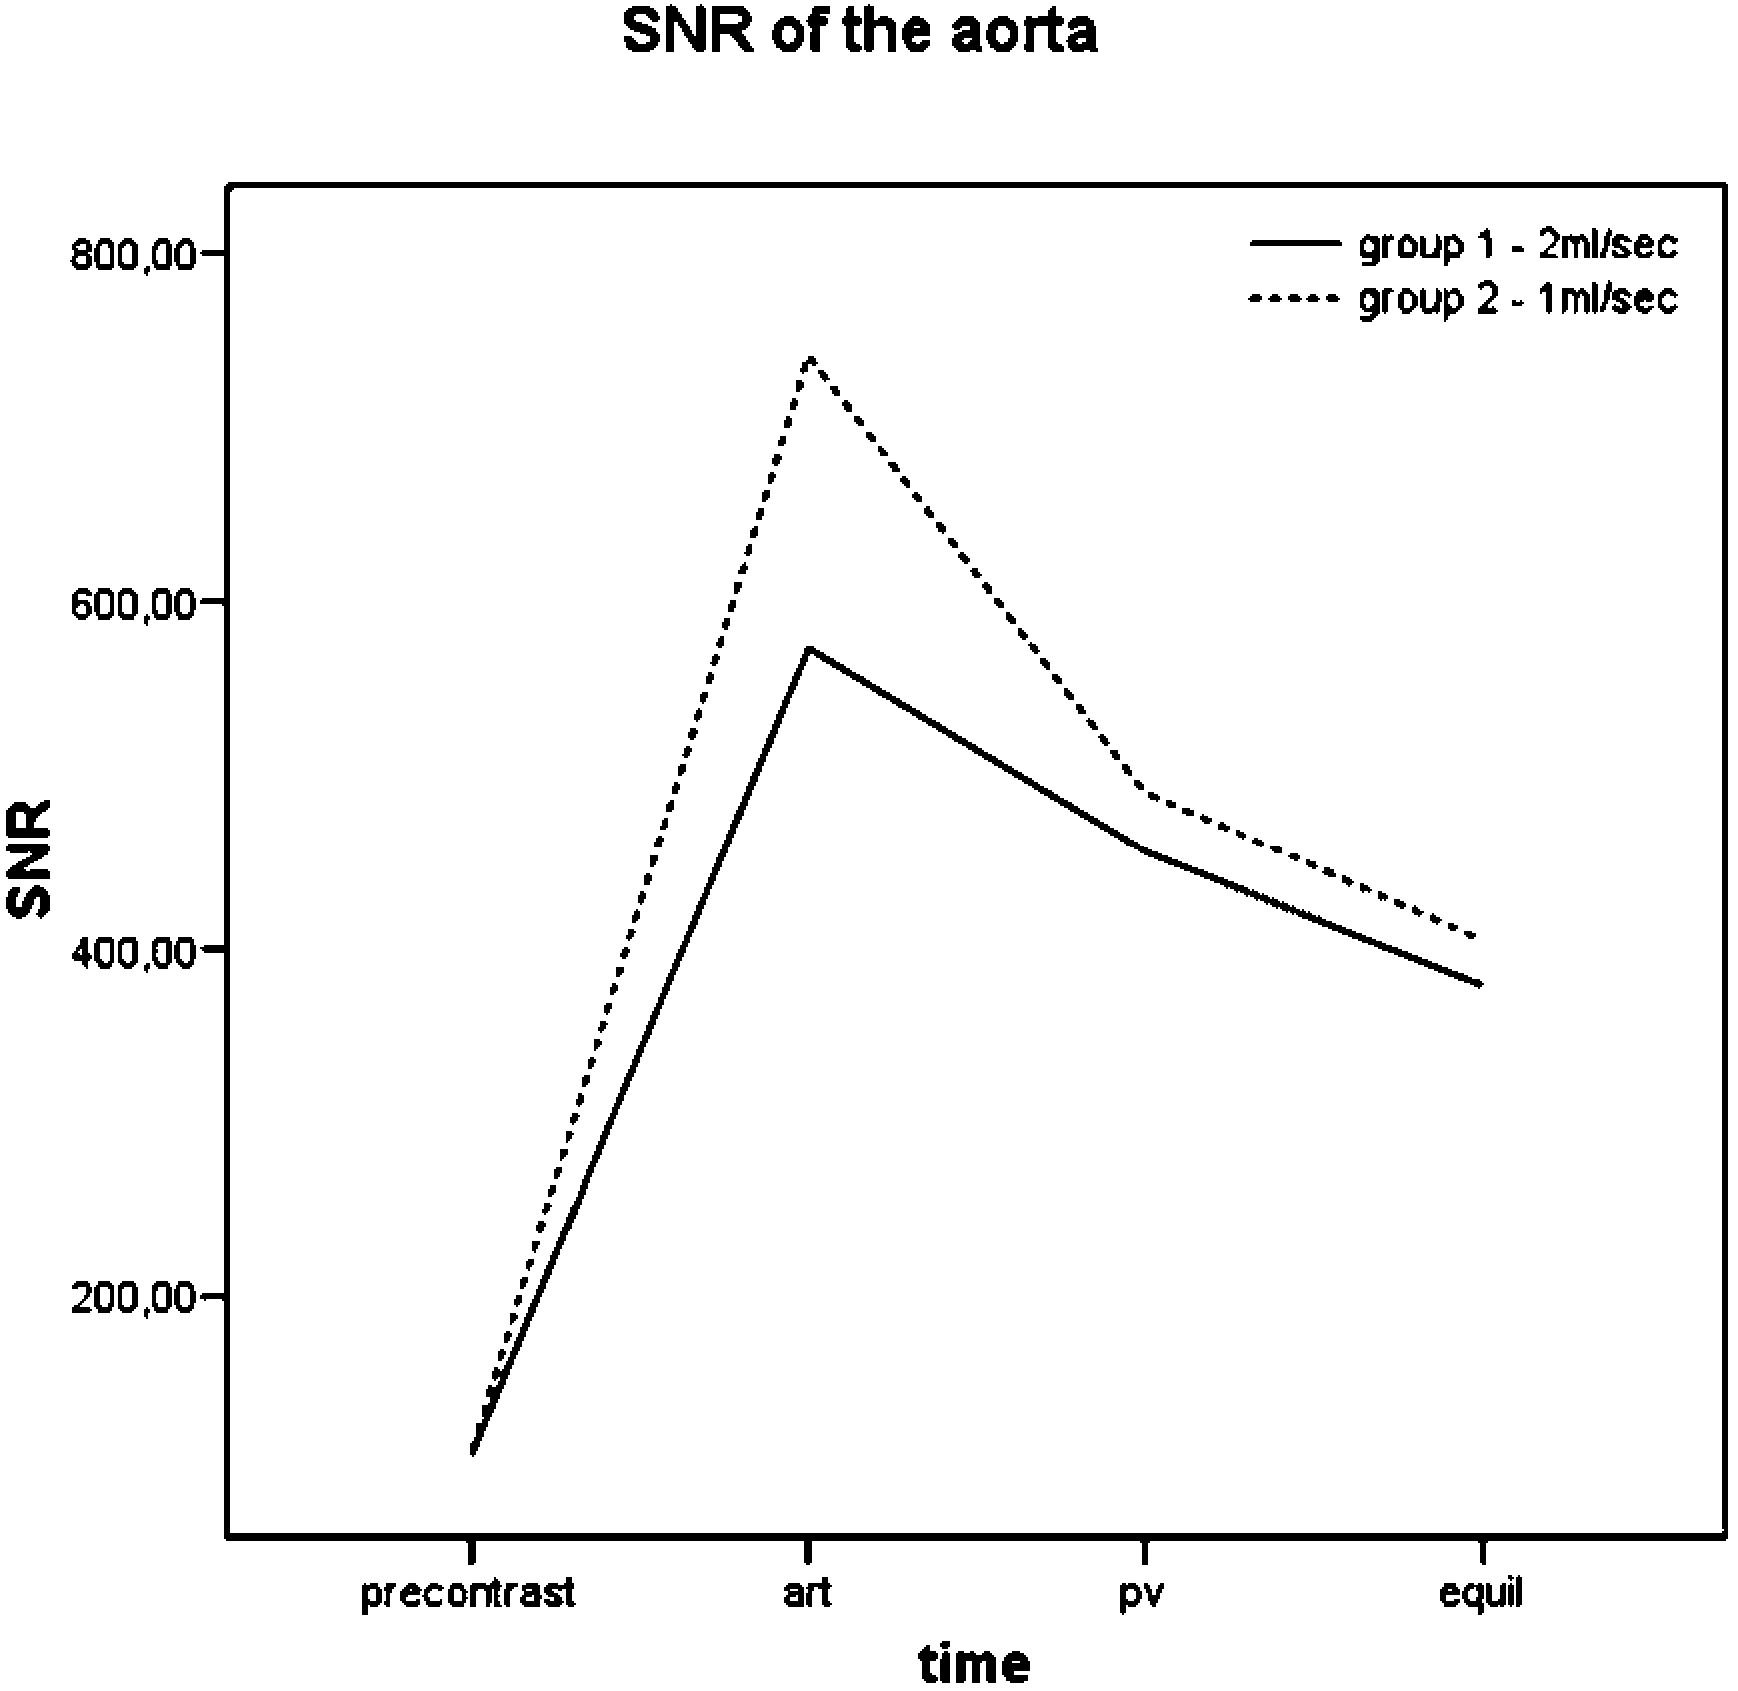
The SNRi of the aorta was significantly higher in the second group with an injection rate of 1 mL/s in comparison to the first group (564.5 + / - 297.9 vs. 380.6 + / - 256.2; P = 0.0043) (Fig. 2). There were no other significant differences concerning the SNRi of the aorta at other time points. The SNRi of the portal vein or the SNRi of the normal liver parenchyma were similar between both groups at different time points (P > 0.05).
SNR increase of the aorta. The 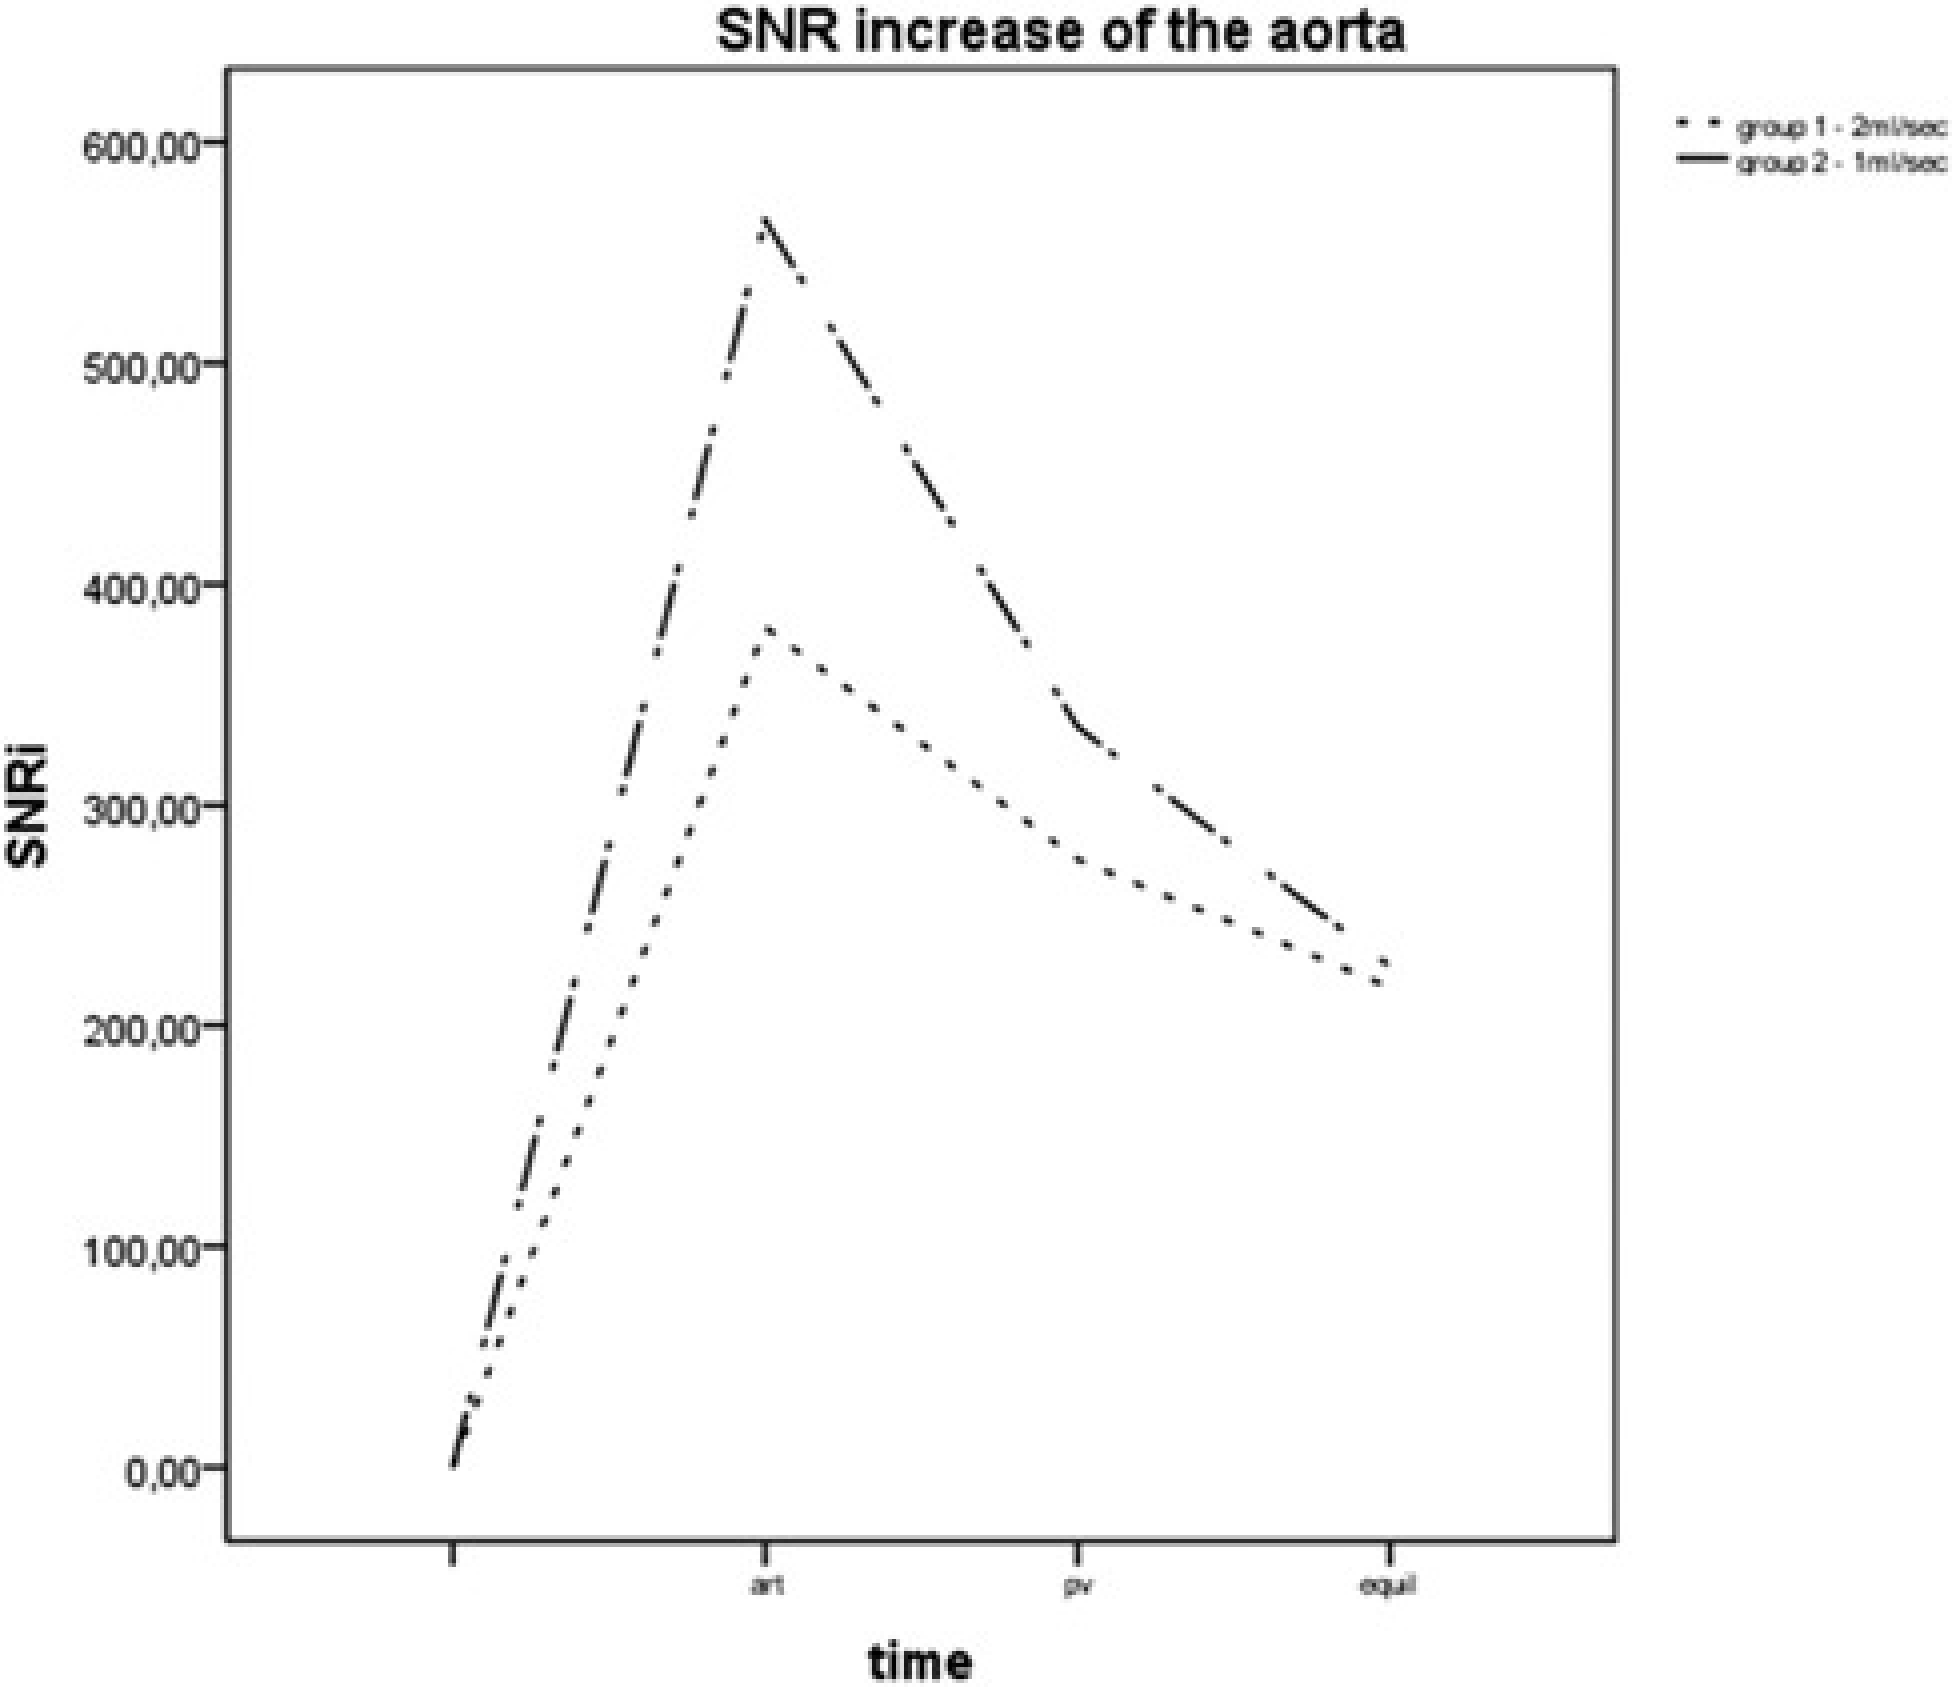
The percentage enhancement of the aorta was significantly higher in group 2 compared to group 1 (593.7 + / - 203.4 vs. 427.8 + /–192.8; P < 0.001) in the arterial phase (Fig. 3a), whereas there were no additional significant differences between both groups concerning the percentage enhancement of the aorta on the other time points. In the portal vein and normal liver parenchyma no significant differences of the percentage enhancement were measured over time (Fig. 3b).
(a) 
Discussion
The results of this study indicate that Gd-EOB-DTPA enhanced liver MR imaging with a decreased injection rate of 1 mL/s can provide a significant higher arterial enhancement of the aorta and aortic perfusion parameters as SNR and percentage enhancement are significantly higher compared with Gd-EOB-DTPA-enhanced MR imaging with the more commonly used injection rate of 2 mL/s.
Although not tested in this manuscript the aortic enhancement can be rendered as a surrogate parameter of enhancement in lesions with arterial hypervascularization (like HCC), as assumed by other publications (22–26). We also did not evaluate the subjective parameter of visual assessment in our interindividual study cohort. However, in one available case of intraindividual comparison between the flow rate of 1 and 2 mL/s in a patient with HCC, we saw visually comparable enhancement between liver parenchyma and vessels and a vascular pseudolesion, respectively (Fig. 4).
A 72-year-old female patient with chronic hepatitis C and 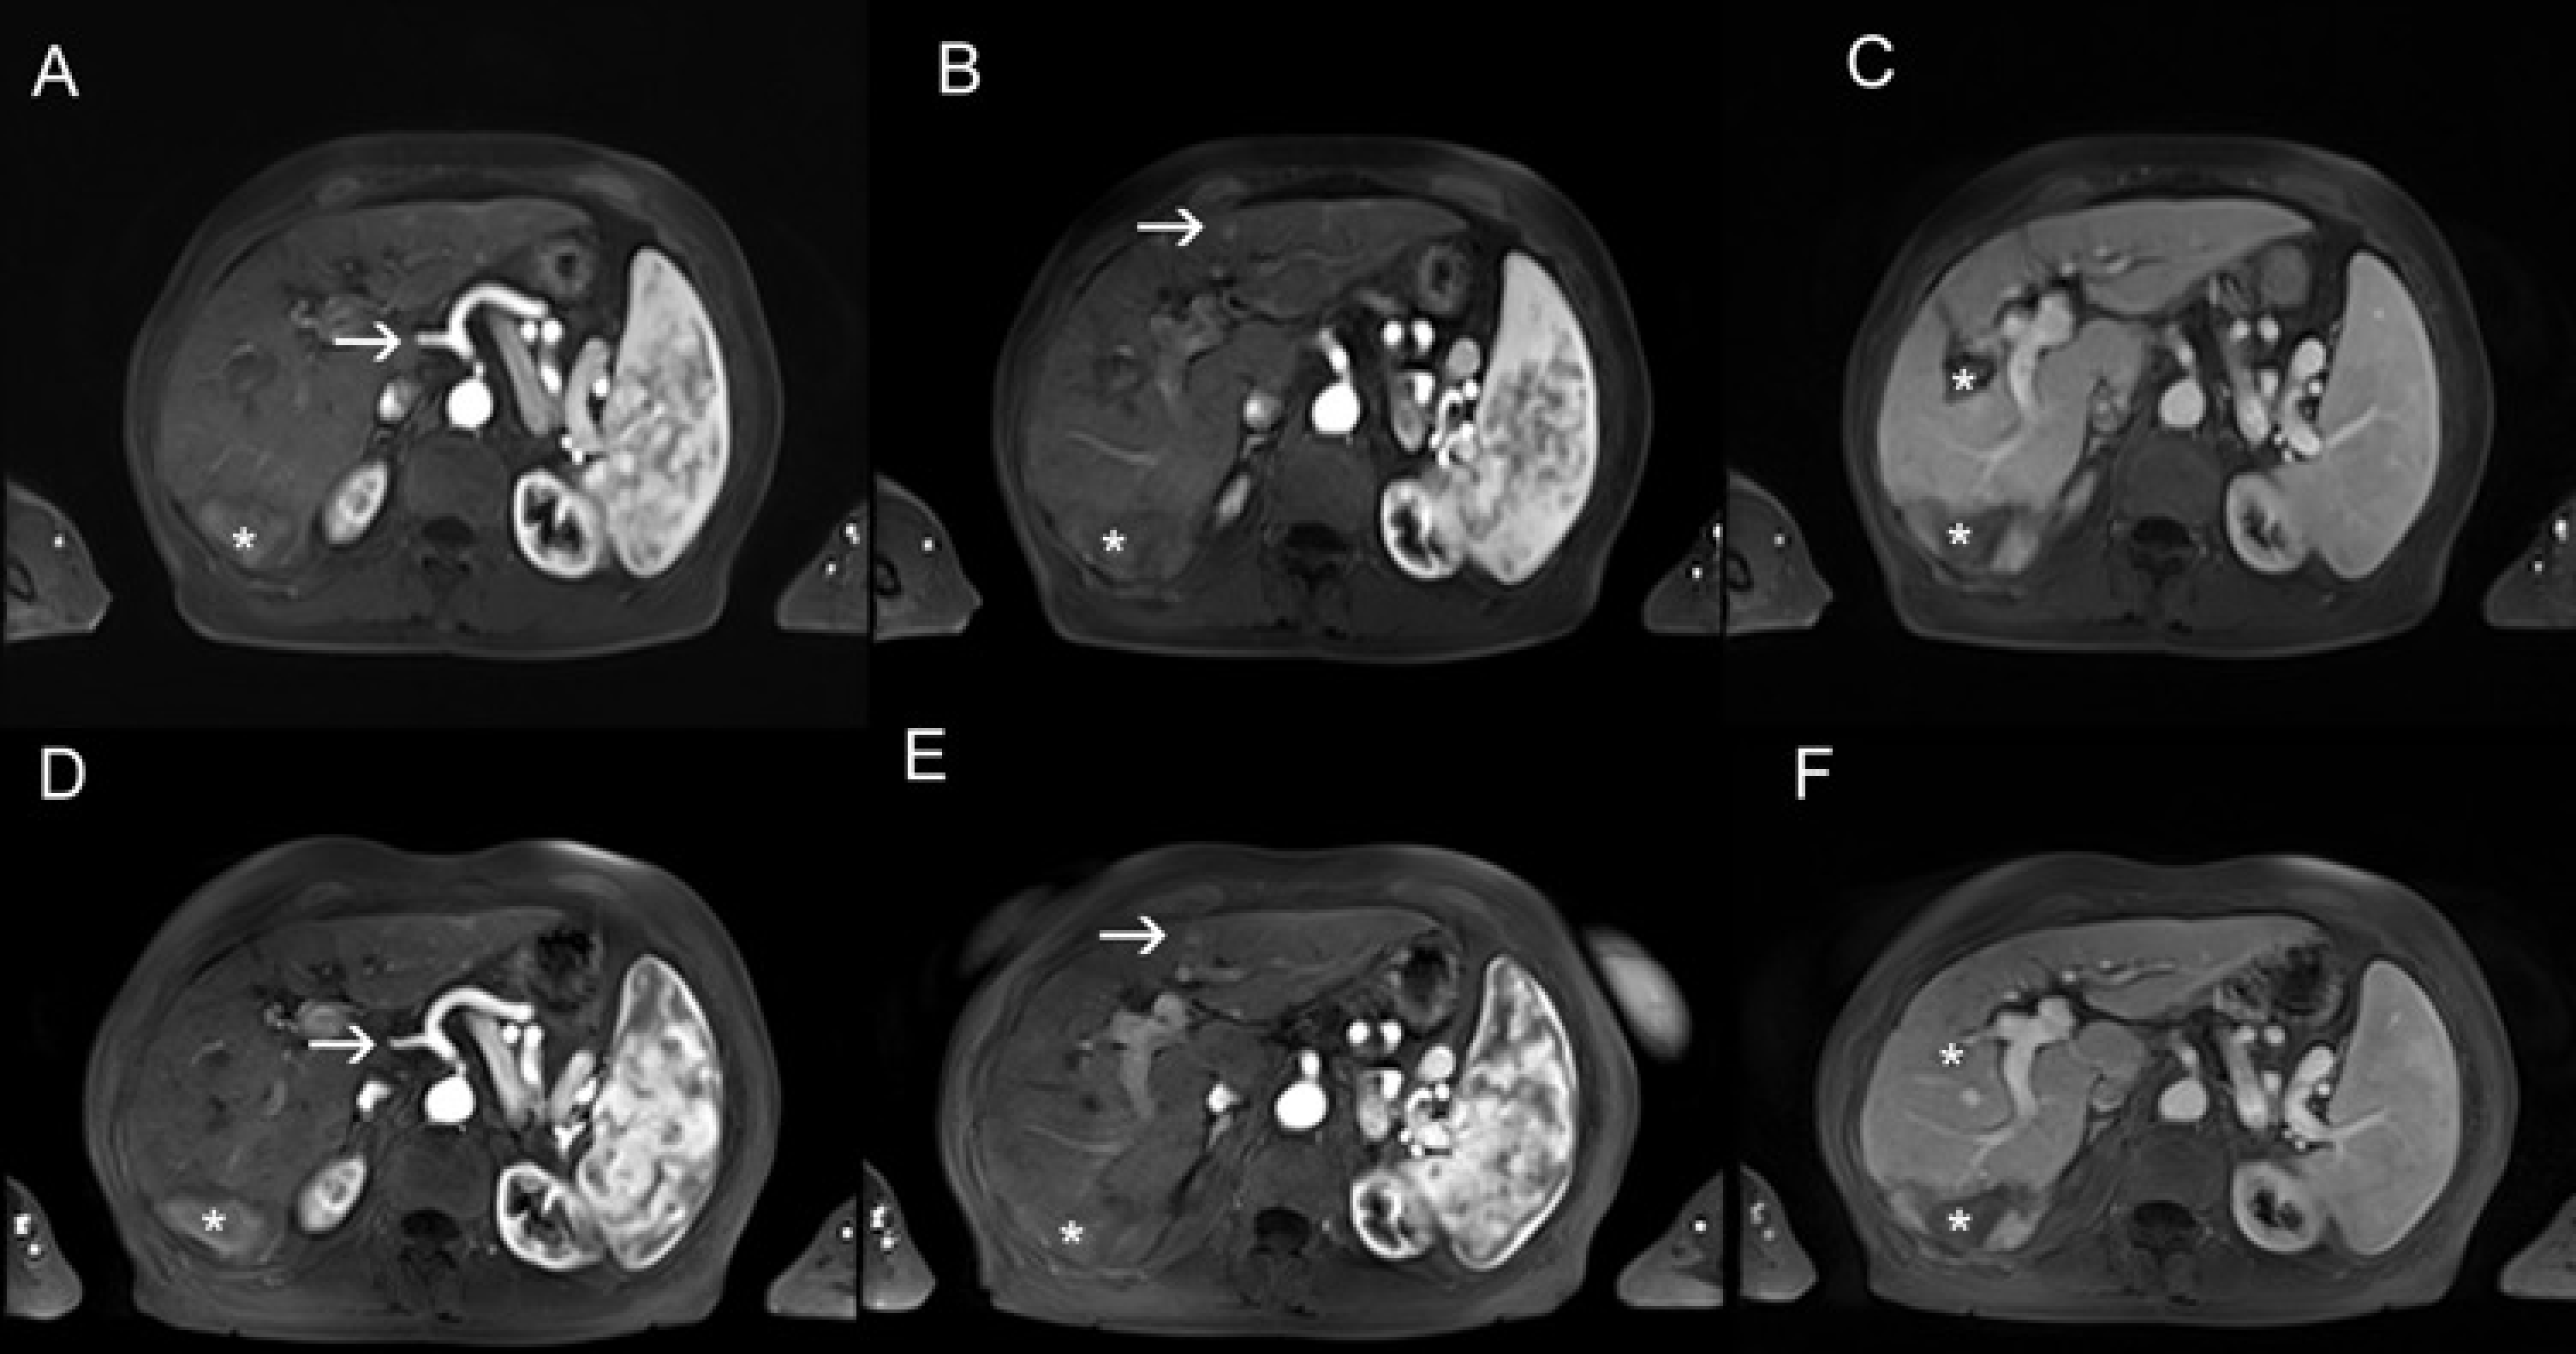
But regardless of individual bolus timing, there are at least three factors which play an important role to reach a proper arterial enhancement on Gd-EOB-DTPA-enhanced MRI and which may underlie our results. First, the k-space filling should match the enhancement peak, second a sufficient protein-binding process of the bolus should be reached and third saturation effects should be avoided: by using a lower injection rate the bolus gets stretched which leads to a more favourable bolus shape; this increases the probability to achieve proper timing of an arterial dominant phase and, therefore, to correctly fill the central k-space of the imaging sequence at the right time regardless of individual bolus timing. Second, Gd-EOB-DTPA is an agent with a weak protein binding in human plasma. The bound fraction of the agent has a higher relaxivity than does the unbound fraction. If the bolus is stretched and not too compact, it has time and valances to establish the protein binding process which can be found if Gd-EOB-DTPA is mixed with human blood, resulting in a higher relaxivity (17). Finally, there is a non-linear relationship between gadolinium concentration and MR signal. This might be responsible for saturation effects in a high concentrated bolus. The contrast to the behavior on helical CT, where an increased injection speed with an increased iodine contrast media delivery rate results in an increased arterial signal enhancement (27,28) can be explained by the linear relationship between iodine concentration and CT enhancement and the very short CT acquisition time of less than 5 s vs. 15–20 s by MRI. In addition, by helical CT, the intravascular bolus is not as compact as it is for dynamic MRI due to the large volume (100 mL) of the contrast agent.
There were no significant differences between both groups concerning the percentage enhancement of the intrahepatic portal vein and the parenchyma of the liver over time. Reason therefore may be that influencing factors like saturation effects, protein binding, and bolus geometry do not play a role once the contrast agent has passed the capillary bed of the bowel and reaches the liver via the portal vein. For the enhancement of venous structures and parenchymal organs, the total dose of the contrast media rather than the injection rate is relevant for the enhancement in more delayed phases, as it is already known from CT (27).
Similar results were described in a study by Chung et al. (20). They found as well a significantly higher SNR of the aorta in the arterial phase using an injection rate of 1 mL/ s in comparison with an injection rate of 2 mL/s on a 3.0 T MR system. However, according to the study of Haradome et al. (19), in 216 patients the injection rate of 1 mL/s in combination with the MR fluoroscopic triggering technique significantly increased not only the SNR of the aorta but also the SNR of the portal vein on arterial phase images on a 1.5T MR system. Therefore the benefit of a slower injection rate without using a MR fluoroscopic triggering technique on a 1.5T MR system remained still unclear.
Our study has limitations due to its retrospective design. This is a single center study using a single scanner. We evaluated interindividual data, but the results of the signal intensity chances of the intrahepatic portal vein and of the liver parenchyma indicate that there were no methodical errors. In addition we compared only two different injection rates and tested only one version of a 3D GRE sequence.
In conclusion, our results show that that a lower injection rate of 1 mL/s Gd-EOB-DTPA enables a higher enhancement of the aorta in the arterial phase and the aortic perfusion parameters, whereas there are no significant signal differences in the intrahepatic portal vein and liver parenchyma.