
Abstract
Background
When the same dose of iodine is given to all patients when performing abdominal computed tomography (CT) there may be a wide inter-individual variation in contrast medium (CM) enhancement of the liver.
Purpose
To evaluate if any of the measures body height (BH), body mass index (BMI), lean body mass (LBM), ideal body weight (IBW), and body surface area (BSA) correlated better than body weight (BW) with hepatic enhancement, and to compare the enhancement when using iodixanol and iomeprol.
Material and Methods
One hundred patients referred for standard three-phase CT examination of abdomen were enrolled. Body weight and height were measured at the time of the CT examination. Forty grams of iodine (iodixanol 320 mg I/mL or iomeprol 400 mg I/mL) was injected at a rate of 1.6 g-I/s, followed by a 50 mL saline flush. The late arterial phase was determined by using a semi-automatic smart prep technique with a scan delay of 20 s. The hepatic parenchymal phase started automatically 25 s after the late arterial phase. CM concentration was estimated by placement of regions of interest in aorta (native and late arterial phase) and in liver (native and parenchymal phase).
Results
BW (r = −0.51 and −0.64), LBM (r = −0.54 and −0.59), and BSA (r = −0.54 and −0.65) showed the best correlation coefficients with aortic and hepatic parenchymal enhancement, respectively, without any significant differences between the measures. Comparing iodixanol and iomeprol there was no significant difference in aortic enhancement. The liver enhancement was significantly higher (P < 0.05) using iodixanol than iomeprol.
Conclusion
To achieve a consistent hepatic enhancement, CM dose may simply be adjusted to body weight instead of using more complicated calculated parameters based on both weight and height.
When evaluating liver masses using computed tomography (CT), a contrast medium (CM) enhancement of 50 Hounsfield Units (HU) of the liver parenchyma has been suggested as a minimum to ensure a high quality CT (1). Factors that have an impact on CM enhancement include CM dose, injection rate, and cardiac output (2–6). Another important parameter is the distribution volume of the CM, i.e. the intra- and extravascular extracellular spaces, which are both related to body size (7, 8). Thus, if the same dose of iodine is given to all patients, which still is a common clinical practice, some patients may receive an unnecessary high dose with a potential risk for nephrotoxic effects, while other patients may receive a dose suboptimal for diagnostic purposes. If the dose of iodine instead is adapted to body weight (BW) a smaller variation in CM enhancement is obtained (9–14).
The blood perfusion does, however, vary between the tissues, where for example muscle tissue and parenchymal organs have a greater perfusion than adipose tissue. For example, the blood flow in a 70 kg resting human has been estimated to be 260 mL/min in adipose tissue, 750 mL/min in muscles, and 1450 mL/min in the liver (15). In addition, adipose tissue contributes minimally to the extracellular volume, i.e. the distribution volume of CM (7, 16). However, when using BW alone it is not possible to distinguish between various tissues. Therefore obese patients have a tendency to get unnecessarily high CM doses while muscular patients may receive too small doses. To compensate for this variability dosage adjusted for lean body mass (LBM) has been suggested (17). LBM refers to the total weight of muscles, organs, and bones without including fatty tissue. LBM can be quantified by bioimpedance, where the percentage fat content is obtained but this is inconvenient in daily practice in the CT suite. Instead calculation algorithms based on body height and weight may be used (18). In obese patients ideal body weight (IBW) has been used for estimating gentamicin clearance (19). Body surface area (BSA) is another technique to adapt dosage of CM to body size. BSA has been found to be more accurate than other body size indexes and it is therefore used for calculating drug dosage for cancer treatment (20). A more homogenous CM-enhancement has been obtained at cardiovascular CT when the dose was tailored to BSA or BW instead of body mass index (BMI) or body height (BH) (21).
In order to reduce the risk of over- or under-dosing CM when performing abdominal CT it may be helpful to adjust the CM dose depending on body size. To our knowledge there is no general agreement on which body parameter that has the greatest influence on CM enhancement, and thereby would be the most effective parameter to compensate for. The aim of the current study was therefore to evaluate if any of the parameters BH, BMI, LBM, IBW, and BSA may have a stronger relationship with hepatic CM enhancement in the parenchymal phase, or with aorta in the late arterial phase, in comparison with BW.
Material and Methods
After approval by the local ethics committee 100 patients (42 women) referred for thoraco-abdominal CT were recruited from November 2008 to February 2012. Patients with liver masses, signs of mesenteric-splenic-portal vein obstruction, or an absolute estimated GFR of <50 mL/min according to the Cockcroft-Gault equation based on adjusted body weight (22) were excluded. The patient characteristics are presented in Table 1.
Patient characteristics given as median values with 2.5–97.5 percentiles
BW was obtained in light clothing (underwear) using a medical balance (Soehnle professional, GMBH Company, Germany) and BH was obtained in the standing position without shoes using a dedicated wall-mounted ruler. The other body size measures were calculated as follows:
BMI (23)

LBM according to James (24):
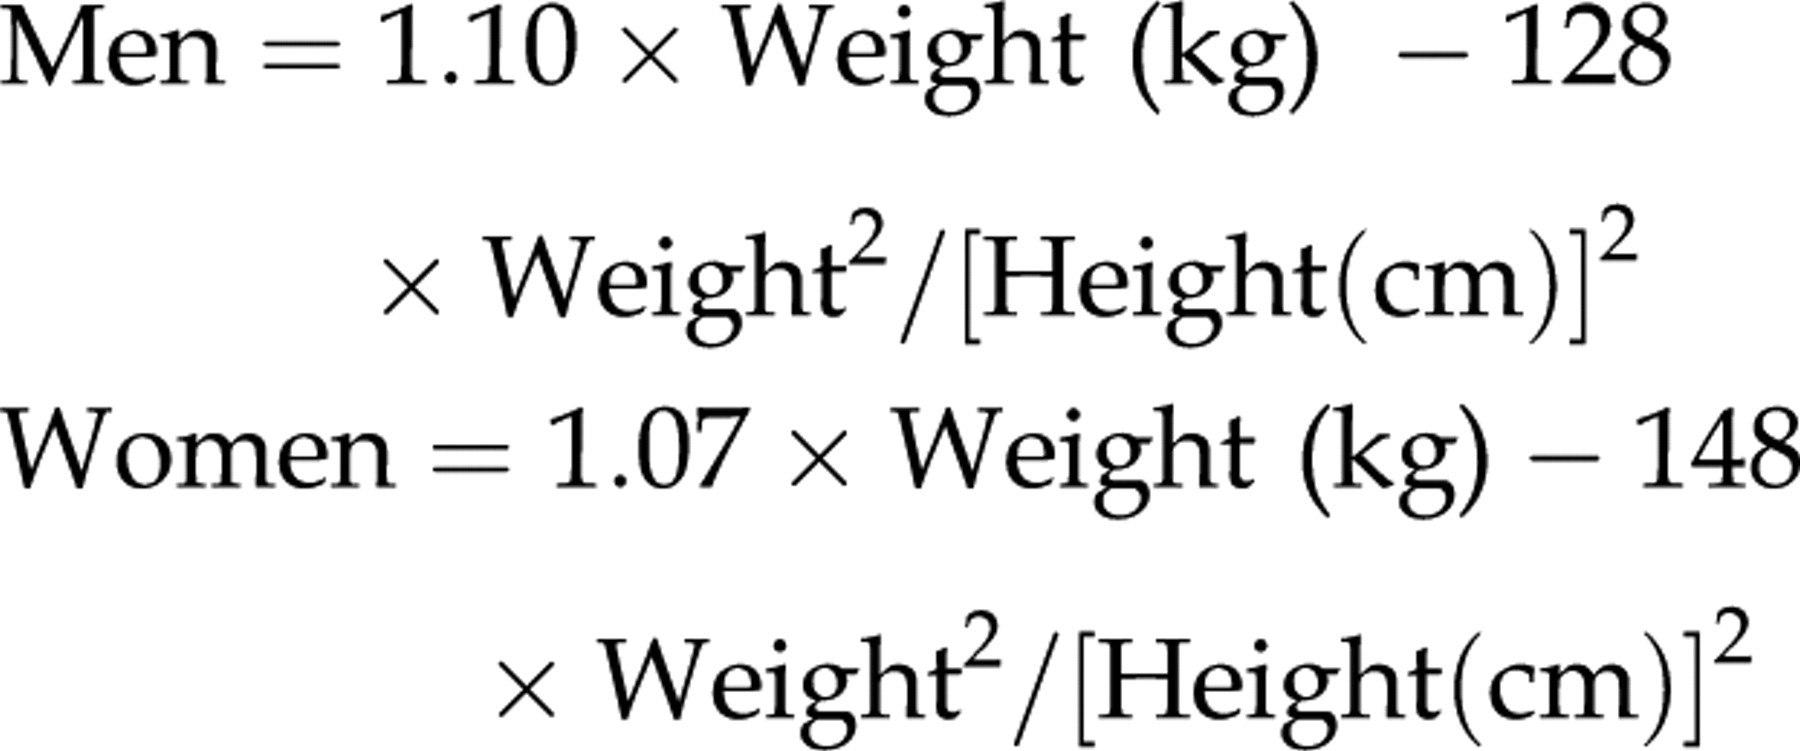
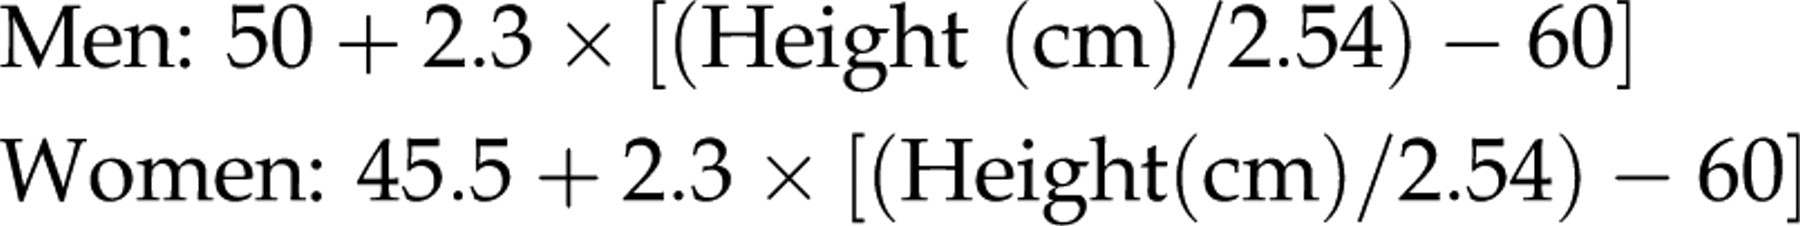
IBW according to Devine (19):
BSA (m
2
) according to Mosteller (25):

Computed tomography
Scanning was performed with a 64-multirow detector CT equipment (General Electric Light Speed VCT XT, GE Healthcare, Milwaukee, WI, USA) using 120 kVp and automatic dose modulation. The scanning was conducted with 64 × 0.625 mm detector collimation using a three-phase scanning protocol. The native phase was obtained with a noise index (NI) of 50 and a pitch of 1.375. During CM phases, NI was 36 and the pitch was set to 0.984. All images were reformatted to 5 mm thick slices with 2.5 mm reconstruction overlap. Images were obtained before and after CM injection during late arterial phase (= portal venous inflow phase) and in the hepatic parenchymal phase (= portal venous phase). A circular region of interest (ROI) was placed in the thoracic aorta at the level of the aortic arch with automatic scan start 20 s after the threshold level of 150 HU had been reached. The scan time for thorax was approximately 2 s. The parenchymal phase was started 25 s after the end of the late arterial phase.
Contrast medium administration
An 18-gauge venous access was applied to an antecubital vein. Two different contrast media were injected, iodixanol 320 mg I/mL (Visipaque ®-320, GE Healthcare, Chalfont St Giles, UK) or iomeprol 400 mg I/mL, (Iomeron®-400, Bracco Imaging SpA, Milan, Italy), by a power injector (Medrad, Stellant Dual Head Injector, Pittsburgh, PA, USA). A CM dose of 40 g of iodine was used for all patients. A total of 125 mL of iodixanol was injected at a rate of 5 mL/s and 100 mL of iomeprol at a rate of 4 mL/s resulting in an injected dose rate of 1.6 g iodine per s for both CM. The CM injection was followed by a 50 mL saline flush injected at the same rate as the CM.
Attenuation measurements
All images were evaluated on a dedicated workstation (Advantage Work Station, GE Healthcare, Milwaukee, WI, USA). Circular ROIs with a diameter of about 10 mm were used for all measurements. The attenuation of aorta was obtained at the level of the liver hilum in the native and the late arterial phase. The attenuation of liver was obtained in the native and the hepatic parenchymal phase from ROIs placed: (a) in the central part of the liver; (b) in the liver 3 cm caudal to the hemidiaphragm, and (c) in the liver 3 cm cranial to the caudal edge of the liver. Care was taken to avoid any partial volume effects and not to include any visible vessels and areas with inhomogeneous attenuation in the liver. The CM enhancement was calculated as the attenuation after CM injection subtracted with the attenuation in native phase. The measured values obtained at the three levels in the liver were finally averaged.
Statistics
Pearson's correlation coefficient r was calculated overall and for men and women separately for the association between hepatic and aortic enhancement, respectively, and the parameters BW, BH, BMI, LBM, IBW, and BSA. We assessed differences for the overall data-set in these correlations for BW vs. any measures of body size with a higher correlation coefficient than BW by comparing squared unstandardized regression residuals from univariate linear regression analyses using the Wilcoxon signed-rank test. The Fisher r- to –z transformation was used to test differences in correlation between men and women. Mann-Whitney U-test and t-test for two independent samples were used to test for median and mean differences in aortic and hepatic enhancement of the two different CM, iodixanol and iomeprol. Linear regression was employed to adjust the differences in the enhancement of men and women and of the two different CM for differences in age, weight, and height. All statistical analyses were conducted in SPSS release 18.0.1 (SPSS Inc, Chicago, IL, USA). P < 0.05 were considered significant.
Results
When using the same CM dose to all patients, the 95% percentile range in CM enhancement varied between 37 and 91 HU in the liver and between 93 and 404 HU in the aorta (Table 2). In 11 patients the enhancement of liver during the parenchymal phase was less than 50 HU. The CM enhancement was statistically significantly related to all studied body size parameters (Table 3). When evaluating the influence of the obtained measures of body size on hepatic parenchymal CM enhancement, three measures had a stronger influence than the other, i.e. BW (r = −0.64), LBM (r = −0.59), and BSA (r = −0.65), while BH, BMI, and IBW had weaker correlations (Table 3 and Fig. 1). The correlation for BSA was not significantly stronger than that for BW (P = 0.25). The negative correlations ranging from 0.59 to 0.65 results in an r 2 of 0.35–0.42, i.e. 35–42% of the variability in liver enhancement is explained by differences in body size. In aorta, BSA and LBM had the strongest correlation to CM enhancement (r = −0.54) but the difference to that of BW (r = −0.51) was small and insignificant (P = 0.07 and P = 0.31, respectively; Table 4). Thus, for aortic enhancement body size explains about 25–30% of the variability.
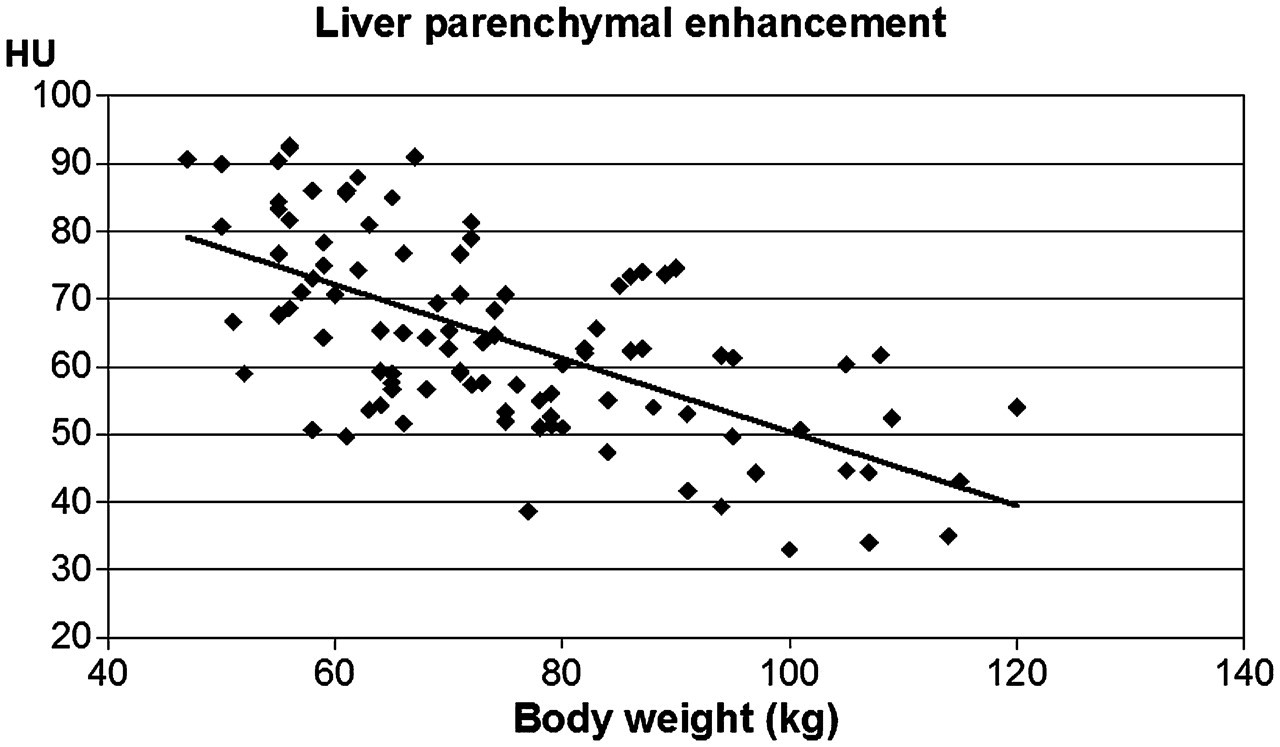
Liver parenchymal contrast medium enhancement in Hounsfield Units (HU) as a function of body weight
Attenuation and contrast medium enhancement of the liver and aorta expressed in Hounsfield Units (HU). Median values with 2.5–97.5 percentiles
Pearson's correlation coefficient regarding hepatic enhancement in the parenchymal phase in relation to various body size measures
All correlation coefficients were statistically significant at the P < 0.0001 level
Pearson's correlation coefficient regarding aortic enhancement in late arterial phase in relation to various body size measures
All correlation coefficients were statistically significant at the P < 0.0001 level
The correlation between the different measures of body size and the CM enhancement of liver and aorta was similar in men and women, with the exception of BH and IBW (Tables 3 and 4). In women, these two measures had weaker correlation to the CM enhancement though they did not differ significantly from that of men (liver: P = 0.16–0.18; aorta P = 0.14 for both measures).
CM enhancement of liver and aorta was stronger in women than in men (Table 2). However, when adjusted for weight, height, age, and type of CM the mean difference in liver enhancement between the sexes disappeared (P > 0.30) and the difference in mean aortic enhancement was no longer significant, decreasing from 63 to 32 HU (P = 0.11).
Enhancement of liver and aorta caused by the different CM is shown in Table 5. Iodixanol and iomeprol had a similar mean liver CM enhancement (65 HU vs. 63 HU, P = 0.22). However, when adjusted for weight, height, age, and sex, iodixanol caused significantly higher liver enhancement than iomeprol (mean difference 6 HU, P < 0.01).
Hepatic and aortic enhancement (Hounsfield Units [HU]) of iodixanol (320 mg I/mL) and iomeprol (400 mg I/mL), both injected at a dose of 40 g of iodine and a dose rate of 1.6 g iodine per s. Median values with 2.5–97.5 percentiles. The values shown have not been corrected for differences in sex and body parameters
There was no statistically significant difference in aortic enhancement between iodixanol and iomeprol (mean difference 233 HU vs. 229 HU, P > 0.30). The result was still statistically insignificant when comparing mean values with adjustment for weight, height, age, and sex (mean difference 13 HU, P > 0.30).
Discussion
When using the same CM dose to all patients there was a wide variation in CM enhancement of liver and aorta. In some patients such a variation in CM enhancement may have a great potential clinical impact. Despite receiving 40 g of iodine, 11% of patients did not reach the minimum liver enhancement of 50 HU, while other patients had unnecessarily high liver enhancement, up to 91 HU. In aorta the variation was even greater in absolute values, between 93 and 404 HU (95% percentile range, Table 2). This wide variation indicates that when a fixed CM dose is used for all patients some patients do receive a too small CM dose to obtain an optimally diagnostic examination. In the other end, some patients receive unnecessarily high doses with potential nephrotoxic effects.
The variation in CM enhancement was related to all studied body size parameters. Regarding hepatic parenchymal enhancement none of the studied body size parameters had a significantly better correlation than BW. BSA had a correlation similar to BW, while the correlation of LBM was slightly lower. Theoretically, if the CM dose had been optimally adjusted for BW approximately 40% of the variation in liver CM enhancement could have been avoided. Nor did Ho et al. (17) find any difference in patient-to-patient variability in hepatic parenchymal enhancement when dosing CM according to BW and estimated LBM using the same formula as we did. However, when LBM was based on percent body fat measured with a body fat monitor both by Ho et al. (17) and Kondo et al. (26) noted a decreased interpatient variability compared with when BW was used to dose CM. This may illustrate the shortcoming of the present formula to estimate LBM. However, using a body fat monitor to calculate LBM may seem impractical in daily clinical routine. Other formulas that may improve estimation of LBM should be tested.
With regard to the aortic enhancement in the late arterial phase both LBM and BSA resulted in a slightly better correlation than BW, though it did not reach statistical significance. Yanaga et al. (18) tailored CM dose to estimate LBM, using the same formula as we did, when performing CT angiography of the aorta. They found a more consistent aortic enhancement with reduced interpatient variability than the protocol based on BW, though they scanned in the early arterial phase.
There was a difference in CM enhancement between men and women, where a stronger enhancement in aorta and liver was observed in women. After adjustments for differences in BW, BH, and age between the two groups the differences in hepatic enhancement was reduced to zero while women still had a greater aortic enhancement than men, but the difference was no longer statistically significant.
Iodixanol caused somewhat higher CM enhancement than iomeprol in the liver and aorta. After adjustment for weight, height, age, and sex, the difference reached statistical significance in the liver but not in the aorta. This might be caused by differences in CM osmolality between the plasma isotonic iodixanol and the hypertonic iomeprol. The plasma hypertonic iomeprol may cause a shift in water from the intra- to the extracellular space, i.e. the plasma and the interstitial space of the liver. This would lead to a dilution of the CM resulting in the observed lower CM enhancement. An observed greater diffusion of fluid caused by hypertonic CM from the capillary bed into the extracellular space by iomeprol might be of importance when evaluating patients with edema. Similar differences in CM enhancement have been observed previously at renal CT by Rasmussen et al., where a 10% lower dose of the dimer iodixanol resulted in no significant difference in CM enhancement of aorta, vena cava, and kidney compared to that of the monomer iopromide (27).
In conclusion, none of the tested body size measures BH, BMI, LBM, IBW, or BSA demonstrated any significantly better correlation in hepatic parenchymal or aortic late arterial phase CM enhancement than BW did. Thus, BW may still be the preferred measure when dosing CM in relation to body size during liver scanning since it is simple to use and does not require any special calculations based on both weight and height.