
Abstract
Prolonged warm ischemia (WI) occurring in marginal kidney donors together with reperfusion injury determines allograft survival, in which apoptosis and inflammation play crucial roles. There is no single valid biomarker, so far, to assess the degree of kidney donor injury. To define new biomarkers for detecting initial donor ischemic injury, caspase-3, caspase-7, apoptosis, inflammation, HSP70 and renal histological changes were examined in porcine kidneys subjected to 7- 15- 25- or 40-min WI, two-hour cold storage and six-hour hemoreperfusion. Caspase-3 activity was gradually increased by prolonged reperfusion, with a decrease trend against WI time. This result was verified by raised 17 kDa active caspase-3 in postreperfusion kidneys, with elevated 12 kDa active caspase-3 and lowered precursor at seven-minute WI. Active caspase-7 was also doubled by reperfusion with decreased precursor at seven-minute WI, but declined against prolonged WI. Apoptotic cells in tubular and interstitial areas were greatly increased by reperfusion at seven-minute WI, but decreased against prolonged WI. In addition, myeloperoxidase (MPO)+ cells were dramatically increased by reperfusion and presented as a bell-shape against WI time, while HSP70 was significantly increased at 7-min WI, but decreased at 40-min WI after reperfusion. In postreperfusion kidneys, tubular dilation and cell shedding were observed at 7- and 15-min WI, while tubular vacuolation and cell debris were found in tubular lumens at longer WI times. At 40-min WI, early nuclear pyknosis, tubular epithelia detachment and peri-tubular capillary dilation were detected. Furthermore, caspase-3, caspase-7, apoptosis, but not MPO+ cells or HSP70, were correlated with renal function. In conclusion, caspase-3, caspase-7 and apoptosis appear to be better biomarkers than MPO+ cells or HSP70 for assessing warm ischemic injury in donor kidneys. Hemoreperfusion activates caspase-3 and caspase-7, promotes apoptosis of damaged cells in kidneys only with limited WI, which might be beneficial to renal structural re-modeling and functional recovery.
Introduction
Kidney donation after circulatory death (DCD) is becoming a widely accepted source of transplantation, because of the shortfall in the donor pool.1,2 However, prolonged warm ischemia (WI) is inevitable in these marginal kidneys, which results in the high rate of delayed graft function and primary non-function. The injury resulting from prolonged WI, cold storage (CS) and reperfusion affects allograft survival. 3 So far, limited biomarkers such as glutathione S-transferase4,5 or oxidative markers,6,7 have been considered to assess the degree of donor injury before transplantation, but no single one has been proved to fit well with this aim. More recently, modern screening ‘omics’ technologies have opened opportunities to develop novel bio-markers, but extended bioinformatics approaches generate complex data without effective conversion to clinically useful information. In addition, the validation of biomarkers could be difficult, because this process requires analyzing correlations between derived biomarkers and routine clinical parameters such as functional and morphological outcomes, which could subsequently occur, but at a time point far behind the change of biomarkers. 8
To date, the mechanisms of ischemia reperfusion injury (IRI), including the role of apoptosis and inflammation, are not well defined. The damage caused by WI may be associated with apoptosis and/or necrosis depending upon the severity and duration of injury.9,10 Apoptotic cells were found in distal tubules following short ischemia and reperfusion in a rat model. 11 However, when injuries become more severe, necrosis could be a dominant mode of cell death. 12 In addition, apoptosis can have conflicting effects on allografts, either improving survival through inflammation resolution and renal remodeling, or leading to tubular atrophy and fibrosis via deleting parenchymal cells. 13 The regression of excessive hyperplasic epithelia by apoptosis during repair processes after tubular necrosis is essential for the recovery of original tubular structure. 14 Caspase-3 and caspase-7 (cysteine protease), effector enzymes, play a central role not only in cell death pathways, 15 but also in inflammatory pathways in long-term renal IRI.16,17 Inhibiting caspase-3 by enzyme inhibitors,18,19 atorvastatin 20 or small interfering RNA21,22 prevented renal apoptosis, inflammation and tissue injury in acute renal IRI models. In addition, myeloperoxidase (MPO) is an enzyme abundantly expressed in neutrophils, which is released into the extracellular fluid in the process of inflammation and causes tissue destruction through necrosis and apoptosis.23,24 Moreover, HSP70 functions as a molecular chaperone and reduces stress-induced denaturation and aggregation of intracellular proteins, 25 and is thought to be a tolerance mediator of IRI. 26 HSP70 also exerts antiapoptotic effects by interfering with the stress-induced or immune response-mediated apoptotic program. 27
There is an imperative need to develop efficient pretransplant assessments for kidney donor injury. 28 Normothermic perfusion using autologous blood restores metabolism 29 and eliminates some effects of cold ischemia.30,31 Normothermic perfusion is not only a better approach for kidney preservation, but also a method for assessing renal function, 32 which could be potentially applied in clinical practice.30,31 It has been recognized that porcine kidneys have similar size, and comparable anatomical and physiological characteristics to adult human kidneys. 33 Moreover, porcine kidneys remain viable much longer than rodent kidneys in isolated perfusion experiments.34,35 Therefore, in this study using an isolated organ preservation system (IOPS), the potential biomarkers, caspase-3, caspase-7, apoptosis, inflammation and HSP70, as well as and tubulointerstitial damage (TID) were mainly investigated in pre and post six-hour hemoreperfusion porcine kidneys subjected to initial 7- 15- 25- or 40-min WI injury and two-hour CS.
Materials and methods
Recovery of organs
Experimental kidneys (n = 6) subjected to 7- 15- 25- or 40-min WI were recovered from schedule 1 sacrificed white pigs weighing 60–70 kg. They were flushed with 300 mL hyperosmolar citrate at 4°C (Soltran; Baxter healthcare, Norfolk, UK), infused at a hydrostatic pressure of 100 cm H2O and followed by two-hour static CS. Approximately 1 L blood was collected from each animal into a sterile receptacle containing 25,000 units heparin (Multiparin; CP Pharmaceuticals, Wrexham, UK).
Reperfusion
The IOPS was designed using clinical-grade cardiopulmonary bypass technology (Medtronic, Watford, UK) and incorporated an oxygenator (Medtronic), heat exchanger (Grant, GD120, Cambridge, UK) and centrifugal pump. This IOPS allows kidneys to auto-regulate renal blood flow (RBF) according to intrarenal vascular resistance at 55 mmHg per-fusion pressure. After cannulation of the renal artery, vein and ureter, kidneys were flushed with Gelofusine at 4°C (B. Braun, Sheffield, UK) and reperfused with 500 mL of circuit priming solution and followed by 500 mL of heparinized autologous blood, supplemented with nutrients and antibiotics, and oxygenated with 95% oxygen/5% carbon dioxide, for six hours at 38°C. 36 Urine output was replaced with Ringer's lactate solution. Creatinine (Sigma, Dorset, UK) was added to the perfusate to achieve an initial circulating concentration of 1000 μmol/L. At all WI time (WIT) points, needle core biopsies were taken pre, 30-min, three-hour and six-hour postreperfusion, fixed in 4% (w/v) neutral buffered formalin or stored at -80°C for histological and molecular analyses.
Measurement of caspase-3 activity
Caspase-3 activity was detected by a modified Fluorometric CaspACETM Assay System (Promega, Southampton, UK) using 100 μg protein of renal tissue. 37 This assay is based on the ability of caspase-3 to cleave a fluorogenic substrate of Ac-DEVD-7-Amino-4-Methyl Coumarin (AMC) and its inhibitor Ac-DEVD-CHO to block non-specific signals. The fluorescence intensity of reactions was monitored at 360 nm excitation and 460 nm emission using M×4000TM Multiplex QPCR System and calibrated against AMC standards.
Measurement of caspase-3, caspase-7 and HSP70 proteins
Twenty micrograms proteins of kidney cortex homogenate were separated on 15% (wt/vol) polyacrylamide denaturing gels and electro-blotted onto Hybond-C membranes (Amersham Life Science, Buckinghamshire, UK). 17 These membranes were blocked with 5% (wt/vol) milk and probed with anti full-length caspase-3 (1:1000 dilution, Santa Cruz Biochemicals, Santa Cruz, CA, USA), anti-full-length caspase-7 (1:250 dilution, Cell Signaling Technology, Herts, UK) or HSP70 (1:1000 dilution, Bioquote Limited, York, UK) antibody; and re-probed with anti β-actin antibody (1:5000 dilution, Abcam, Cambridge, UK). The antibody binding was revealed using peroxidase conjugate from a DAKO ChemMate EnVisionTM Detection Kit (DAKO, Glostrup, Denmark) diluted at 1:10, and the enchanced chemiluminescent detection system (Amersham Life Science). Developed films were semiquantitatively analyzed by scanning optical volume density using a Bio-Rad GS-690 densitometer (Bio-Rad Laboratories Ltd, Hertfordshire, UK). Results were expressed as optical volume density (OD × mm2) of caspase-3, caspase-7 and HSP70 corrected by β-actin for loading.
In situ end-labeling (ISEL) apoptotic cells
Four-micrometer paraffin sections were used to label fragmented DNAs in situ with digoxigenin-deoxyuridine (dUTP) by terminal deoxynucleotidyl transferase (TdT) using an ApopTagTM peroxidase kit (Appligene Oncor, Illkirch, France). 37 Briefly, sections were digested by 40 μg/mL proteinase K for 15 min at 37°C, incubated with TdT and digoxigenin-dUTP at 37°C for 60 min and transferred to ‘stop’ buffer for 30 min. After adding antidigoxigenin-peroxidase complex for 30 min, these sections were developed by 3’-amino-9-ethylcarbazole (AEC, dark red color) substrate. Apoptotic cells were examined at × 400 magnification over 20 fields of tubular and interstitial areas separately.
Immunostaining of MPO
Immunohistochemical staining of MPO, a marker mainly for neutrophil granulocytes, was undertaken on paraffin sections using a DAKO ChemMate EnVisionTM Detection Kit (DAKO). The sections were digested by 40 μg/mL proteinase K for 15 min at 37°C and blocked by peroxidase-blocking reagent. The sections were labeled by an antiMPO antibody (1:600 dilution, DAKO) at 4°C overnight. The antibody binding was revealed by AEC. MPO+ cells in the tubulointerstitial areas of the kidney were semiquantitatively scored in 20 fields at ×400 magnification.
Acute tubular damage
Morphological features of acute tubular damage were examined on paraffin embedded, hematoxylin and eosin (H&E) stained sections at ×200 magnification by two examiners including an experienced renal pathologist who was blinded to experimental groups. A examining system relevant to the level and pattern of damage seen in these kidneys was devised for the purpose as the following: score 0: no abnormality detected; Score 1: mild tubular dilation with occasional free cells and cell debris in lumens of a few tubules; Score 2: moderate tubular dilation and cytoplasmic vacuolation with cell shedding and debris in lumens; Score 3: extensive tubular dilation with more severe condensed nuclei and detachment resulting in ‘bare’ basement membranes as well as interstitial expansion.
Statistical analysis
Results are expressed as mean ± standard error of the mean (SEM). Statistical differences were assessed using a single factor variance (ANOVA) for data collected at multiple time-points and the Student's t-test for difference between two groups using GraphPad InStat version 3 (GraphPad Software Inc, San Diego, CA, USA). Correlation between parameters was determined using linear correlation and multiple regression analyses using SPSS software (SPSS Inc, Chicago, IL, USA). P < 0.05 was considered to be significant.
Results
Renal function
Dynamic changes of renal function over six-hour reperfusion have been reported previously.6,7 Here, the renal function at pre and postreperfusion was re-addressed in order to show the correlation with the parameters detected in this study. Briefly, serum creatinine (SCr, μmol/L) significantly fell after six-hour reperfusion compared with one-hour reperfusion at 7 (237 ± 46 versus 568 ± 34), 15 (412 ± 74 versus 631 ± 52) and 25-min (455 ± 73 versus 683 ± 51) WIT, but not at 40-min WI (586 ± 87 versus 803 ± 66, Figure 1a). However, SCr gradually increased against prolonged WIT, and reached statistical significances between seven and 40-min WI in post one-hour reperfusion kidneys; between seven and 25- or 40-min WI, respectively in post six-hour reperfusion kidneys. RBF (mL/min/100g) sharply increased during the first hour (7 min: 47.2 ± 6.5; 15 min: 33.2 ± 5.6; 25 min: 31.5 ± 6.0 and 40 min: 25.6 ± 4.7) and remained almost constant during reperfusion up to six hours at all WIT (7 min: 50.0 ± 4.1; 15 min: 34.3 ± 7.5; 25 min: 29.0 ± 8.8 and 40 min: 25.7 ± 6.3, Figure 1b). Nevertheless, RBF was significantly decreased at 40-min WI compared with seven-minute WI after both one and six-hour reperfusion.
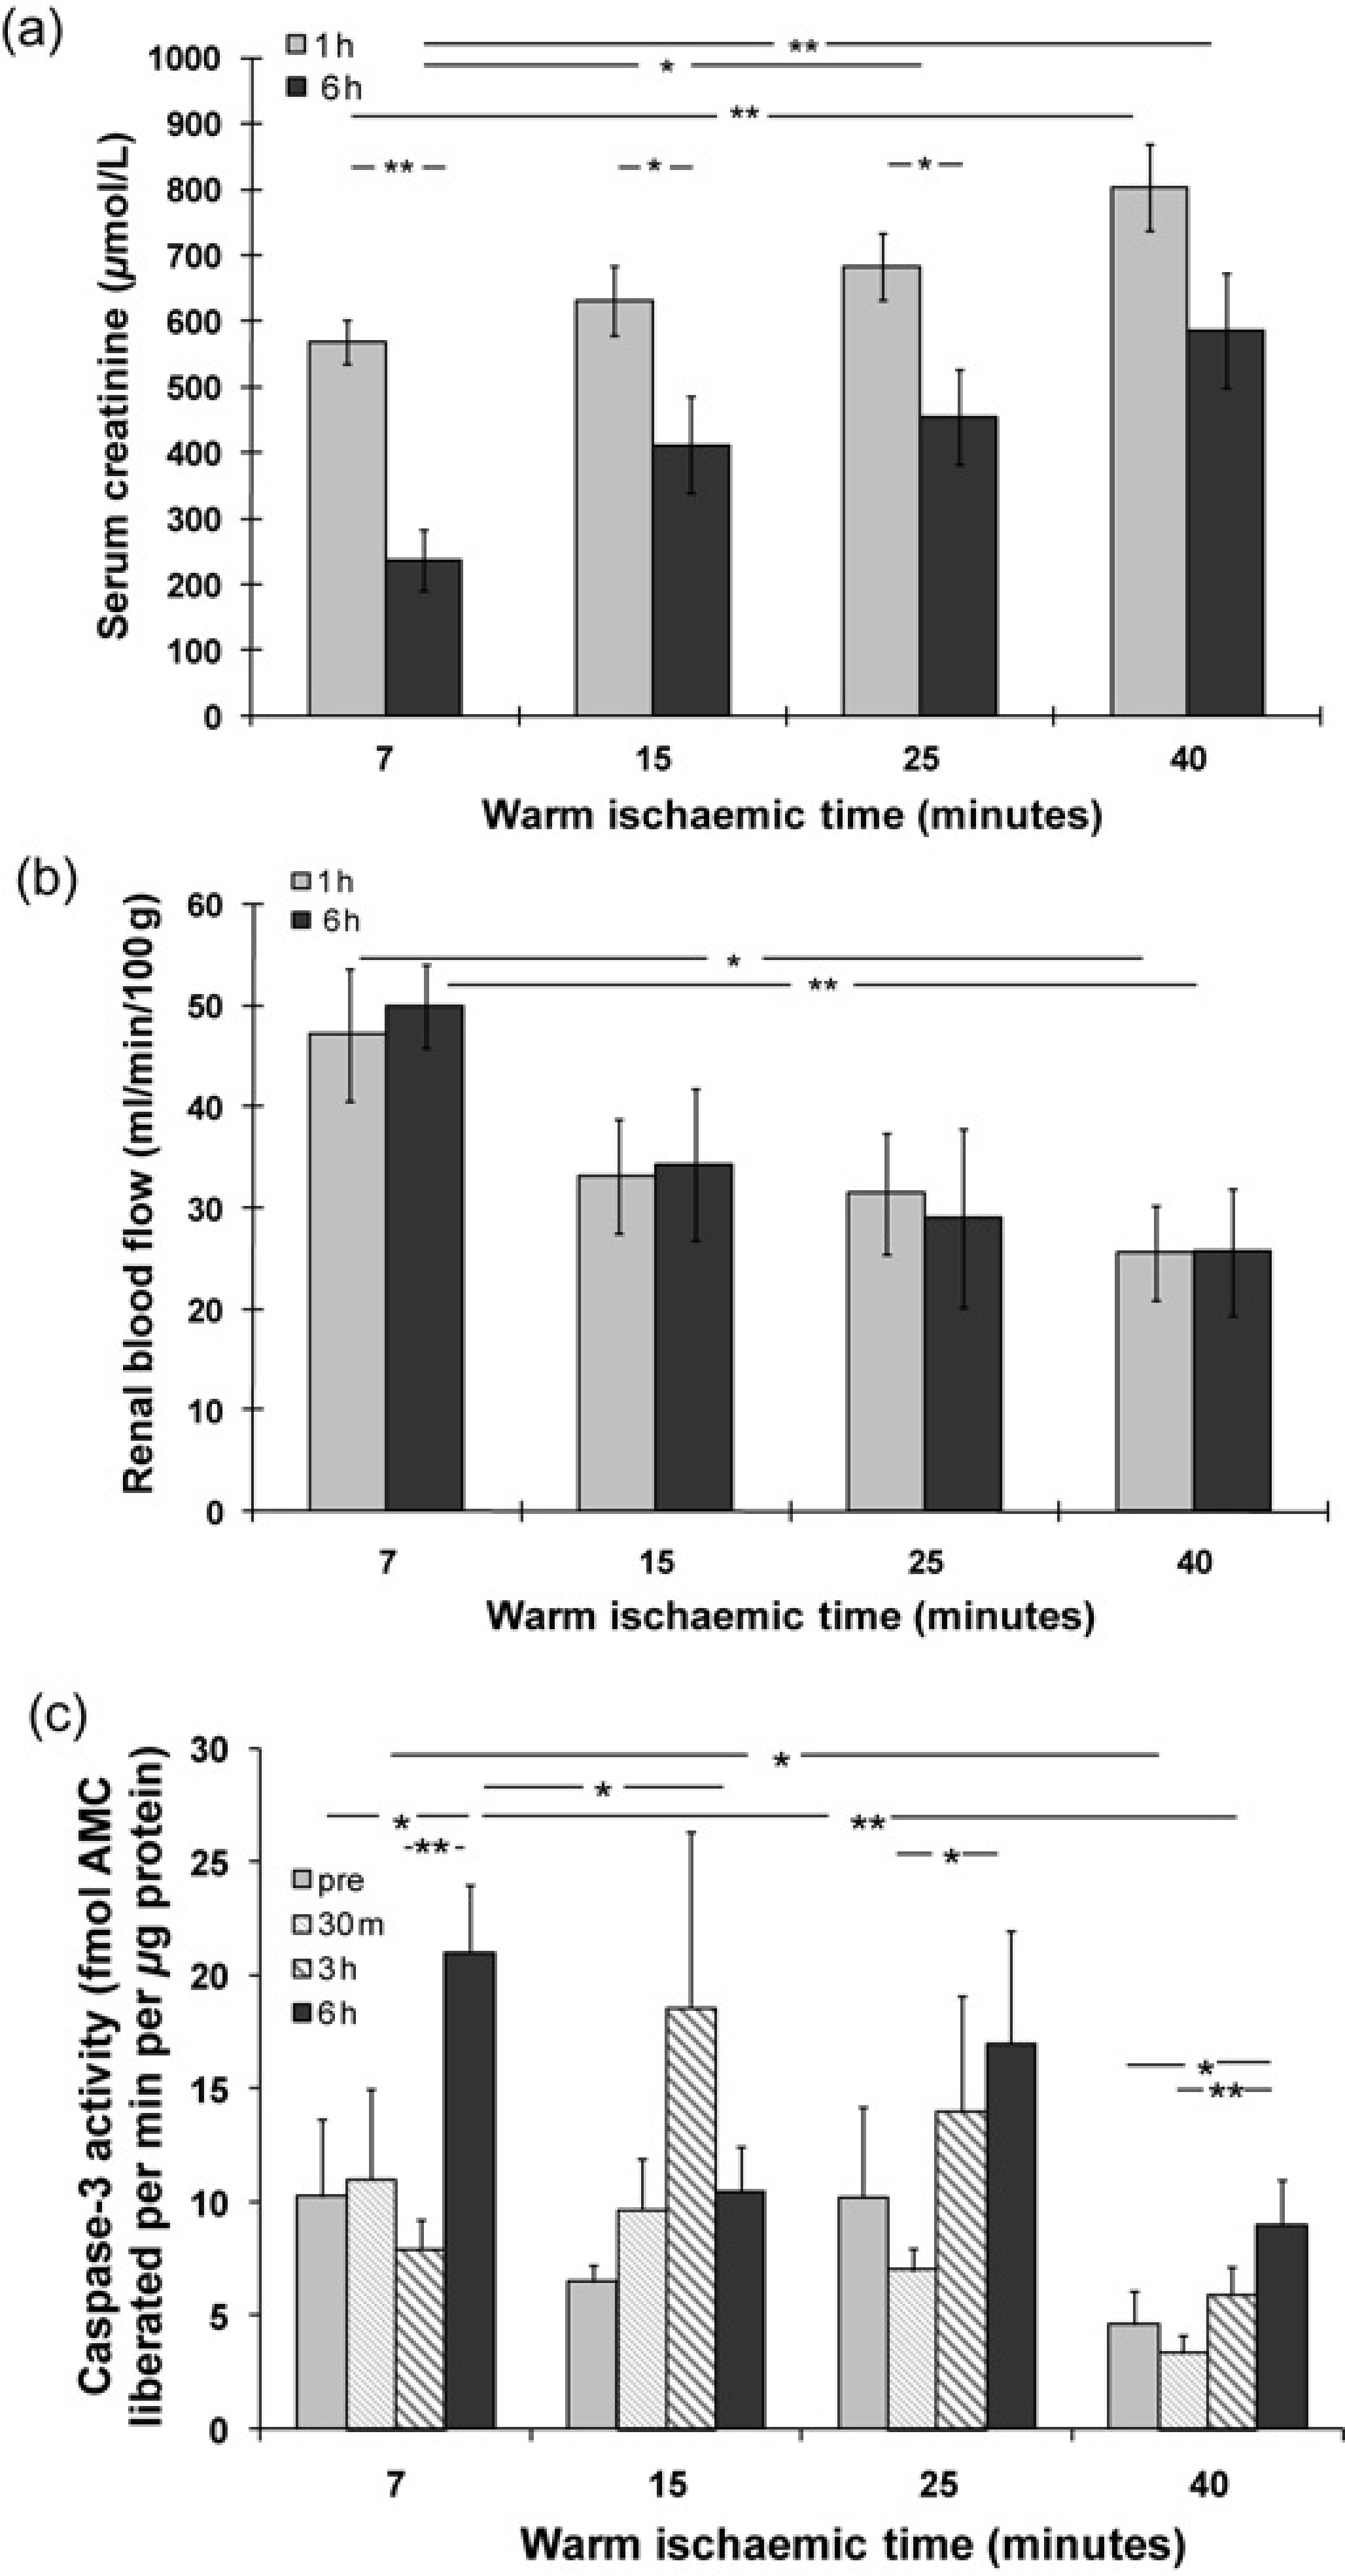
Changes of serum creatinine (a), renal blood flow (b) and caspase-3 activity (c) in different experiment groups. Serum creatinine and renal blood flow were shown after one and six-hour reperfusion at 7- 15- 25- and 40-min WI. In addition, caspase-3 activity was demonstrated in pre and 30-min, three- and six-hour postreperfusion kidneys at different WIT. Data were expressed as mean ± SEM. n = 6. *P < 0.05; **P < 0.01; pre, 30 m, 1 h, 3 h and 6 h: pre, 30-min, one-hour, three-hour and six-hour reperfusion
Caspase-3 activity in pre and different time points of postreperfusion kidneys
Caspase-3 activity (fmol AMC liberated/minute/μg protein) in the kidney was measured by enzyme cleavage assay. There was an increase trend of caspase-3 activity in pre, 30-min, three- to six-hour postreperfusion kidneys at most WIT points, although fluctuations were noted. The increase of caspase-3 activity reached statistical significance after six-hour reperfusion compared with prereperfusion at seven (21 ± 3 versus 10 ± 3) and 40-min WIT (9 ± 2 versus 5 ± 2); with 30-min reperfusion at 25 (17 ± 5 versus 7 ± 1) and 40-min WIT (9 ± 2 versus 3 ± 1); or with three-hour (21 ± 3 versus 8 ± 1) reperfusion at seven-minute WI (Figure 1c). However, the caspase-3 activity was decreased in the six-hour reperfusion kidneys at 15 (10 ± 2) and 40-min (9 ± 2) WIT compared with that at seven minutes (21 ± 3); or in the 30-min reperfusion kidneys at 40-min WIT compared with that at seven minutes (3 ± 1 versus 11 ± 4) as well.
Level of caspase-3 and caspase-7 protein in kidneys
To confirm the result of caspase-3 activity, the level of caspase-3 protein, as well as caspase-7 protein, was detected by Western blot in pre and six-hour reperfusion kidneys at all WIT. The 17 kDa and 12 kDa bands, representing active caspase-3, were almost invisible in prereperfusion kidneys (Figure 2a). After reperfusion, the 17 kDa caspase-3 (volume density, OD × mm2) was significantly increased (7 min: 4.56 ± 0.80 versus 1.45 ± 0.05; 15 min: 2.81 ± 0.36 versus 1.36 ± 0.03; 25 min: 2.39 ± 0.10 versus 1.88 ± 0.34; 40 min: 3.33 ± 0.26 versus 2.24 ± 0.10); and the 12 kDa caspase-3 was also revealed at seven-minute WI (Figures 2b-d). A 32 kDa caspase-3 precursor was demonstrated in both pre and postreperfusion kidneys, but only after reperfusion it was significantly higher at 40-min WI (4.51 ± 0.62) than seven-or 25-min WI (2.82 ± 0.28 or 3.02 ± 0.21). The same was true at 15-min WIT compared with seven-minute WIT (3.82 ± 0.34 versus 2.82 ± 0.28, Figures 2a and d).
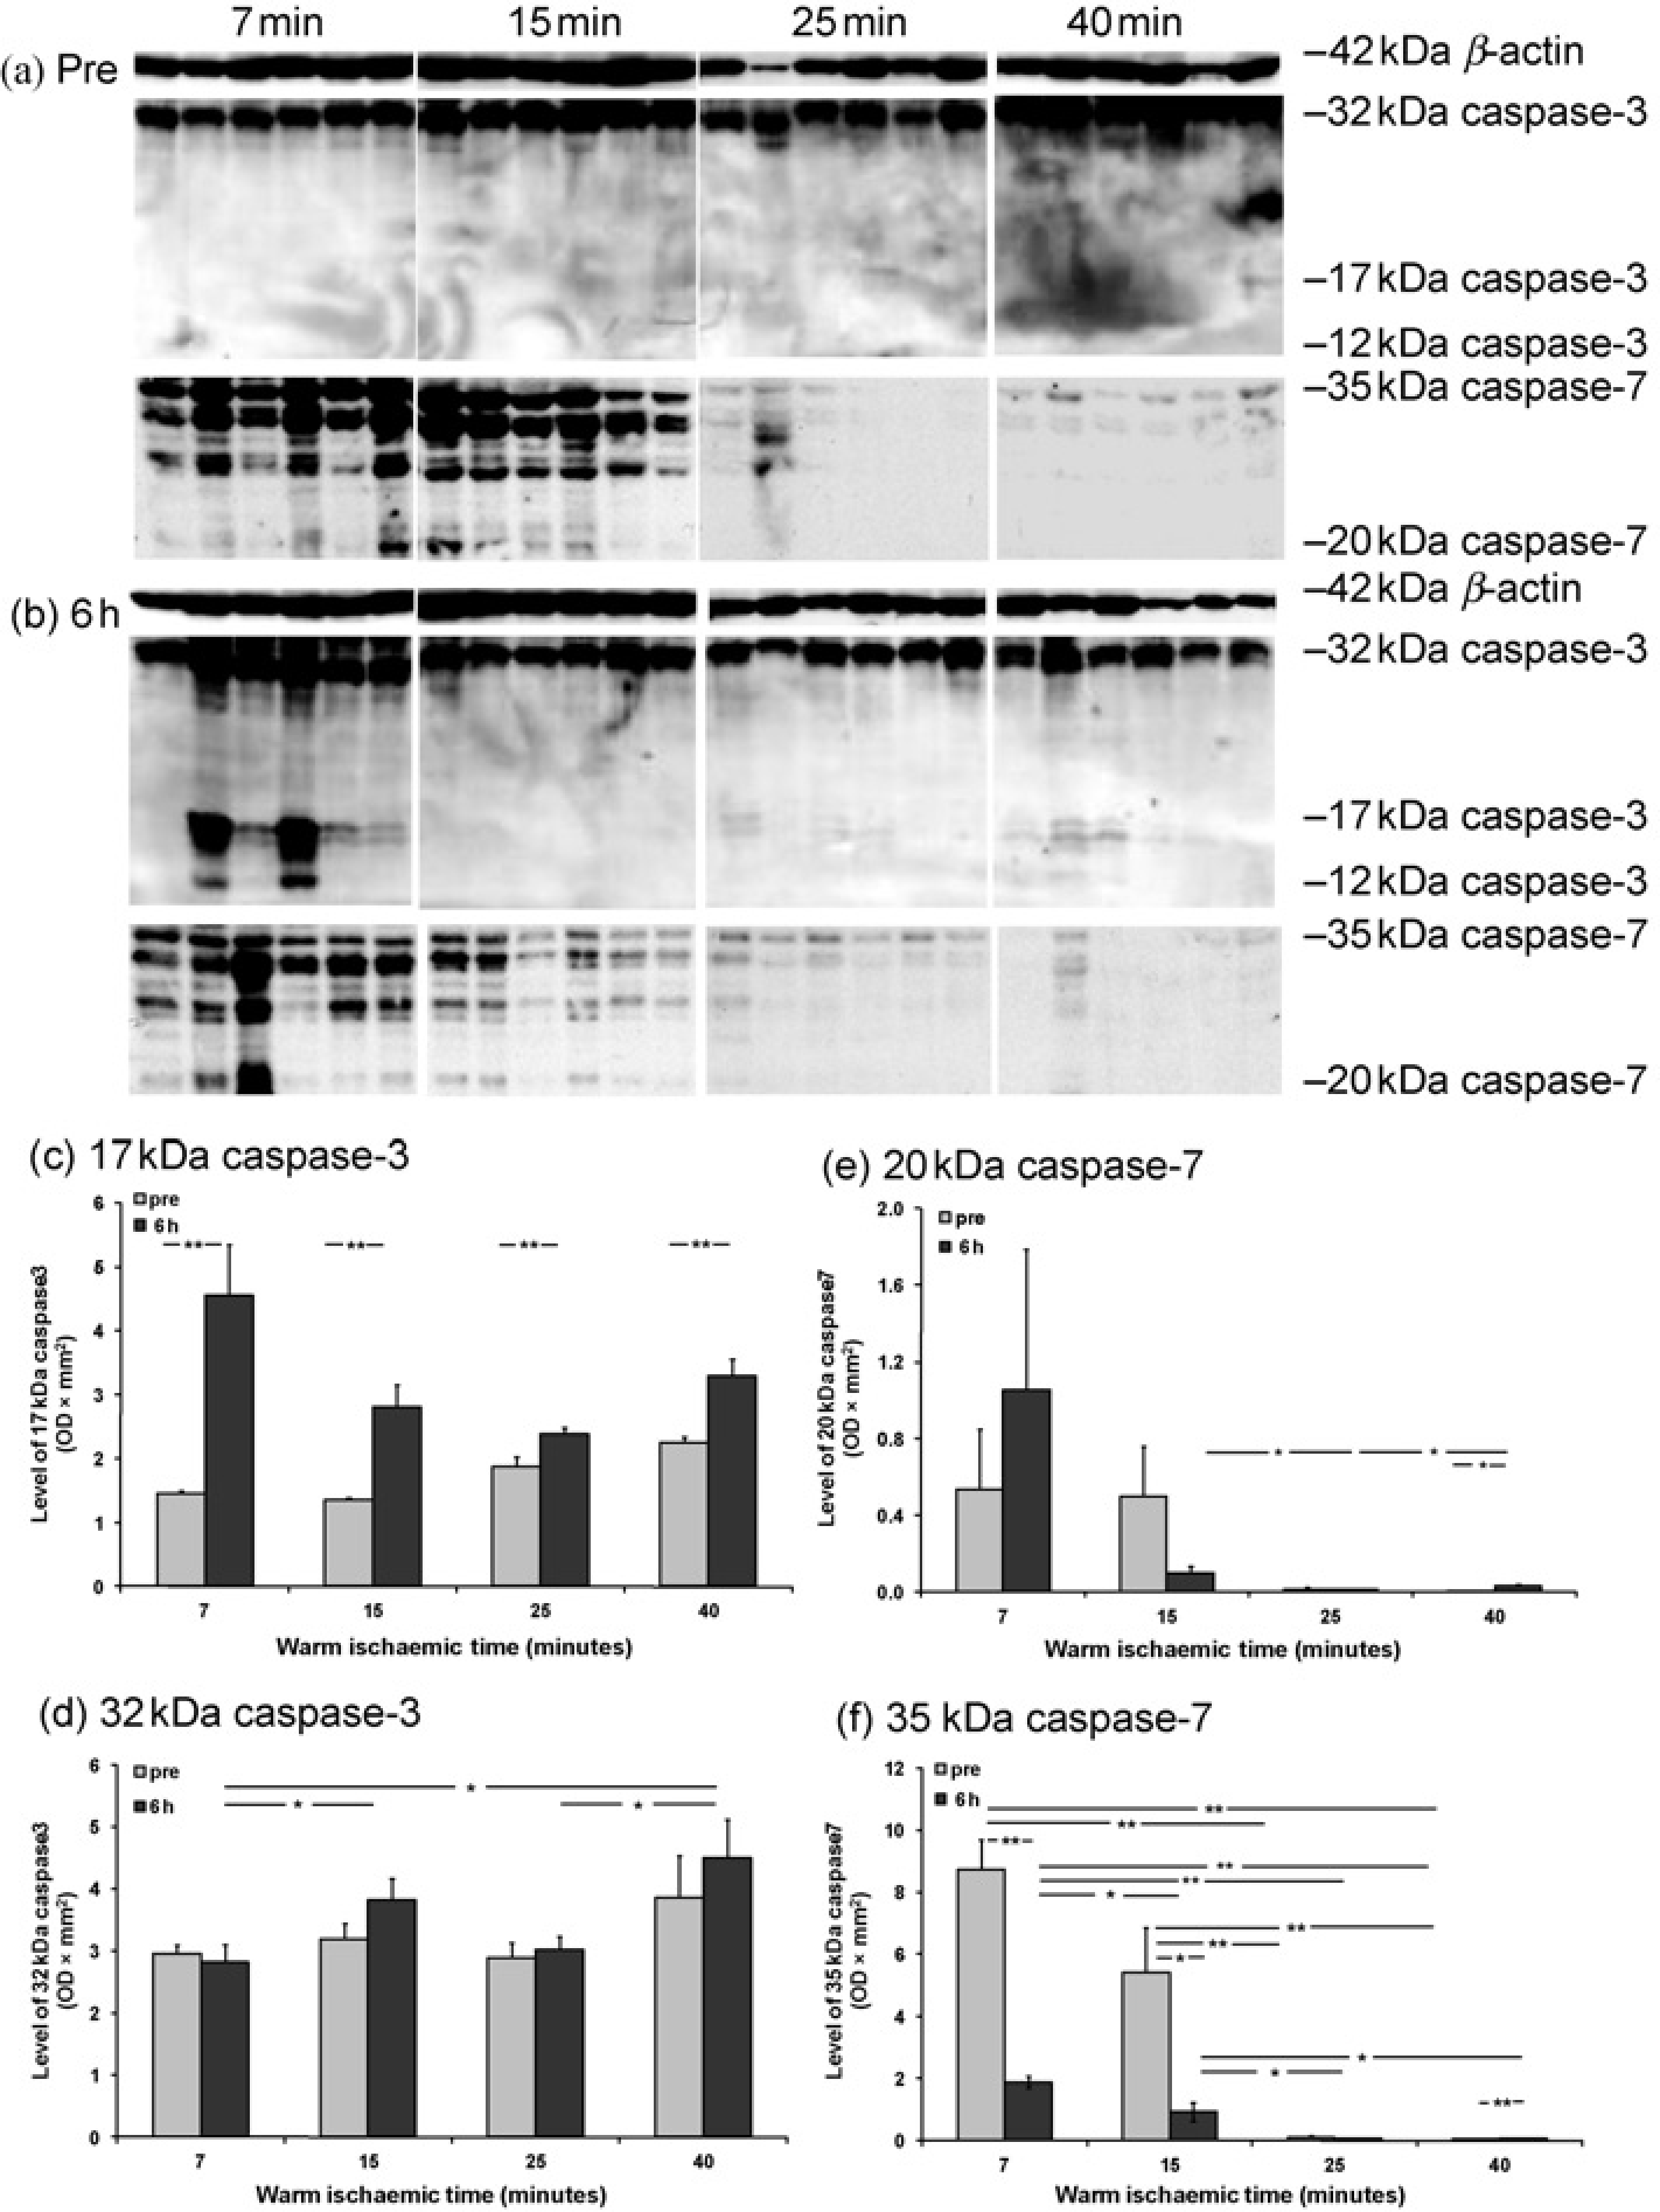
Level of caspase-3 and -7 proteins detected by Western blot in pre and postreperfusion kidneys. Immunoblots showed 32 kDa caspase-3 precursor, 17 and 12 kDa caspase-3 active subunits; 35 kDa caspase-7 precursor; and 20 kDa caspase-7 active subunit (a, b); as well as 42 kDa β-actin for the loading control of each sample. Histogram data represent the volume density of caspase-3 and caspase-7 corrected by 42 kDa β-actin as mean ± SEM. n = 6. Pre and six hours: pre and six-hour reperfusion kidneys, *P< 0.05; **P< 0.01
In addition, the band of 20 kDa active caspase-7 was only visible in the kidneys with limited WIT; whereas the band of 35 kDa caspase-7 precursor was presented in almost all WIT in both pre and six-hour reperfusion kidneys (Figures 2a and b). In prereperfusion kidneys, the 20 kDa caspase-7 was numerically higher at 7 (0.538 ± 0.312) and 15-min (0.499 ± 0.259) WIT than that at 25 (0.015 ± 0.011) and 40-min (0.004 ± 0.002) WIT (Figure 2e). Although 20 kDa caspase-3 at seven-minute WI was increased about two-fold by reperfusion (1.052 ± 0.736), this difference did not reach statistical significance; it was also only numerically higher than prolonged WIT points (15 min: 0.100 ± 0.035; 25 min: 0.012 ± 0.003; 40 min: 0.032 ± 0.010). However, the level of 35 kDa caspase-7 (Figure 2f) in both pre and six-hour reperfusion kidney was gradually decreased by prolonged WI. Compared with prereperfusion kidneys, the 35 kDa caspase-7 was also significantly reduced by reperfusion at 7 (8.739 ± 0.946 versus 1.884 ± 0.180) and 15-min WI (5.420 ± 1.442 versus 0.937 ± 0.306), but remained unchanged at 25 (0.094 ± 0.060 versus 0.117 ± 0.031) and 40-min (0.178 ± 0.006 versus 0.057 ± 0.006) WIT.
Apoptotic changes in tubular and interstitial areas
Apoptosis was examined by in situ end labeling fragmented DNAs in pre and six-hour reperfusion kidneys. Apoptotic cells were mainly located in tubular and interstitial areas including tubular lumens (Figures 3a, d, g and h). Very few apoptotic cells were seen in the glomerulus and glomerular capsules (Figures 3e and f). Semiquantitative analysis of apoptosis revealed that reperfusion raised apoptotic cells (per × 400 field) in both tubular and interstitial areas at all WIT compared with prereperfusion kidneys, but only reached a statistical significance in interstitial areas at seven-minute WI (1.58 ± 0.61 versus 0.17 ± 0.08). However, this increase in tubular areas did not reach any statistical significance, although the number of apoptotic cells was increased more than four times compared with that in prereperfusion kidneys at seven-minute WI (0.95 ± 0.34 versus 0.22 ± 0.09). Apoptotic cells were decreased in tubular and interstitial areas of postreperfused kidneys against prolonged WIT and reached a statistical difference between 25 (tubular areas: 0.13 ± 0.07; interstitial areas: 0.12 ± 0.06) or 40-min (tubular areas: 0.17 ± 0.10; interstitial areas: 0.05 ± 0.02) WI compared with seven-minute WI (tubular areas: 0.95 ± 0.34; interstitial areas: 1.58 ± 0.61, Figures 3i and j). Some necrotic cells were picked up by the ISEL (indicated by green arrows) as showed in Figure 3d, but without condensed nuclei and clear boundaries between individual cells.

Apoptosis detected by in situ end labeling of fragmented DNA in pre and six-hour reperfusion kidneys. Apoptotic cells (black arrows) are showed in tubular areas (a, d), interstitial areas (b, d), tubular lumen (c), glomerulus (e) and glomerular capsule (f). Some necrotic cells (green arrows) were also showed in tubules with positive In situ end-labeling staining, but no condensed nuclei and clear cellular boundary (d). Histogram data represent mean ± SEM. n = 6. Pre six six hours: pre and six-hour reperfusion kidneys, *P < 0.05. (A color version of this figure is available in the online journal)
Distribution of MPO+ cells in the kidney
The distribution of MPO+ cells in pre and postreperfusion kidneys was detected by immunohistochemistry. The majority of MPO+ cells were seen in interstitial areas (Figure 4a), some of them were peri vascular vessels (Figure 4b) and others penetrated through tubular epithelia wall and shed into tubular lumens (Figures 4c and d). There also were MPO+ cells demonstrated morphological features of apoptosis such as a halo around condensed nucleus (Figure 4e), while a few MPO + cells were scattered in glomerular areas (Figure 4f). Semiquantitative analysis revealed significantly more MPO+ cells located in the tubulointerstitial area of kidneys after reperfusion than that in prereperfusion kidneys at all WIT points (7 min: 1.82 ± 0.30 versus 0.08 ± 0.03; 15 min: 3.23 ± 0.73 versus 0.18 ± 0.08; 25 min: 2.68 ± 0.81 versus 0.75 ± 0.50; 40 min: 2.00 ± 0.69 versus 0.13 ± 0.07; Figure 4g). There was no significant difference between groups in pre or postreperfusion kidneys, although the peak of MPO+ cells was noticed at 15-min WI in postreperfusion kidneys or at 25-min WI in prereperfusion kidneys.

MPO+ cells detected by immunohistochemistry in pre and postreperfusion kidneys. The majority of MPO+ cells were seen in interstitial areas (a), some of them were peri vascular vessels (b), and others penetrated through tubular epithelia wall and shed into tubular lumens (c and d). There also were MPO+ cells demonstrated morphological features of apoptosis such as a halo around condensed nucleus (e). Only a few MPO+ cells were scattered in glomerular areas (f). Histogram data represent mean ± SEM. n = 6. Pre and six hours: pre and six-hour reperfusion kidneys, *P < 0.05; **P < 0.01. (A color version of this figure is available in the online journal)
Normothermic reperfusion increased HSP70 protein level
The level of HSP70 protein was detected by Western blot and a 70 kDa band was revealed in all pre and six-hour reperfusion kidneys (Figures 5a and b). Compared with prereperfusion kidneys, HSP70 protein (OD × mm2) was significantly increased by reperfusion at six-minute WIT (25.0 ±1.1 versus 20.4 ±1.9), but decreased at 40-min WIT (18.6 ± 2.8 versus 22.5 ± 2.2, Figure 5c). In postreperfusion kidneys, the level of HSP70 was significant lower at 40-min WIT compared with 7, 15 or 25 min WIT respectively (18.6 ± 2.8 versus 25.0 ± 1.1, 25.9 ± 2.3 or 26.6 ± 3.0), whereas in prereperfusion kidneys HSP70 was significantly increased at 15-min WIT compared with that in seven minutes (25.0 ± 0.5 versus 20.4 ±1.9).
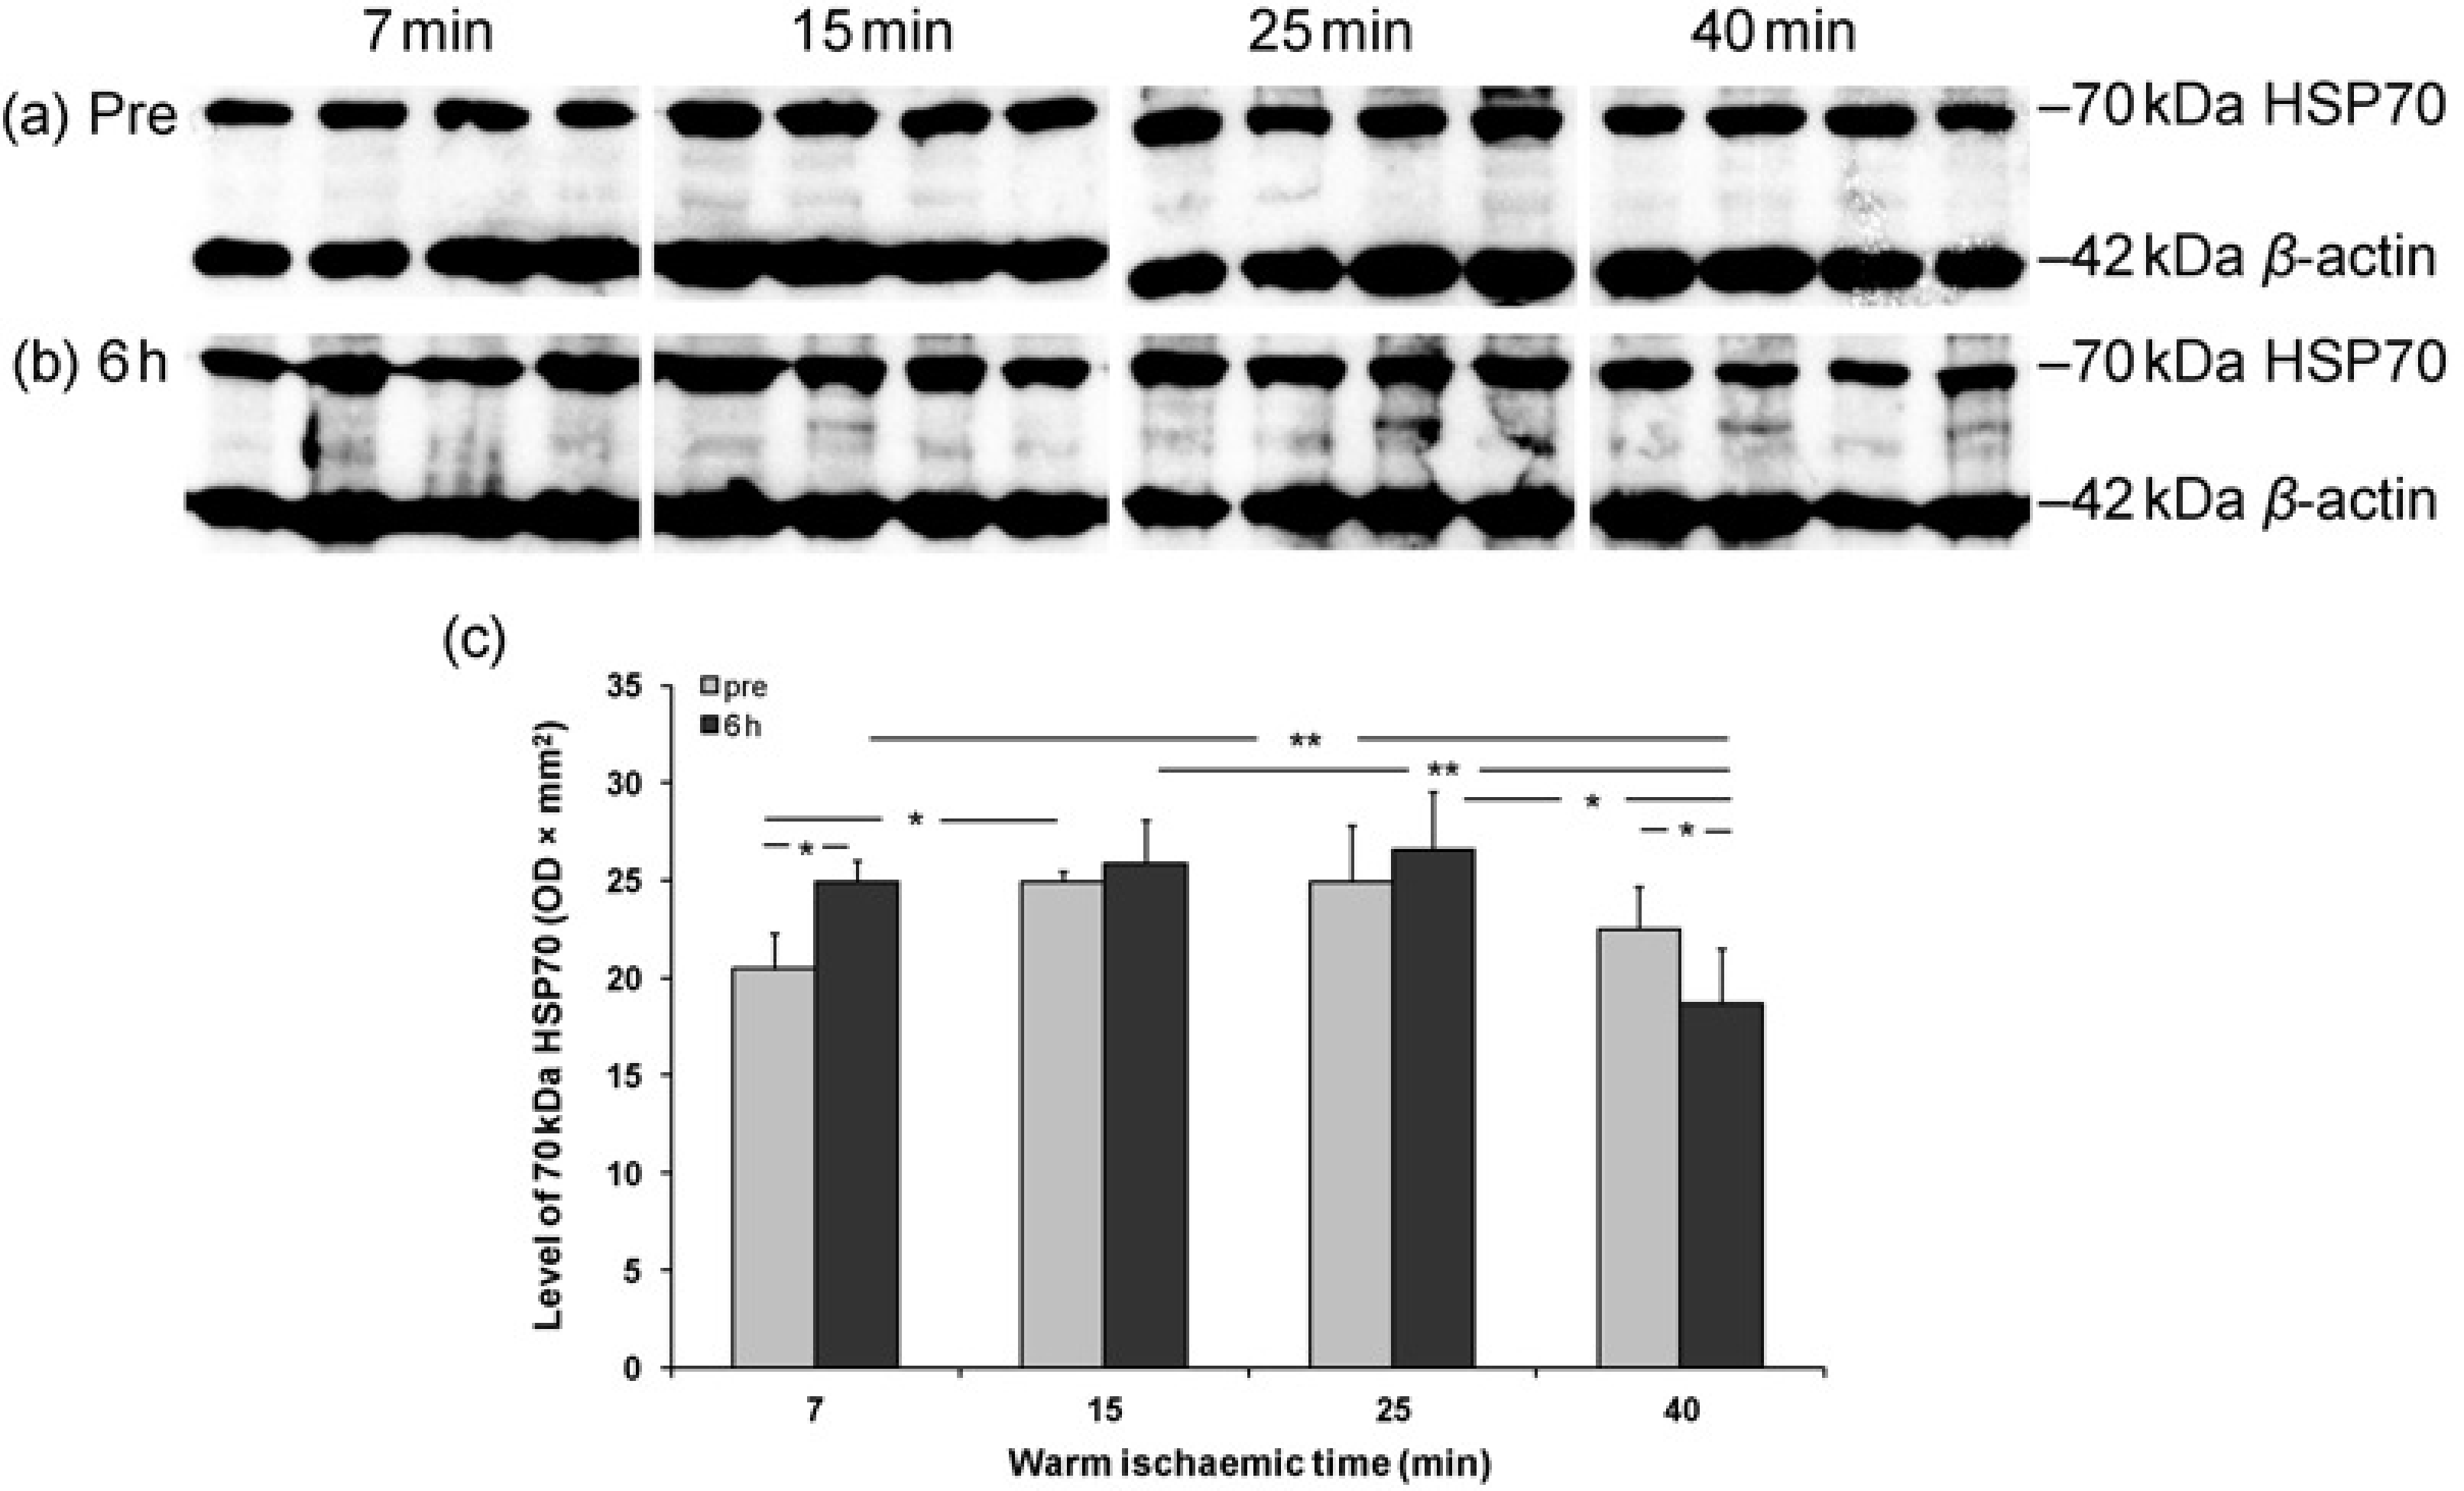
Level of HSP70 protein in pre and six-hour reperfusion detected by Western blot and analyzed using 42 kDa β-actin for loading correction. Histogram data represent mean ± SEM. n = 6. Pre and six hours: pre and six-hour reperfusion kidneys,
Acute tubular damage
Examination of H&E sections indicated that there was no established coagulative necrosis (cortical necrosis), whereas the morphological evidence of acute tubular injury, so-called acute tubular necrosis, was present. After six-hour reperfusion, TID was greater than prereperfusion kidneys at seven (2.8 ± 0.2 versus 1.8 ± 0.2) and 15-min WIT (2.2 ± 0.2 versus 1.0 ± 0.4), while in postreperfusion kidneys TID was also more severe at seven-minute WIT than 15- or 25-min WI (2.8 ± 0.2 versus 1.8 ± 0.2 or 2.2 ± 0.2, Figures 6a–e). However, those TID at limited WIT were mainly due to tubular dilation and cell shedding with less cytoplasmic vacuolation and cell debris in the lumen compared with prolonged WIT. In contrast, a few of reperfused kidneys with 40-min WI showed changes suggestive of early nuclear pyknosis, with widespread detachment of tubular cells from the basement membranes and dilation of peri-tubular capillaries (Figure 6d).
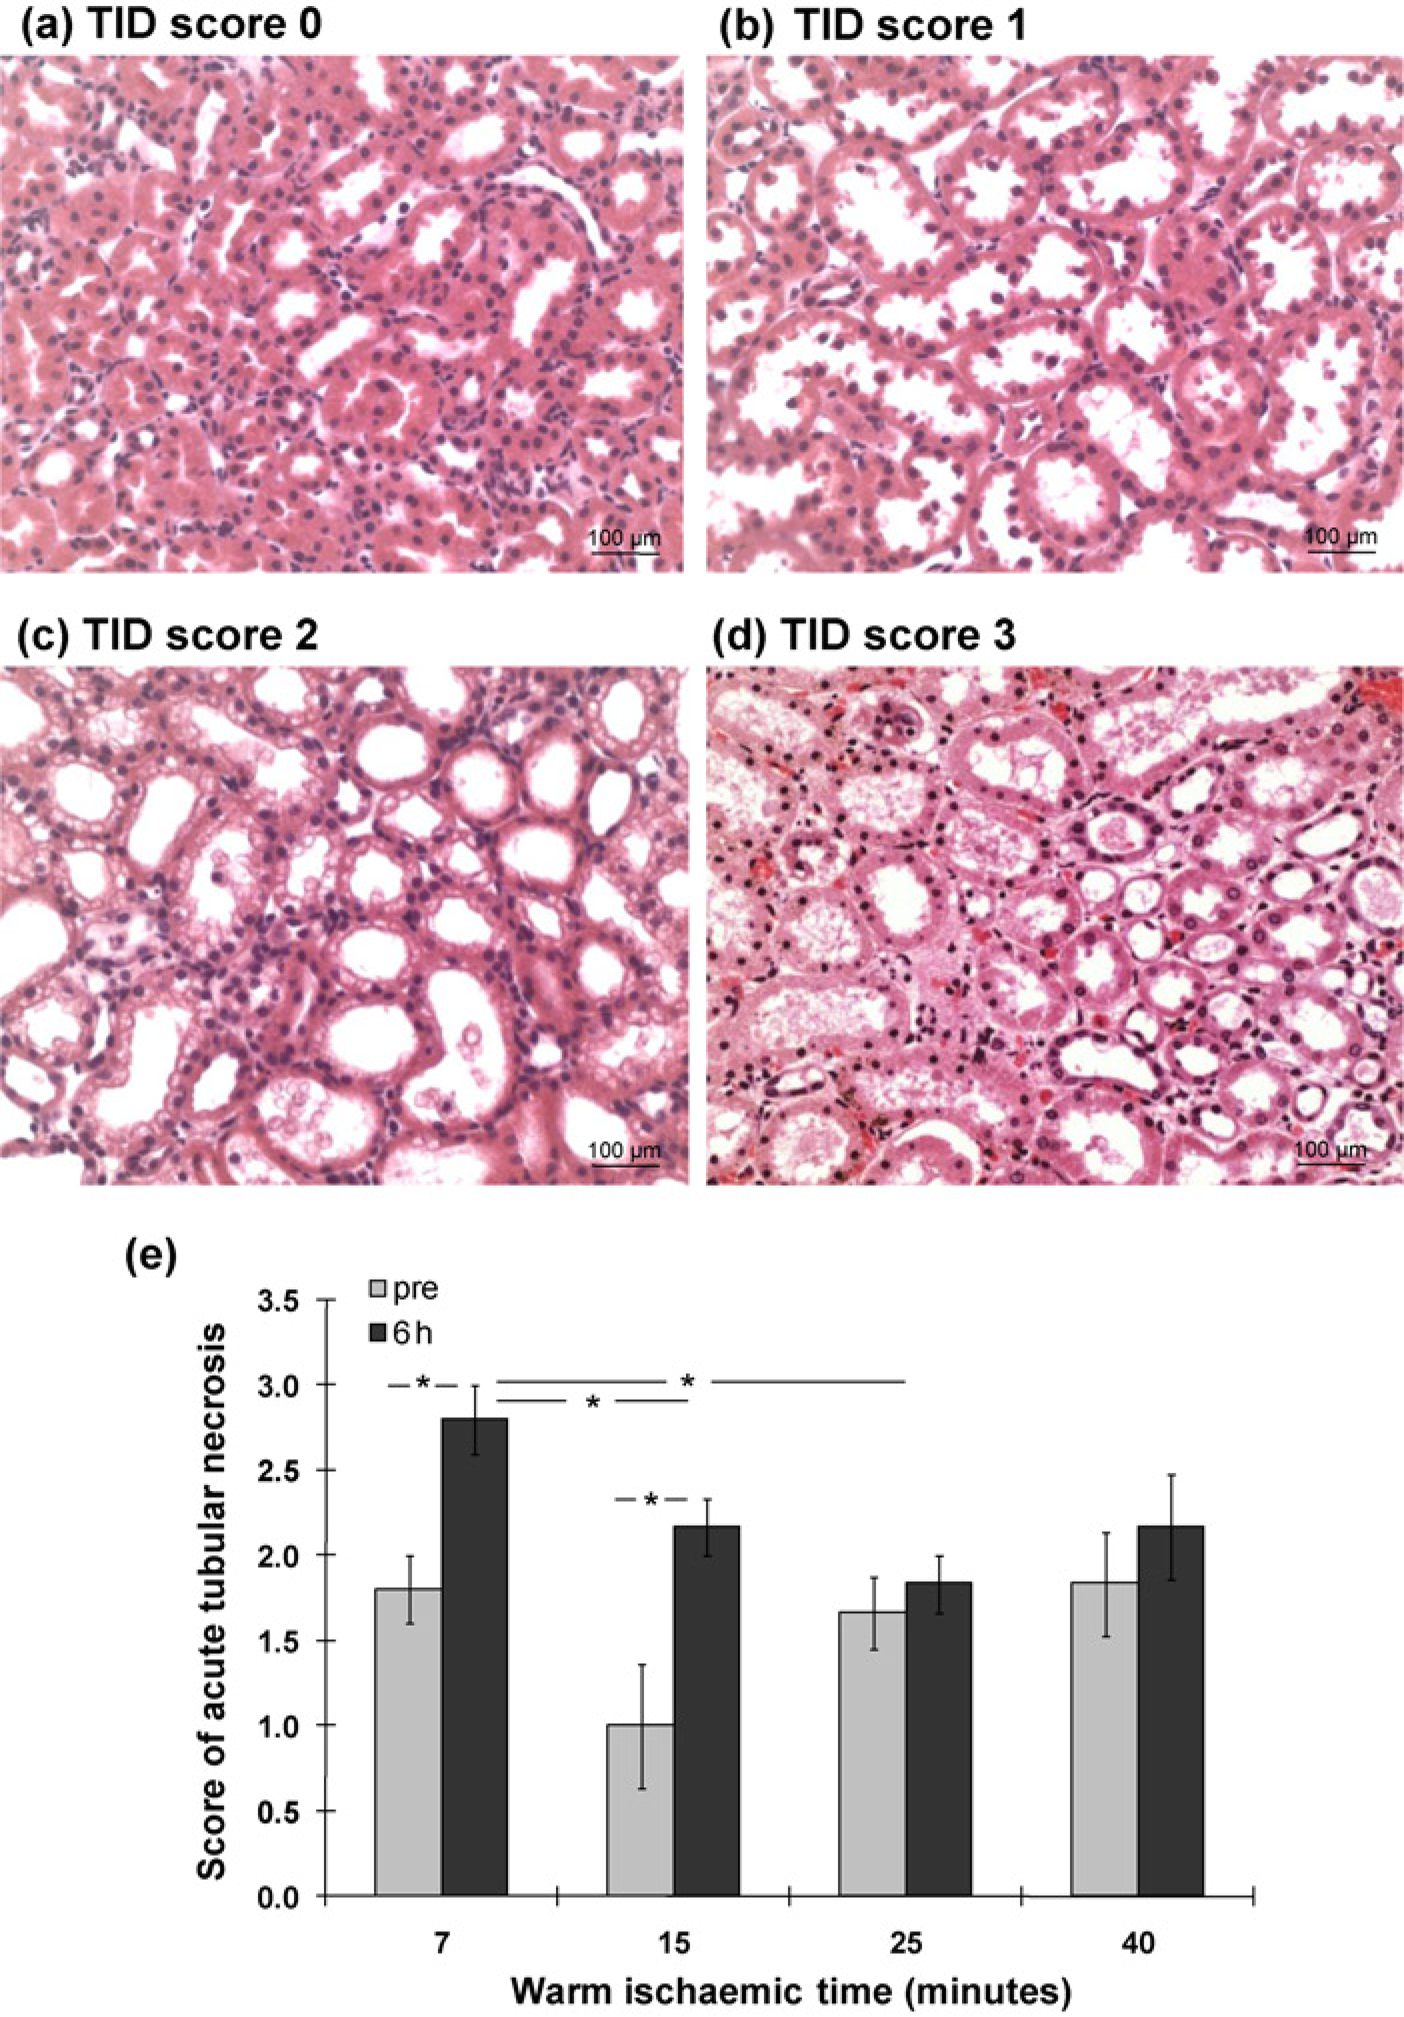
Changes of acute tubulointerstitial damage in H&E sections of pre and six-hour reperfusion kidneys. After reperfusion, the tubular dilation and cell shedding were greater (a, b). There were less cytoplasmic vacuolation and cell debris in the lumen in short WI kidneys than that in prolonged WI kidneys (c-e). A few of reperfused kidneys with 40-min WI also showed early nuclear pyknosis, widespread detachment of tubular cells from the basement membranes and dilation of peri-tubular capillaries (d). Histogram data represent mean ± SEM. n = 6. Pre 6 hours: pre and six-hour reperfusion kidneys,
Correlation between caspase-3, caspase-7, HSP70, apoptosis, MPO+ cells and renal function
We previously showed that caspase-3 activity correlated negatively with AUC (area under the curve) serum creatinine, and positively with AUC RBF and AUC urine output during six-hour reperfusion.6,7 Here, at the end of six-hour reperfusion, caspase-3 activity and 35 kDa caspase-7 protein were directly correlated with SCr negatively (r = -0.569, P < 0.01; r = -0.456, P < 0.05) and RBF positively (r = 0.699, P < 0.01 r = 0.460, P < 0.05), whereas 17 kDa caspase-3 active protein was only marginally associated with RBF (r = 0.398, P = 0.07). Both tubular and interstitial apoptosis were negatively correlated with SCr (r = -0.586, P< 0.01; r = -0.547, P < 0.05), whereas tubular apoptosis was marginally linked to RBF (r = 0.395, P = 0.08) and interstitial apoptosis was positively linked to RBF (r = 0.467, P < 0.05). MPO+ cells was associated with HSP70 (r = 0.645, P < 0.05), but neither MPO+ cells nor HSP70 was correlated with SCr or RBF. In addition, TID is not associated with any detected parameters. Moreover, multiple regression analyses among caspase-3 activity, 35 kDa caspase-7 protein as well as tubular and interstitial apoptosis showed that caspase-3 activity was most correlated with SCr and RBF (standardized β coefficient = -0.472; 0.638, P < 0.05 or 0.001).
Discussion
This study revealed that caspase-3 as well as caspase-7, was activated by reperfusion with a peak at seven minutes, and a decrease trend against prolonged WIT. Apoptotic cells in both tubular and interstitial areas were consistently increased by reperfusion in the kidney with limited WIT, peaked at seven minutes and dramatically decreased against prolonged WIT. In addition, MPO+ cells and HSP70 protein were also greatly increased in the postreperfusion kidneys, but presented as bell-shape against WIT. In addition, tubular dilation and cell shedding into the tubular lumen were significantly increased in the postreperfusion kidneys with limited WIT, while early nuclear pyknosis, tubular epithelia detachment and peritubular capillary dilation were mainly seen at prolonged WIT. Moreover, caspase-3 activity was most correlated with renal function, the same for caspase-7 precursor, tubular apoptosis and interstitial apoptosis, but to a lesser degree. MPO+ cells were associated with HSP70, but both of which were not linked with renal function. A combination of caspase-3, caspase-7 and apoptosis, therefore, could be better bio-markers than HSP70 and MPO+ cells in assessing the degree of initial WI injury in kidney donors. Hemore-perfusion activates caspase-3 and caspase-7, promotes apoptosis of damaged cells in kidneys only with limited WI, which might be beneficial to renal structural re-modeling and functional recovery.
Caspase-3, once activated, promotes apoptosis, mediates inflammation and may also contribute to necrosis.38–40 Published data were contradictory to whether active cas-pases were induced during ischemia, CS or reperfusion. 41 For the first time, higher caspase-3 activity was clearly demonstrated in the postreperfusion kidneys compared with that in the prereperfusion kidneys with a peak at seven-minute WI, and gradually decreased against prolonged WIT. This indicates that caspase-3 was activated by reperfusion in the kidneys with limited WIT and may predominantly lead to apoptotic cell death, whereas lower caspase-3 activity in the kidneys with prolonged WIT may imply an occurrence of necrotic cell death. The level of 17 kDa active caspase-3 in the reperfusion kidneys was significantly increased at all WIT with a decrease trend against prolonged WIT; 12 kDa active caspase-3 subunit was also revealed at seven minutes with a significantly lower caspase-3 precursor. The 12 and 17 kDa active caspase-3 subunits are cleavage products of 32 kDa caspase-3 precursor. The increase of active caspase-3 was more likely due to direct cleavage of their precursors instead of significant synthesis in a period of six-hour reperfusion. In addition, caspase-3 activity was most correlated with SCr and RBF, which therefore could be a useful biomarker to indentify the degree of WI injury.
The alteration of caspase-3 protein associated with caspase-7 protein was consistent with not only caspase-3 activity, but also apoptosis, which might be beneficial for the kidneys with limited WIT followed by a short period of reperfusion. However, inappropriate renal cell loss by apoptosis is detrimental in various chronic disease models 42 and acute renal IRI.43,44 Although the dual role of apoptosis provides a potential therapeutic window, the true impact of apoptosis on kidneys is difficult to predict and likely to depend on a delicate balance between the time and degree of insults, the type and location of affected cells, as well as different responses of organ systems, which is under a fine regulation of pro and antiapoptotic mediators. 45 The beneficial effect of apoptosis has been proved in Ames dwarf mice that live longer than age-matched wild-type littermates. This is because Ames dwarf hepatocytes more efficiently eliminate damaged cells by higher caspase-3 activity and apoptosis under oxidative challenge. 46 This principle may apply to kidneys subjected to a low degree of injury such as limited WIT followed by reperfusion.
As apoptosis is programmed cell death that needs energy, 48-hour CS of proximal tubular cells resulted in the activation of apoptosis only after re-warming. 47 The apoptotic process was primed by ischemia and promoted upon reperfusion, which was seen in an ex vivo human renal nor-mothermic ischemic model 41 and a murine model of renal IRI. 18 In this acute ex vivo model of porcine kidney reperfusion, it was showed, for the first time, that the number of apoptotic cells in tubular and interstitial areas was greatly increased in the six-hour reperfusion kidneys, particularly at seven-minute WI, with a sharp decrease against prolonged WIT. This confirmed that apoptosis was initiated by limited WI injury and greatly enhanced by six-hour hemoreperfusion that re-supplies oxygen and nutrients. However, the occurrence of apoptosis in this acute model may have different implications in contrast to in vivo chronic IRI models, 37 which may be not only a mode of cell death after WI injury, but also an active process of tissue re-modeling. 14 Therefore, reperfusion could be a resuscitation after limited WIT, which might facilitate damaged parenchymal cells or infiltrated inflammatory cells to be cleared away via apoptosis and subsequently provide a better opportunity for recovery of both renal structure and function.
The prolonged WIT may lead to necrosis rather than apoptosis, when renal tissues lose the chance to actively change morphology or function even after the resuscitation of reperfusion. This may help to explain why after six-hour reperfusion tubular dilation occurred extensively at seven-and 15-min WIT, but much less at 25- and 40-min WIT. This also indicates that greater tubular dilation and vacuolation after reperfusion at limited WIT may be a potential ability of re-modeling and recovery. Early nuclear pyknosis with widespread detachment of tubular cells from the basement membranes (acute tubular necrosis) was only revealed in the kidneys subjected to 40-min WI, which implies that the development of apoptosis might be blocked by the presence of irreversible tissue damage. The occurrence of necrosis could occur under ATP-depleting conditions such as under prolonged WIT. 9 It has been revealed that ATP level is a crucial determinant of manifestation of cell death in kidneys. Nevertheless, apoptosis and necrosis might coexist in certain areas, which was demonstrated by ISEL staining that picked up some necrotic cells without morphologic features of apoptosis. There was no established coagulative necrosis as one would expect given the time of sampling after only six-hour perfusion. Therefore, apoptosis, normally completed in 3–4 h, 48 closely correlated with SCr and RBF, can also be used as a biomarker in assessing the degree of initial ischemic injury followed by a short period of reperfusion.
The length of WIT negatively corresponds with caspase-3 activation, caspase-7 level, apoptosis and concomitant renal function after reperfusion. However, these transient changes in caspase-3, caspase-7 and apoptosis occurred in the kidneys only with limited WI injury are more sensitive bio-markers than functional and structural parameters. The differences between pre and postreperfusion kidneys can be revealed by the detection of caspase-3, caspase-7 or apoptosis. The model described here did not allow a comparison in the level of SCr between pre and six-hour postreperfusion because of artificially adding creatinine into the perfusion circuit, but SCr, not renal blood flow, did demonstrate significant differences between one and six-hour postreper-fusion at 7- 15- and 25-min WIT. Therefore, the measurement of caspase-3, caspase-7 and apoptosis could provide extra information as to the initial degree of ischemic injury.
MPO+ cells, mainly neutrophils, were greatly increased in the postreperfusion kidneys at all WIT, as well as HSP70 at seven- and 40-min WI, but both of which were decreased against prolonged WIT and appeared as a bell-shape. In addition, MPO+ cells and HSP70 were correlated with each other, but neither of them was associated with renal function, so they are less valuable in detecting initial ischemic injury in this study. It has been demonstrated by our previous study that MPO+ cells associated with caspase-3, apoptosis and interleukin-1beta (IL-1β) activation plays crucial roles in the improvement of renal function and structure of isolated porcine kidneys subjected to seven-minute WI and perfused by leukocyte depletion autologous blood. However, HSP70 was increased by hemoreperfusion regardless of leukocyte depletion and correlated with renal blood flow. 49 These results were consistent with an additional study in which extra erythropoietin in hemoperfusate promotes inflammatory cell apoptosis, drives inflammatory and apoptotic cells into tubular lumens, eventually leads to inflammation clearance, renoprotection and tissue re-modeling through caspase-3 and IL-1β in isolated porcine kidneys subjected to limited WI and 16-h CS. HSP70 was again increased by normothermic perfusion, but was not affected by the treatment of erythropoietin. 50 More studies in different settings will be needed before making a full judgement on these biomarkers.
It will be more beneficial to develop less/non-invasive biomarkers. Recently it has been reported by our group that early urinary biomarkers endothelin-1 (ET-1), and neutrophil gelatinase-associated lipocalin (NGAL), interleukin-6 (IL-6) and tumor necrosis factor-α (TNF-α) may be useful in determining the severity of ischemic injury in DCD, and ET-1and NGAL are more accurate in predicting the severity of ischemic injury compared with inflammatory markers, IL-6 and TNF-α. 51 Taken together, more studies are required to further evaluate the value of these potential biomarkers using a long-term transplant model before these experimental findings can be translated to clinical practice of organ transplantation. In conclusion, Caspase-3, caspase-7 and apoptosis, rather than HSP70 and MPO+ cells, might be useful combinational biomarkers in estimating the degree of ischemic injury in kidney donors before transplantation. The increased caspase-3 and caspase-7 promotes progression of damaged cells to apoptosis in kidneys with limited WIT, which acts as an active process and provides a better opportunity for renal function recovery and structure re-modeling.
Footnotes
Acknowledgements
This study was supported by the Research & Development Directorate of the University Hospitals of Leicester NHS Trust.