
Abstract
Objectives
It has been shown that the leg muscle pump increases the immediate rise in arterial leg blood flow during upright exercise in healthy subjects. The present study is the first to investigate the muscle pump effect in exercise hyperaemia in patients with venous insufficiency, who should be lacking an optimally functioning muscle pump.
Methods
Any muscle pump effect is more pronounced in an upright position because of gravitation. The exercise-induced rise in femoral artery flow (FF) (ultrasound Doppler) was thus compared in the supine and 30° head-up tilted position in 10 patients.
Results
Neither the transient nor the steady-state rise in FF showed any difference between positions. This is in contrast to the previous findings in healthy subjects, where the transient rise in FF was larger in the tilted position.
Conclusion
The muscle pump effect in exercise hyperaemia seems to be reduced or lacking in these patients.
Introduction
It is well known that patients with venous insufficiency have ambulatory venous hypertension. 1 We have also posed the following question: could insufficient venous valves also impair the rise in arterial blood flow during exercise? Although most of the exercise-induced increase in blood flow is attributable to a rapid vasodilation, 2–6 some authors concluded that the muscle pump plays an important role in exercise hyperaemia, while others have questioned this. 7,8 We have recently shown that a large hydrostatic column induced by head-up tilt (HUT) increases the immediate rise in arterial leg blood flow during upright exercise in healthy subjects, 9 probably because of an increased effect of the muscle pump. The present study is the first to investigate the muscle pump effect in exercise hyperaemia in patients with venous insufficiency, who should be lacking an optimally functioning muscle pump.
The mechanism by which the leg muscle pump promotes arterial blood flow may be as follows. Muscle contraction empties the venous vessels, and with properly functioning venous valves the venous pressure is reduced during the subsequent relaxation. The arterial–venous pressure gradient across the muscle vascular bed is increased, leading to a rise in muscle perfusion. 7,10–12 This effect should only be possible if the venous valves do prevent backflow.
The experimental calf exercise model used in this study is based on the rationale that if the muscle pump contributes to the rise in muscle perfusion during muscle work, then it should play a greater role when the hydrostatic column (and thus arterial and venous pressure) is larger. 9 We therefore compared the rise in femoral artery flow (FF) on transition from rest to rhythmic exercise (30% of maximal voluntary contraction, MVC) in the supine and 30° HUT positions. Importantly, this exercise model was developed to ensure that the muscle work is the same in both positions so that the exercise-induced vasodilation should be equal in both positions, making it possible to study the effect of the mechanical muscle pump. We hypothesized that given that the leg muscle pump contributes to the rise in muscle perfusion during muscle work in healthy subjects, then its effect should be absent or reduced in patients with venous insufficiency.
Methods
Subjects
The experiments were carried out in 10 patients (3 men) (mean age 46) with chronic venous disorder. Prior to inclusion, standard duplex ultrasound of the leg arterial and venous system was performed. Absence of lower extremity arterial disease was confirmed and all patients had isolated insufficiency of the great saphenous vein (GSV) with a reflux time >1 second. They were clinically classified as CEAP (clinical, aetiological, anatomical and pathological elements) 2 and 3, 13 thus none had ulcers. None of the patients had deep venous insufficiency. Average weight and height was 75 kg and 170 cm. One patient was on antihypertensive medication (angiotensin-converting enzyme inhibitor). Written informed consent was obtained from all participants, and the study conformed to the standards set by the Declaration of Helsinki. The study was reviewed and approved by the regional ethics committee.
Experimental design
The experimental situation was standardized as in the previous study. 9 The experiments were carried out using a manually driven tilting bed (Figure 1a). Patients performed rhythmic muscle work (30% MVC) consisting of active plantar flexions (1 second) with a passive retransport (1 second) to the starting position. The experimental protocol is illustrated in Figure 1b. The bed was tilted with the subject at rest, and the subjects then rested for two minutes before the start of exercise. Thus any of the measured variables that were influenced by the change in body position should have adjusted and stabilized when exercise started. 14 Subjects performed either two or four experimental sessions, which resulted in four or eight exercise bouts in each position.
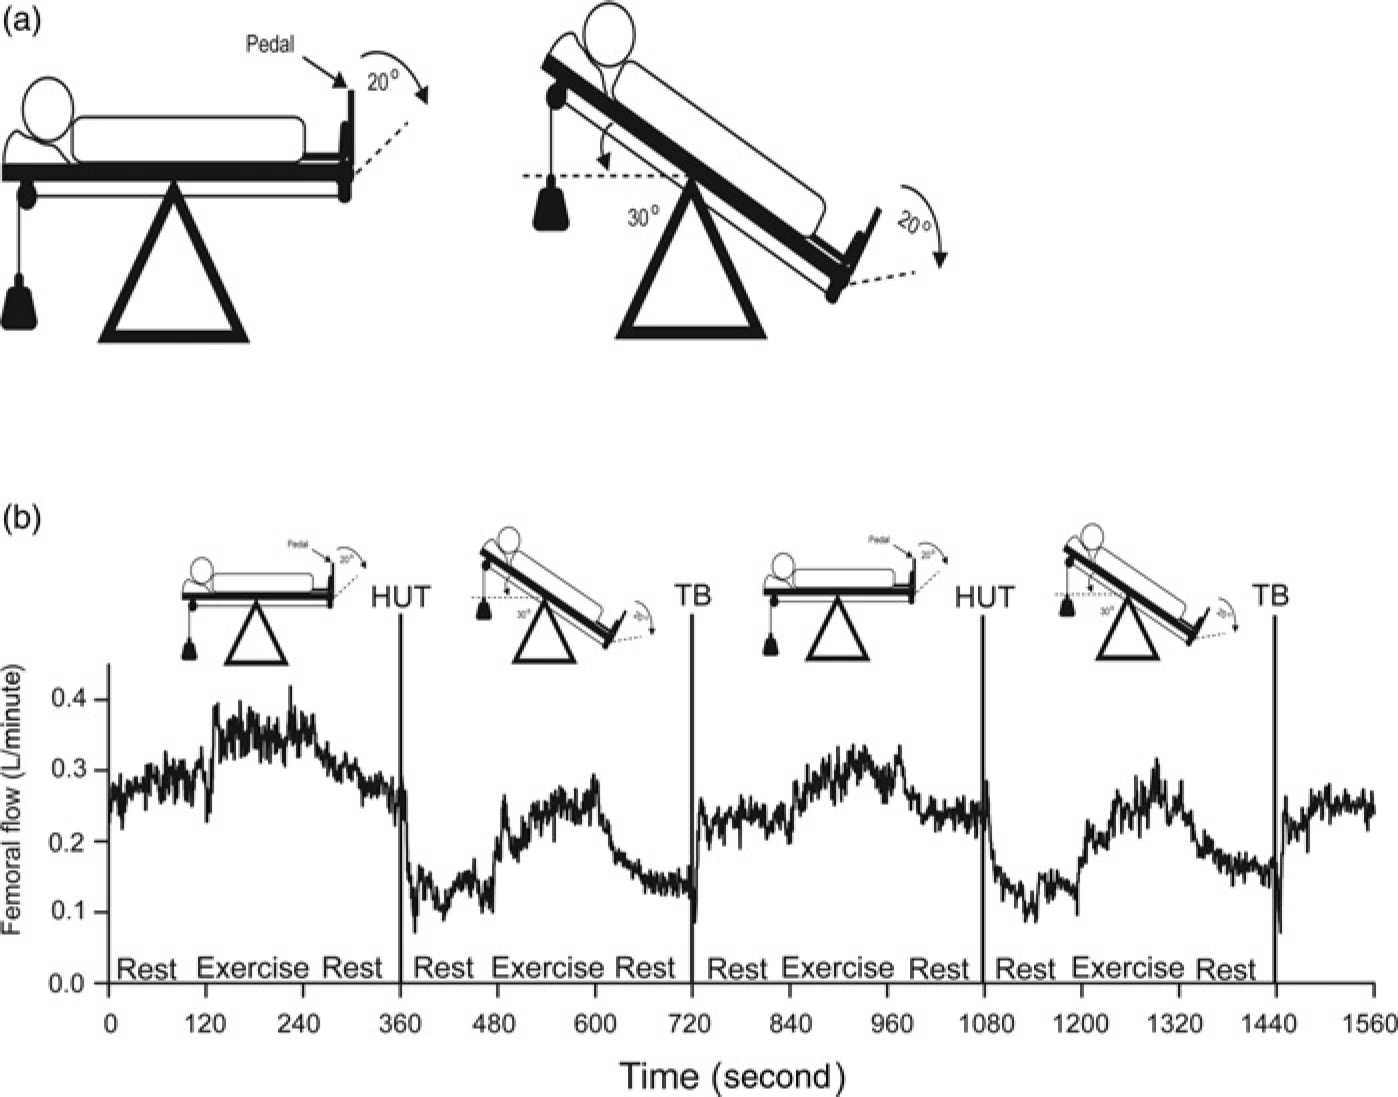
(a) Tilting bed. (b) Protocol one experimental session and femoral flow responses to exercise. HUT, head-up tilt; TB, tilt back (return to supine position). Traces are from an original recording in one patient
Instrumentation
Beat-to-beat femoral artery blood velocity was recorded using ultrasound Doppler (3 MHz) (SD-100, GE Vingmed Ultrasound, Horten, Norway). The angle of insonication was estimated to be 45° by ultrasound imaging (CFM-750, GE Vingmed Ultrasound) and we made sure that the entire vessel cross-section was covered by the ultrasound beam during the measurements. Instantaneous intensity-weighted mean velocity was calculated by the velocity metre and online interfaced to a recording computer. Instantaneous heart rate (HR) was calculated over each R–R interval of the electrocardiogram signal. The diameter of the femoral artery was determined by ultrasound imaging (CFM-750, GE Vingmed Ultrasound) as the average obtained from two frozen-screen arterial diameter images. The mean diameter for the patients was 8.8 ± 1 mm. Importantly, little or no change in femoral artery diameter is seen when going from supine to 70° HUT. 15 The beat-to-beat femoral artery ‘beat volume’ was calculated by numerical integration of the recorded instantaneous mean velocity during each R–R interval multiplied by the area of the femoral artery. Beat-to-beat femoral flow was calculated from the corresponding HR and femoral ‘beat volume’ values.
Finger arterial pressure was recorded continuously from the third finger of the left hand (2300 Finapres blood pressure monitor, Ohmeda, Madison, WI, USA). 16 Care was taken to ensure that the cuff was always at heart level in both the supine and the tilted position.
Data analysis and statistics
The variables were recorded and saved with a sampling frequency of 50 Hz, and data analysis was performed on 0.25 second averages of the recorded values (Figure 2). Femoral peripheral conductance (FPC) was calculated by dividing FF by mean arterial pressure (MAP). Steady-state and onset values were calculated for each exercise bout and then averaged to give the median for each subject. Across all subjects, the statistical significance of differences between the onset and steady-state changes in HR, MAP, FF and FPC found in the supine and tilted positions was analysed by performing two-sided paired Wilcoxon tests. The significance level was set at 0.05.
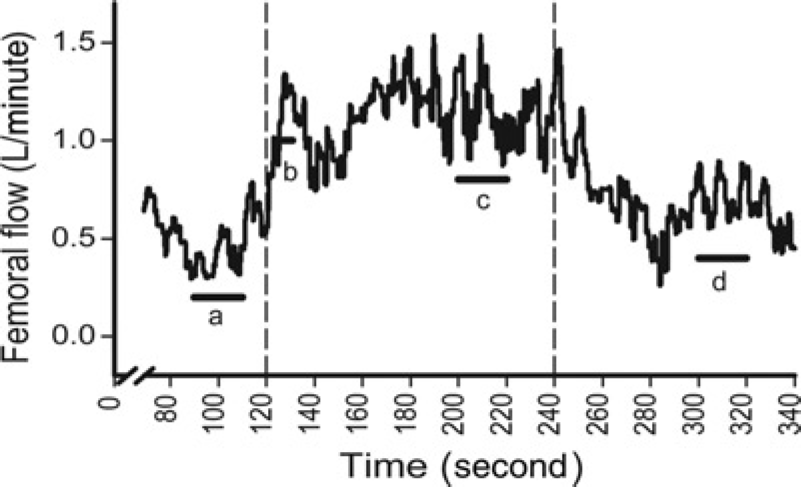
Time periods for data analysis. Femoral flow response to exercise in one supine patient. Bold lines show the time periods used to calculate resting, onset and steady-state levels. The median values for these time periods were calculated to find the rise in flow at the onset of exercise as b − a, and the steady-state rise in flow as c − (a + d)/2. a: resting baseline flow prior to exercise was calculated as the median over the 20-second period starting 30 seconds prior to exercise; b: onset exercise flow was calculated as the median over the five second-period starting seven seconds after exercise started (included peak flow for all subjects in supine and tilted positions); c: steady-state exercise flow was calculated as the median over the 20-second period starting 80 seconds after onset of exercise and d: resting baseline flow after exercise was calculated as the median over the 20-second period starting 60 seconds after exercise ended. Mean arterial pressure, heart rate and femoral peripheral conductances were also analysed using these time periods
Results
The time course of FF response to muscle work is shown in one patient in Figure 1b. In both supine and tilted positions muscle work immediately increased FF, which was restored to baseline after the end of exercise. During tilt-up there was a transient increase in FF, followed by a reduction in flow. Changes were in the opposite direction during tilt back to the supine position. Figure 2 shows a single patient exercise bout in the supine position and indicates the time periods (a, b, c and d) used in the data analysis. Figure 3 shows the rise in femoral blood flow, as the median of the individual medians for patients with an insufficient GSV (a), and for data taken from healthy subjects (b). 9 Onset of exercise immediately increased FF in both the tilted and supine positions, which then adjusted and stabilized at a steady-state level. After the end of exercise, FF returned to resting level. The statistical results are shown in Table 1. Exercise immediately raised HR, but only by a few beats in both positions. The rise in the supine position was a few beats larger (P < 0.05) than in the tilted position, and there was no difference between the steady-state responses in the supine and tilted positions. There were only minor changes in MAP, and neither the transient nor the steady-state response in MAP showed any difference between the positions. In the previous study with healthy subjects, the transient rise in FF was larger in the tilted position than in the supine position, indicating a muscle pump contribution in exercise hyperaemia. 9 For the patients in the present study neither the transient nor the steady-state response in FF and FPC showed any difference between the supine and tilted positions.
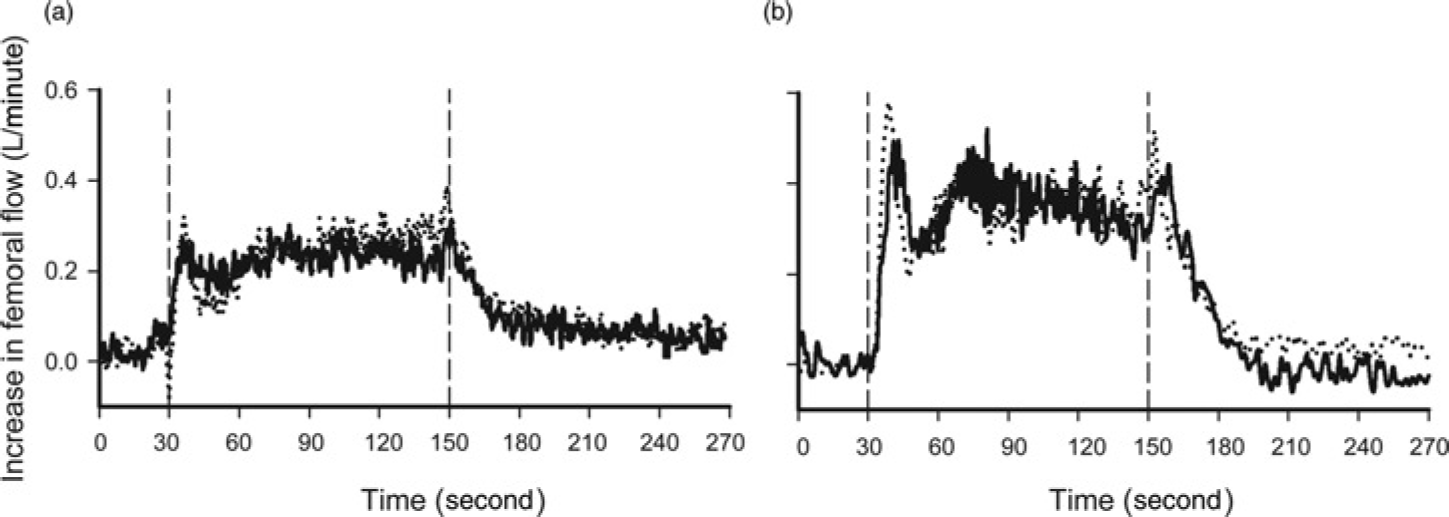
Rise in femoral flow. Exercise-induced flow response (30% MVC) for 10 patients with GSV insufficiency (a) and for healthy subjects (b). 9 Vertical lines mark the beginning and end of exercise. Solid and dotted lines denote responses in the supine position and tilted positions, respectively. MVC, maximal voluntary contraction; GSV, great saphenous vein
Onset and steady-state exercise responses
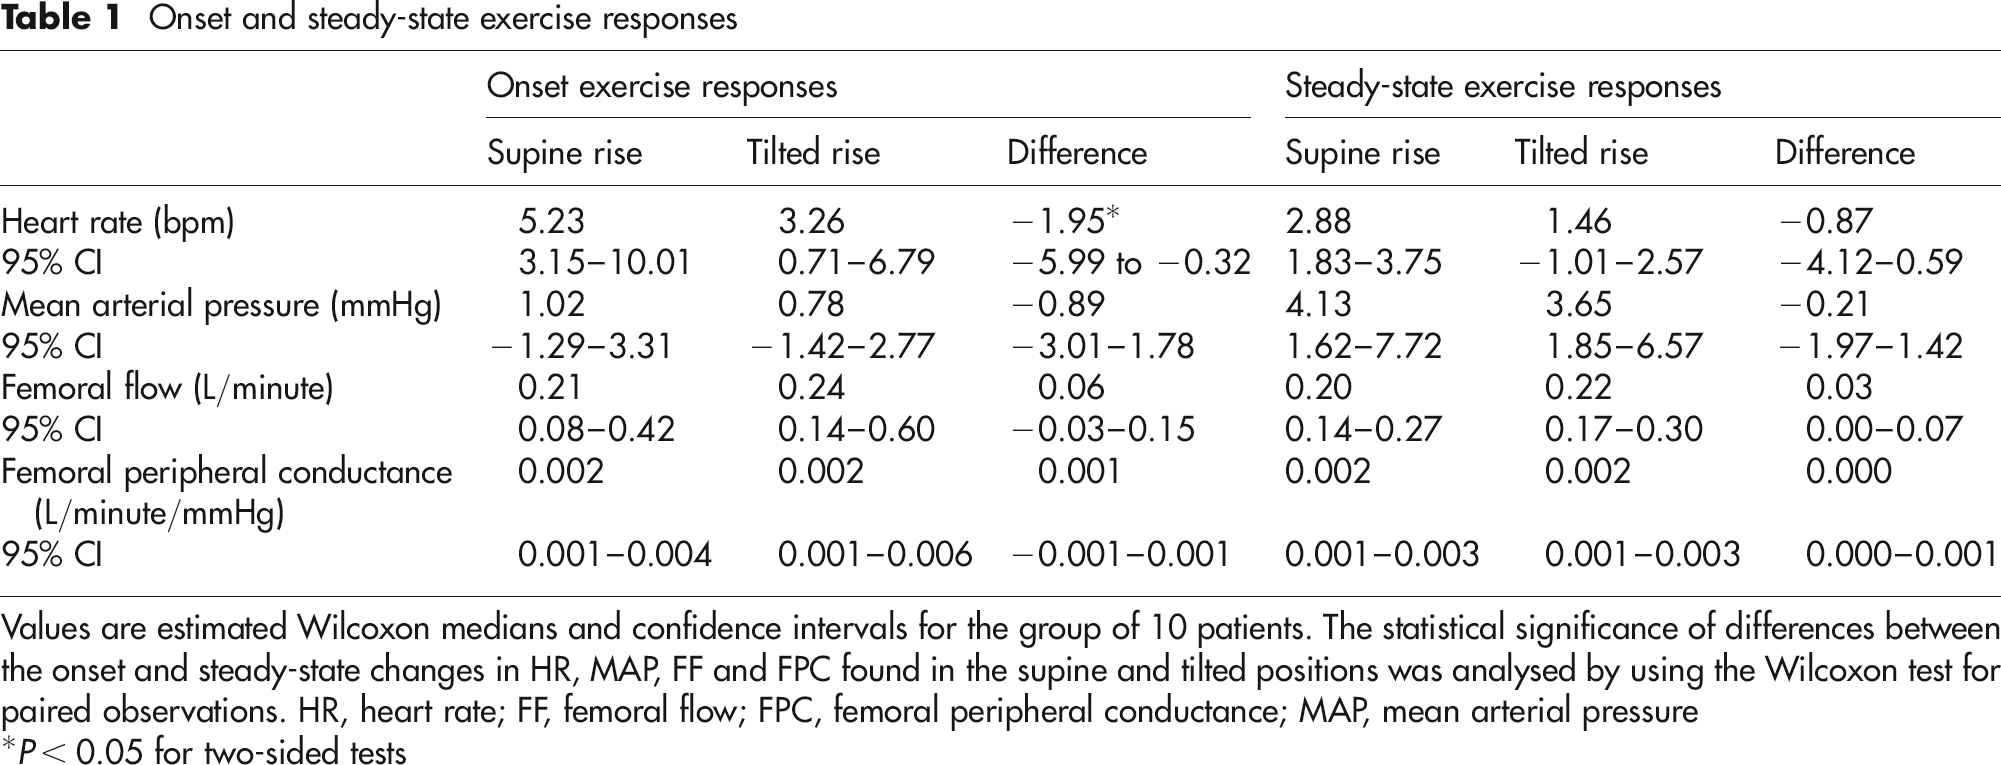
Values are estimated Wilcoxon medians and confidence intervals for the group of 10 patients. The statistical significance of differences between the onset and steady-state changes in HR, MAP, FF and FPC found in the supine and tilted positions was analysed by using the Wilcoxon test for paired observations. HR, heart rate; FF, femoral flow; FPC, femoral peripheral conductance; MAP, mean arterial pressure
*P < 0.05 for two-sided tests
Discussion
The main finding in this study is that for the exercise-induced rise in FF and FPC there was no difference between the supine and tilted positions, indicating that the muscle pump effect on muscle perfusion is reduced or absent in patients with GSV insufficiency. This is in contrast to our previous findings in healthy subjects, where the transient rise in FF was larger in the tilted than in the supine position. 9
GSV insufficiency would influence the deep venous system and muscle pump efficacy. As contraction of the calf muscles pushes blood from deep veins towards the heart, blood pressure in both deep and superficial veins decreases during the subsequent relaxation, if the venous valves are sufficient. The calf perforator veins enable an equilibration of pressure changes between deep and superficial veins. 17,18 A more pronounced pressure fall in the deep veins causes blood to drain from superficial veins through perforator veins and into deep veins. 17,19 Patients with GSV insufficiency have venous reflux, ambulatory venous hypertension and faster venous refill time. 1,20 Additionally, bidirectional flow within calf perforators takes place both in healthy subjects and in patients with varicose veins, 18,21 but the inward component of this flow prevails over the outward component in patients with superficial venous insufficiency, and the larger the saphenous reflux, the more pronounced the inward vector is. 22 Consequently, more blood could be drained from superficial into deep veins. This in turn could impair the muscle pump and restrict the widening of the arterio-venous pressure gradient and thus also the gain in arterial leg blood flow.
In the present study, as in the previous study with healthy subjects, 9 we wanted to investigate the femoral artery blood flow response to the same constant muscle work performed in both the supine and in the tilted positions. All the patients lifted weights corresponding to their individual 30% MVC. The patients were older than the healthy subjects (mean age 46 versus 23) and lifted less weights (mean 4 versus 6 kg, range 3–6 versus 6.5–8 kg). Any difference in locally induced vasodilation caused by a reduction in work load and also by any age-related reductions in vasodilator responsiveness 23–25 cannot explain the lack of a difference in the rise in FF between the supine and tilted positions in the patient group. This is because such reductions should be exerted equally in both positions and therefore should not obscure the mechanical influence of the muscle pump, which appears to be lacking in our current patient population compared with our previous healthy population.
Conclusions
The results of this study indicate that GSV insufficiency can modestly impair the muscle pump contribution in exercise hyperaemia. One would expect greater impairment in patients with deep venous insufficiency. Consequently, a failure in the venous system could affect arterial blood flow during exercise.
Footnotes
Acknowledgements
We thank Lars Walløe, Torun Flatebø, Maja Elstad and Erling Bekkestad Rein for valuable assistance and discussions. This project has been financially supported by the Norwegian Extra Foundation for Health and Rehabilitation through EXTRA funds, the Norwegian Health Association, University of Oslo and Akershus University Hospital.