




Abstract
The goal of this study was to experimentally validate a steady-state mathematical model, which can be used to compute the forces acting on a bifurcated endoluminal stent graft.
To accomplish this task, an acrylic model of a bifurcated graft was used for the force measurements. The graft model was connected to the inlet piping with a flexible rubber membrane that allowed the graft model to move. This allowed us to measure the force owing to the movement of the graft model with a calibrated load cell. Steady-state blood flow was assumed, and the working fluid was water.
The experimental data were found to be consistent with the results from a previously published mathematical model: the graft force is strongly dependent on the proximal or inlet pressure and the inlet area. The force tends to be weakly dependent on flow rate.
More research work will be required to determine whether the steady-state force model examined in this article provides a realistic determination of the forces on an endoluminal stent graft that is subject to pulsatile blood flow.
Bifurcated endoluminal stent grafts are used for the repair of abdominal aortic aneurysms. It is important to understand the magnitude of the forces acting on bifurcated endoluminal grafts in a pressurized aorta because excessive force may dislodge a graft, which, in turn, may lead to repressurization of the aneurysm. A number of articles provide data on the expected forces on stent grafts that have been calculated by analytic modeling and computational fluid dynamics. 1,2 As with any theoretic modeling, experimental data are required for validation. The importance of knowing the forces involved with given pressures, flow rates, and configurations of grafts relates to design, use, prognosis, and follow-up. 3 The purpose of this study was to experimentally measure the effect of pressure and flow rate on the forces acting on a model of a bifurcated endoluminal stent graft. The experimental results were then compared with predictions from an analytic model.
Methods
Experimental Model
An acrylic model of a bifurcated endoluminal stent graft that was used for the force measurements is shown in Figures 1 and 2. The model was suspended in midair via a metal support connected to a load cell that was used to measure the force acting on the graft.
Close-up of the model of a bifurcated endoluminal graft (all dimensions are in millimeters). Overall view of the experimental model of a bifurcated endoluminal graft supported by a load cell.
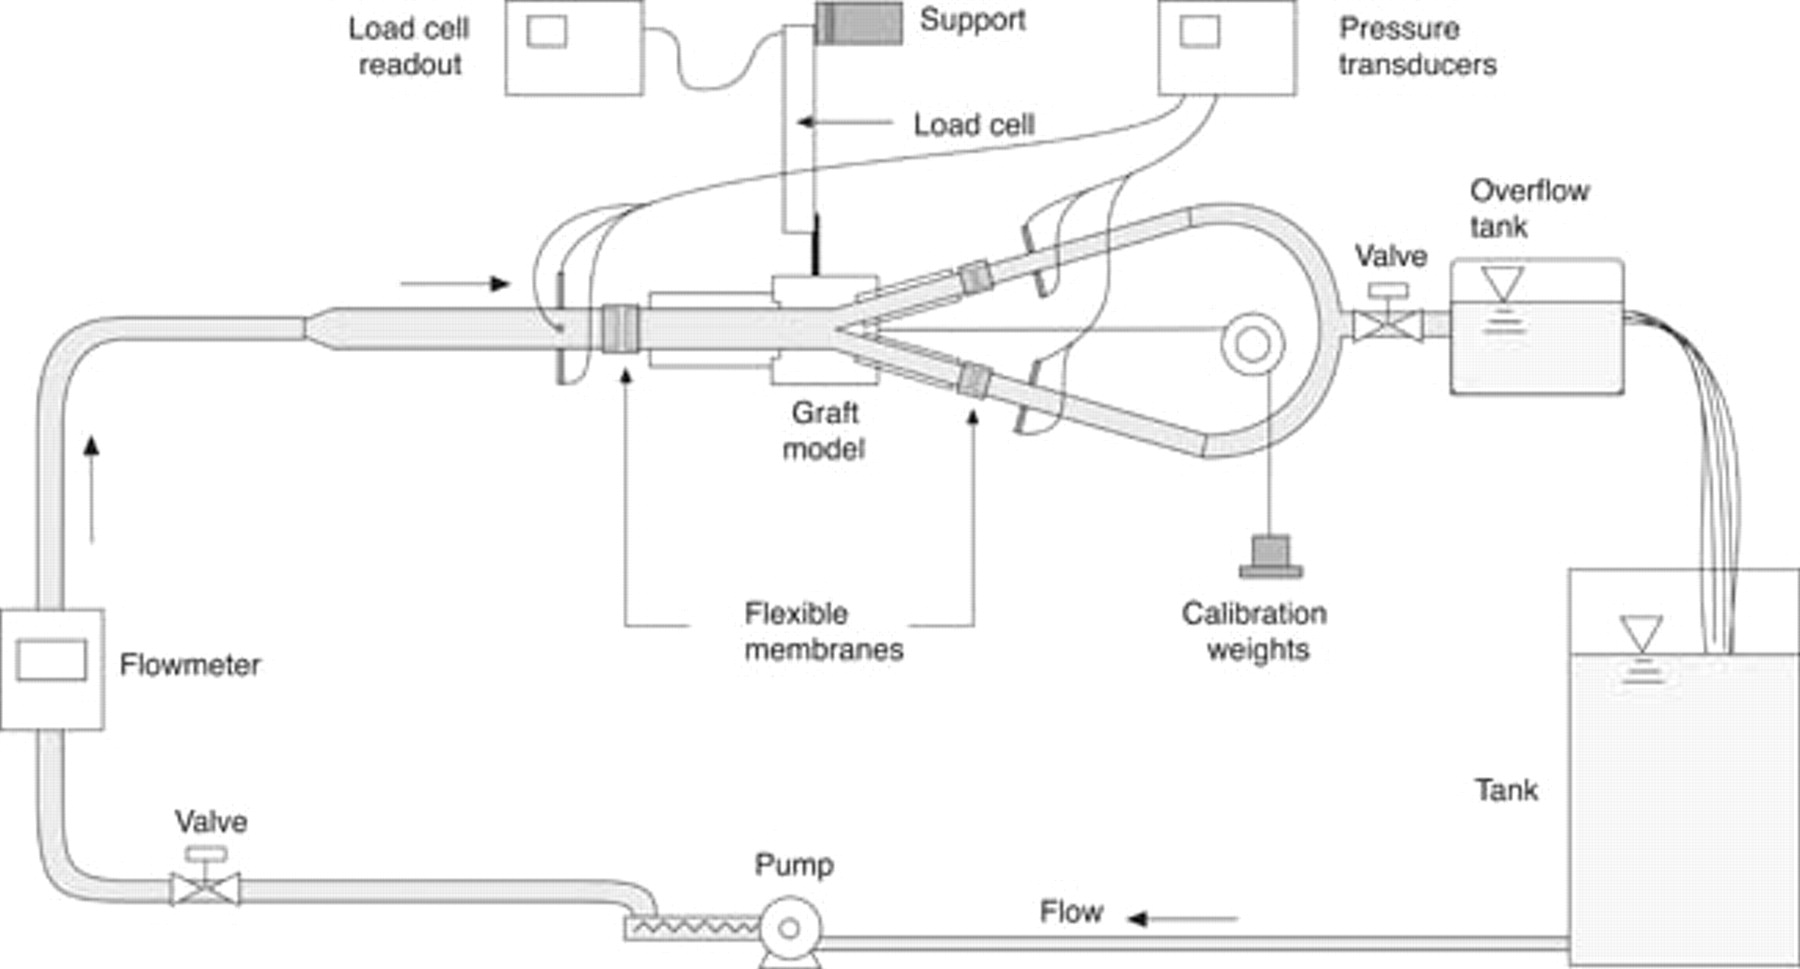
The graft model was connected to the inlet piping with a flexible rubber membrane that allowed the model to move. The load cell measured the movement of the graft, and this was converted into a force. The internal diameters of the proximal graft inlet and distal graft outlets and those of the flexible membranes (for an unpressurized system) are given in Table 1. These graft inlet and outlet diameters were selected as representative values for current endoluminal abdominal aortic aneurysm stent grafts.
Dimensions of the Model of a Bifurcated Endoluminal Stent Graft
Steady-state flow was assumed, and the working fluid was water. Steady-state flow was chosen because the currently published force equations for endoluminal grafts all use the steady-state flow assumption. 1,2 It was thought prudent to experimentally verify this theory, for at least one case, before moving on to pulsatile flow. We are currently developing pulsatile force equations for forces on endoluminal grafts.
The angle between the two symmetric distal graft legs was 30°. The inlet pressure was typically set to 80 mm Hg (10,664 Pa), and the peak speed through the graft was set at 0.6 m/s (17.2 L/min). The flow speed of 0.6 m/s corresponds to an approximation of the peak systolic flow rate. 4
To allow the comparison between theory and experiment, the pressure was varied from 7 to 100 mm Hg, whereas the flow rate was varied from 4 to 17.2 L/min (0.14 to 0.6 m/s). Owing to external restrictions on the laboratory rig, it was difficult to obtain higher pressures. However, the analytic force solution is perfectly general and will easily allow the computation of forces on the graft for higher pressures, larger inlet areas, larger flow rates, and fluids with different viscosities.
It should be noted that 17 L/min is a relatively high flow rate and may change the flow from laminar to turbulent. The flow state of the fluid affects the pressure drop from the entrance to the exits of the graft (Appendix 1). When computing the forces on a graft, the flow state of the fluid in the graft becomes a consideration if we have to calculate the pressure drop. However, because we measured the pressure at the entrance and the exits of the graft, the high flow rate through the graft would not have affected our calculations or measurements of the forces on the graft.
The graft was oriented horizontally so that we could ignore the weight force on the graft. The horizontal orientation is approximately equivalent to the case when a patient is lying down. The load cell was a Precision Transducers Limited PT1000 (Auckland, New Zealand) with a maximum rating of 3 kg or 30 N and was driven by an Analog Process Control Services Pty Ltd WT127 Strain Gauge Transmitter (Sydney, Australia).
Flexible rubber membrane sleeves were cut from rubber gloves and pulled over and then siliconed onto the outside of the graft and adjacent piping at the inlet and outlet regions of the grafts. The load cell was calibrated in situ, with the flexible rubber membranes already in place, by means of known weights suspended by cord lines over pulleys that minimized friction with the change in direction. By having the flexible rubber membranes in place during the calibration, the effect of the flexible membrane was minimized. The load cell was calibrated with the rig full of water to eliminate any effect of the weight of the water on the load cell output.
In the force measurement experiments, the flexible membrane had some minor hysteresis, which made it difficult to obtain exactly the same zero after a larger force was applied. Error bars were added to the force measurement data to account for force calibration error. Also, the internal diameter of the flexible membrane expanded slightly when the graft was pressurized. Because the graft force is sensitive to the input and output diameters of the graft, we made accurate measurements of the internal diameter of the expanded flexible membranes.
A calibrated Tata Honeywell Ltd ST 3000 pressure transducer (Puna, India) was used to monitor the pressure in the rig via pressure taps positioned both upstream and downstream of the model. During the experimental runs, care was taken to ensure that the pressure tapping lines were purged of air. The water flow rate was measured by an electromagnetic flow meter (ABB Automation Products GmbH, ABB Model, DS41F, Göttingen, Germany).
Analytic Model
The analytic force balance model has been outlined. 1,2 The model allows one to compute the forces on a planar, bifurcated graft. The equation describing the force required to keep a symmetric, bifurcated graft in place is given by equation 14 in Appendix 2.
For an inlet velocity of 0.6 m/s, the typical measured pressure drop across the bifurcated endoluminal stent graft was 5.25 mm Hg (700 Pa).
Results
In this section, the effect of upstream pressure and flow rate on the force on an endoluminal graft is assessed. Experimental force measurements are compared with the predictions from an analytic model. The main limitations in this experimental investigation are steady-state flow, water as a working fluid, an inflexible graft, and the fact that the effect of gravity was ignored. It should be noted that for all of the measured quantities, except for the forces on the bifurcated graft model, the measurement errors were very small relative to the measured values and have been neglected. The maximum error on each force measurement is estimated to be approximately ± 0.1 N.
Experimental Model
Figure 3 shows that the force on the model of the bifurcated endoluminal stent graft is strongly dependent on the upstream (proximal) pressure. The same trend of an increase in force with an increase in pressure was observed at the high flow rate of 17.2 L/min (0.6 m/s) and the medium flow rate of 8 L/min (0.28 m/s).
Measured force on a model of a bifurcated endoluminal graft as a function of proximal upstream pressure.
The force on the model of the bifurcated endoluminal stent graft is only weakly dependent on the fluid flow rate (and velocity), as seen in Figure 4. When the flow rate was increased from 4 to 17.2 L/min for a constant proximal upstream pressure of 80 mm Hg, the force increased only from 2.56 to 2.74 ± 0.1 N. The majority of the force is a result of proximal pressure and the cross-sectional area differences between the proximal and distal ends of the graft rather than due to the flow rate.
Measured force on a model of a bifurcated endoluminal graft as a function of flow rate for a constant upstream pressure of 80 mm Hg.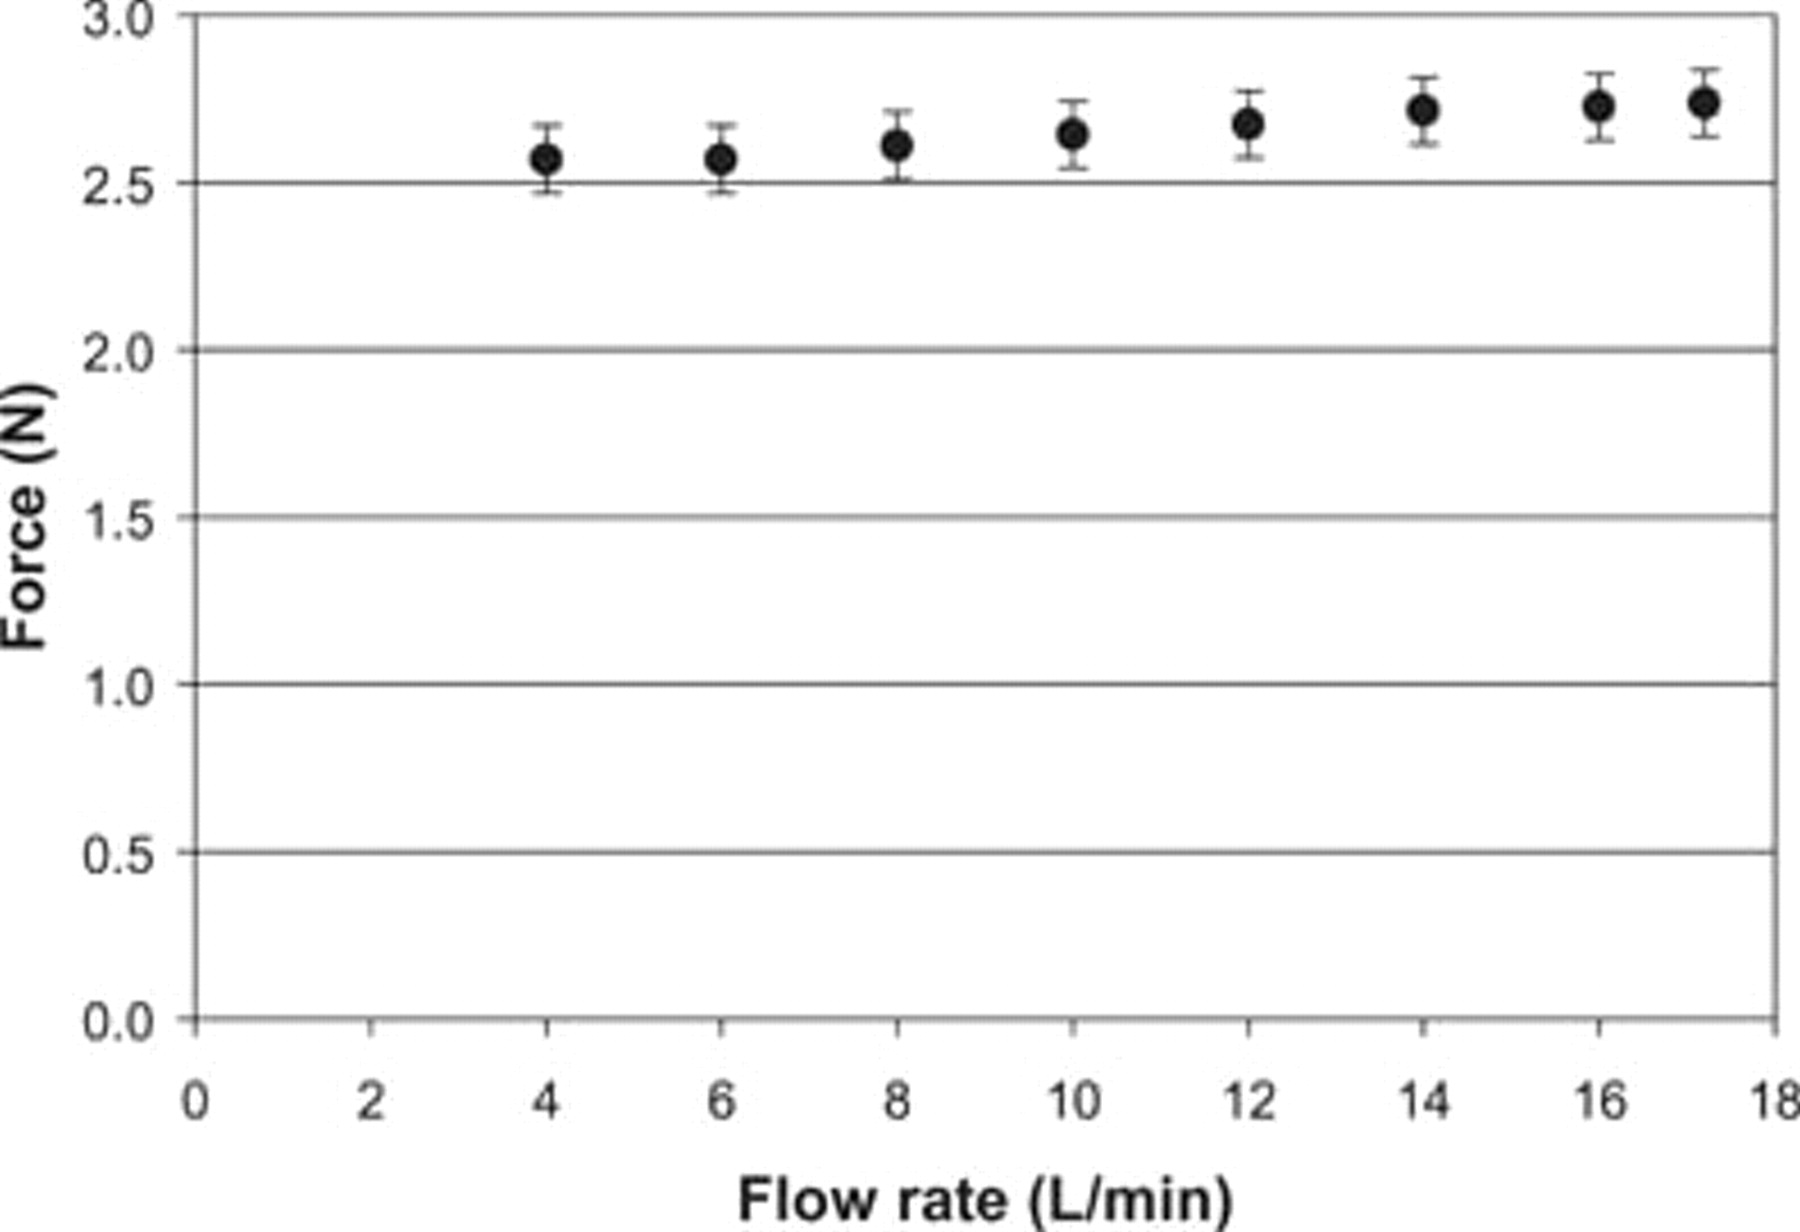
Comparisons with Analytic Model
The experimental and analytic model results are compared in Figures 5 and 6. It can be seen that the analytic model predicted the same force versus pressure and flow rate trends as were measured experimentally. However, the analytic model predicted force values that were usually about 0.4 N lower than those measured experimentally.
Measured and predicted forces on a model of a bifurcated endoluminal graft as a function upstream pressure at two flow rates. Measured and predicted forces on a model of a bifurcated endoluminal graft as a function of flow rate for a constant upstream pressure of 80 mm Hg.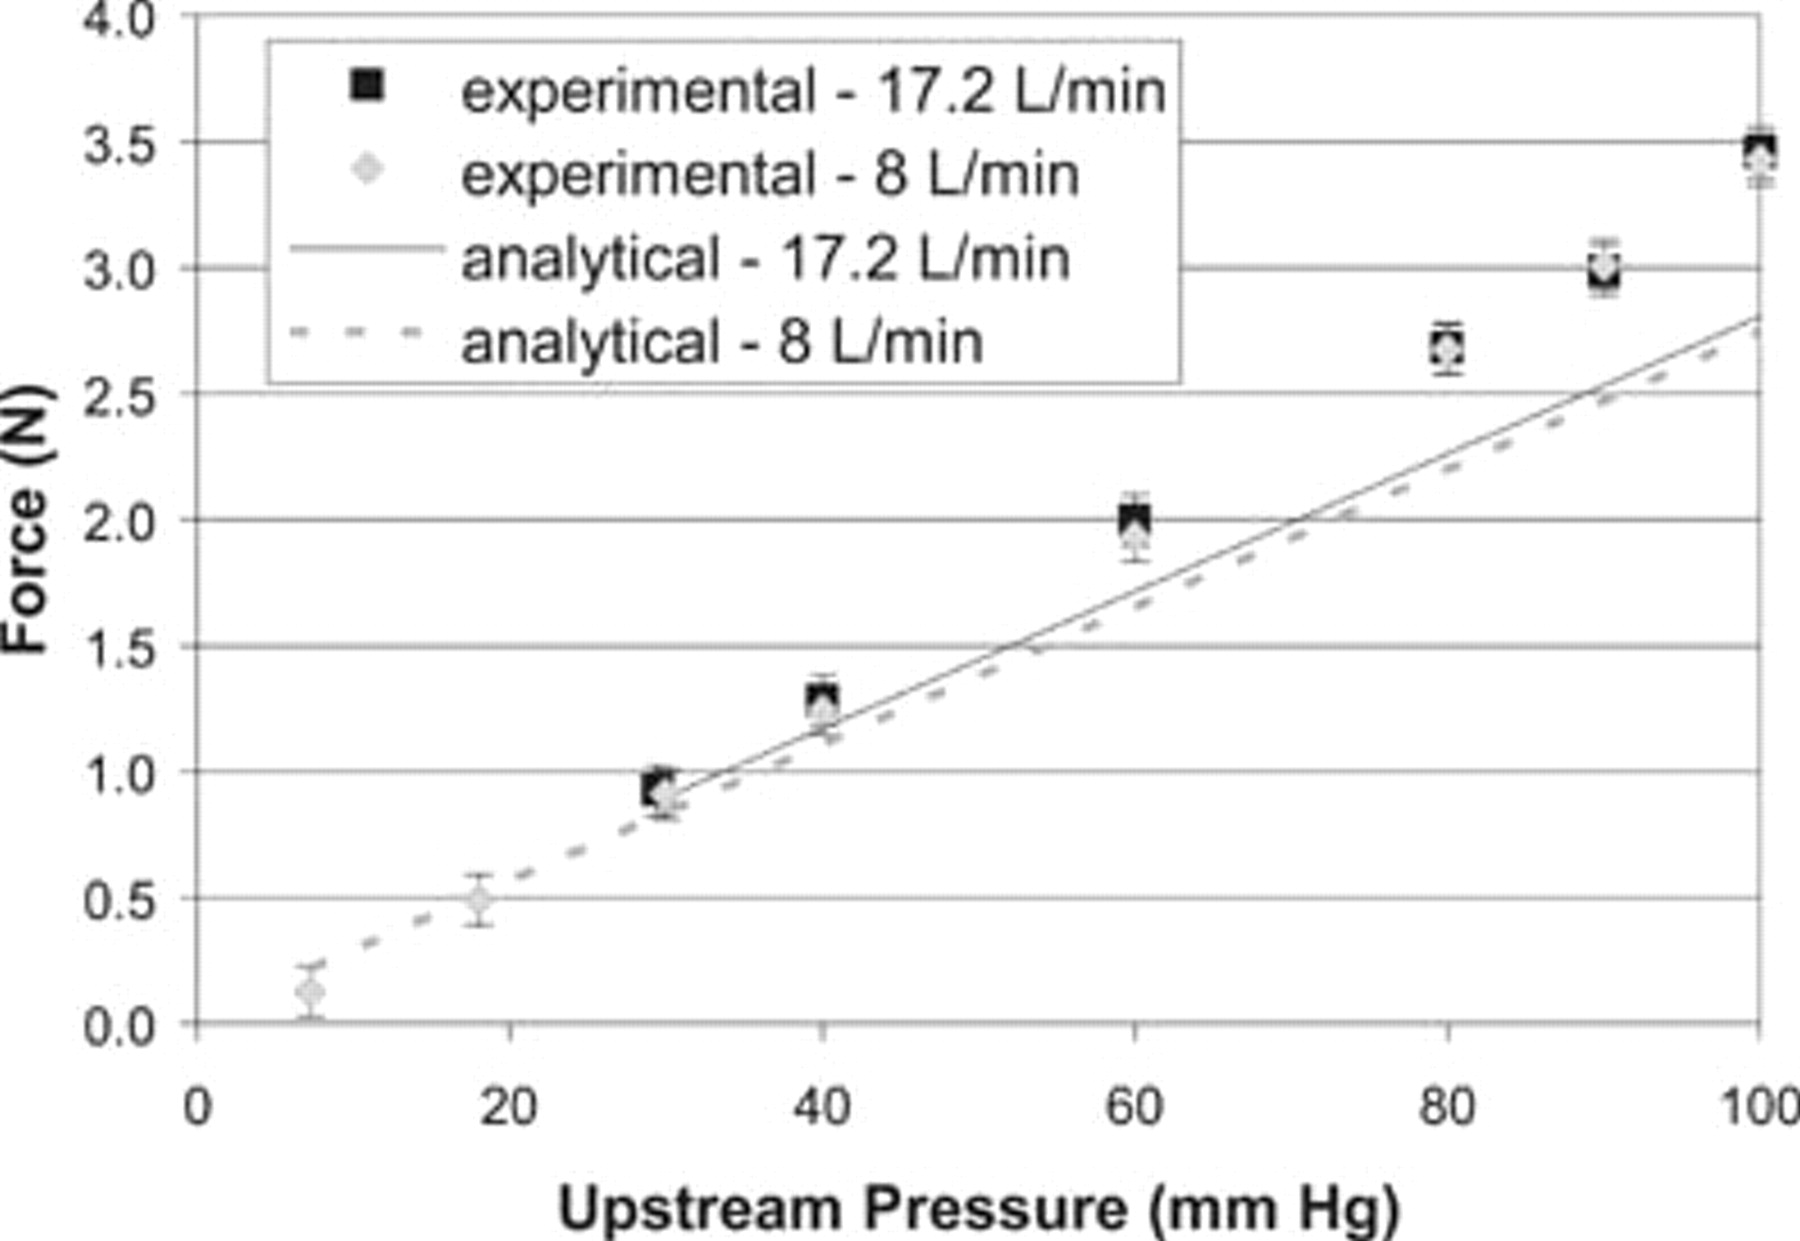

A comparison of the experimental and analytic model results on the forces on the bifurcated endoluminal stent graft model is summarized in Table 2, where it can be seen that the experimental results are higher, on average, by approximately 0.43 ± 0.1 N.
Comparison of the Experimental and Analytic Model Force Results
It is believed that the experimental results were higher than the model results owing to the fact that the analytic model results did not take into account the slight expansion in the flexible membrane owing to the pressurization of the experimental rig. The expansion of these membranes slightly increased the effective proximal inlet area of the graft and thereby increased the force on the graft. This effect can be seen in Figure 5, where the analytic model and experimental results coincide for lower pressures and diverge for higher pressures.
Analytic and Computational Fluid Dynamics models previously have shown that increasing the graft proximal diameter increases the force.
1
Using the same analytic model for a constant flow rate of 17.2 L/min, the effect of the graft proximal diameter on the force was predicted for pressures of 80 and 100 mm Hg, as shown in Figure 7. It was found that for a constant pressure of 80 mm Hg and flow rate, a 1 mm increase in proximal endoluminal graft diameter would result in an approximately 0.42 N increase in the force predictions. Similarly, an increase in force with an increase in proximal diameter was observed in preliminary experiments in which the graft model had a thicker wall and, hence, the flexible membrane had a larger internal diameter.
Predicted force on a model of a bifurcated endoluminal graft as a function of inlet diameter for a constant upstream pressure of 80 mm Hg and a flow rate of 17.2 L/min.
When the bifurcated endoluminal stent graft model was pressurized, the flexible membrane was observed to expand slightly, thereby increasing the flexible membrane diameter. Figure 8 shows that if we assumed a membrane diameter of 25.6 mm (rather than 24.6 mm) for the proximal inlet of the graft corresponding to the actual internal diameter of the expanded flexible membrane, the values from the analytic model were the same as those measured experimentally. To obtain these computed values, it was also assumed that the diameter of each distal leg was given by the internal diameter of the membrane at the outlet of 13.4 mm.
Measured and predicted forces on a model of a bifurcated endoluminal graft as a function of pressure for a constant flow rate of 17.2 L/min.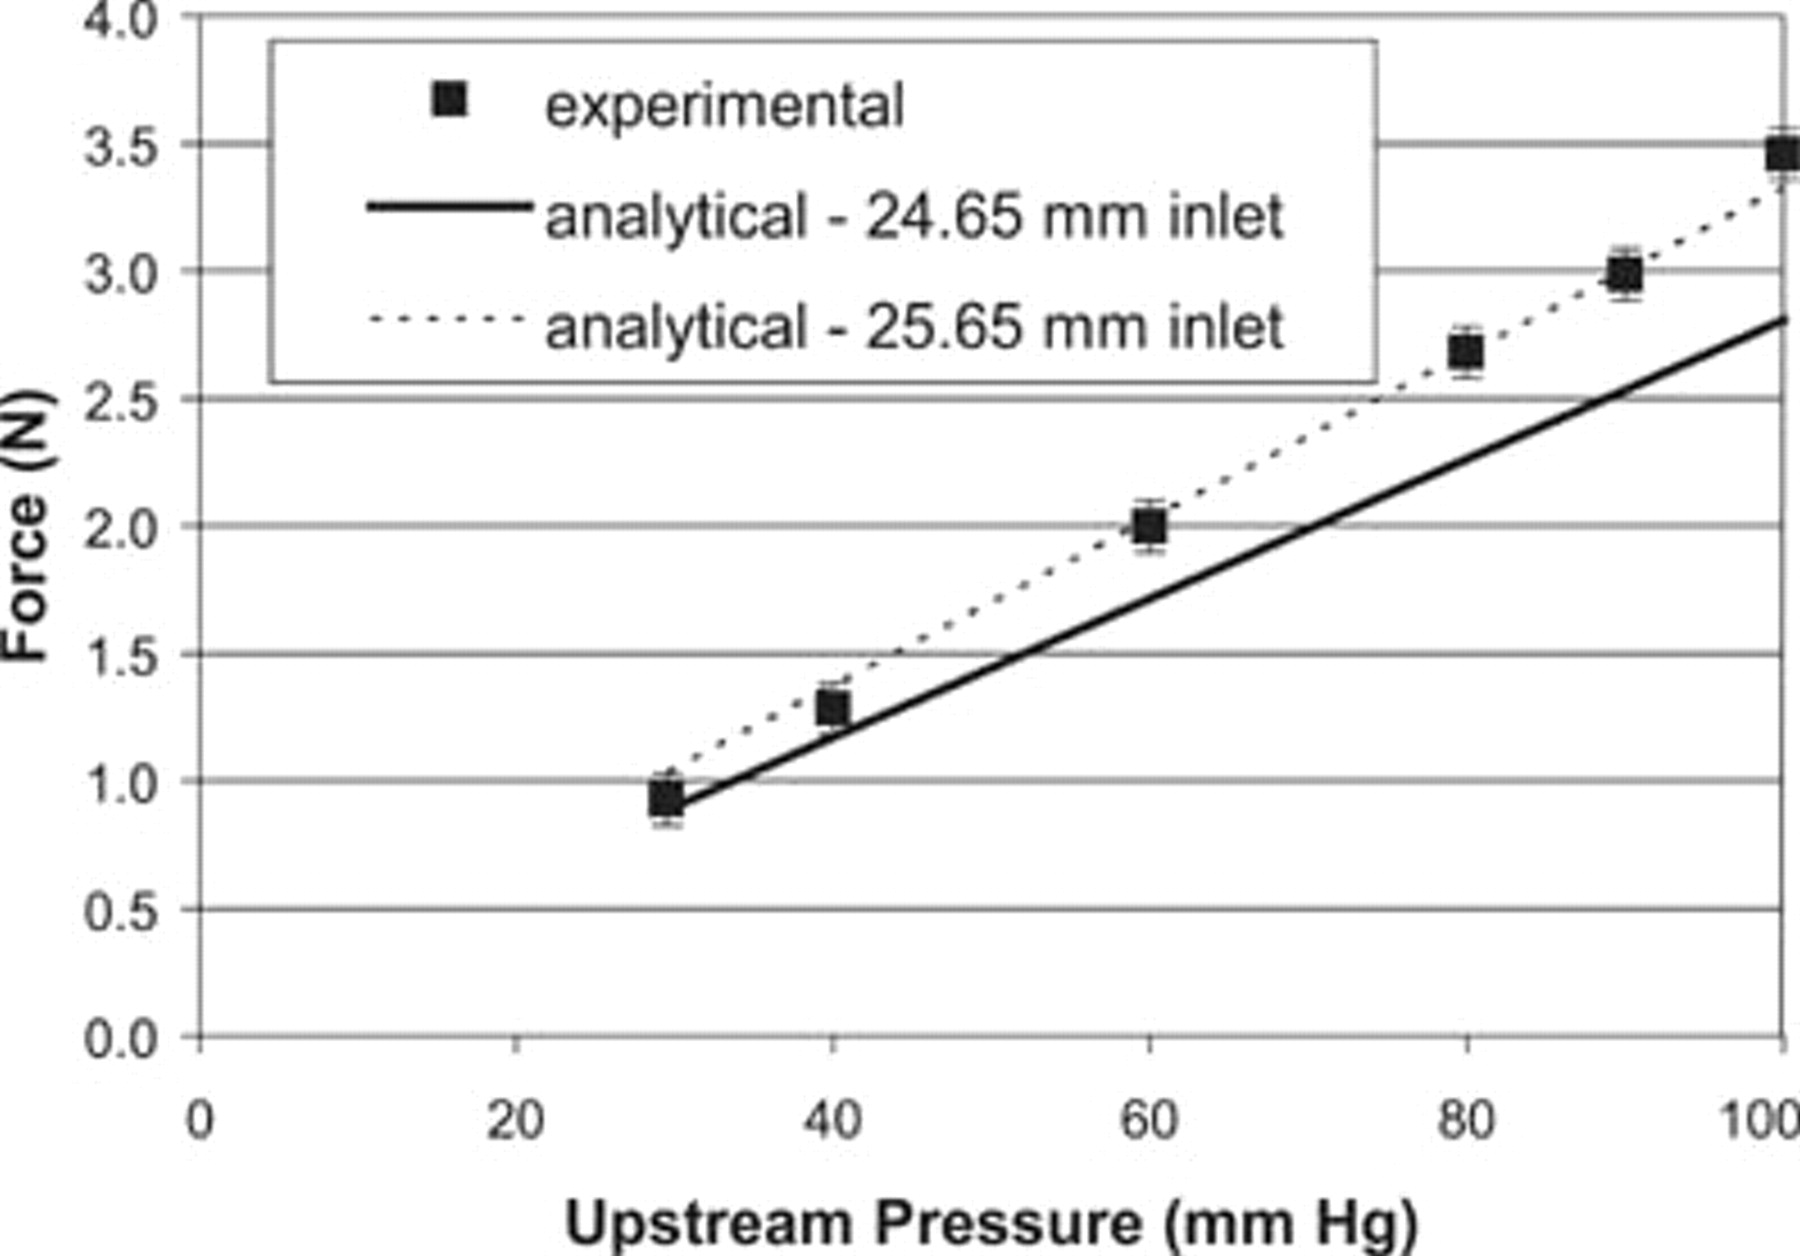
Discussion
The results given in this article suggest that the analytic model for the force on the graft is, for steady-state flow, a realistic model. Using the analytic model, what, then, can we deduce about how graft shape and structure affect the forces on a graft? In Appendix 1, we derive the general case for forces on a single-tube graft. As a first example, we consider a simple cylindrical tube graft, as shown in Figure 9.
Flow through a cylindrical graft.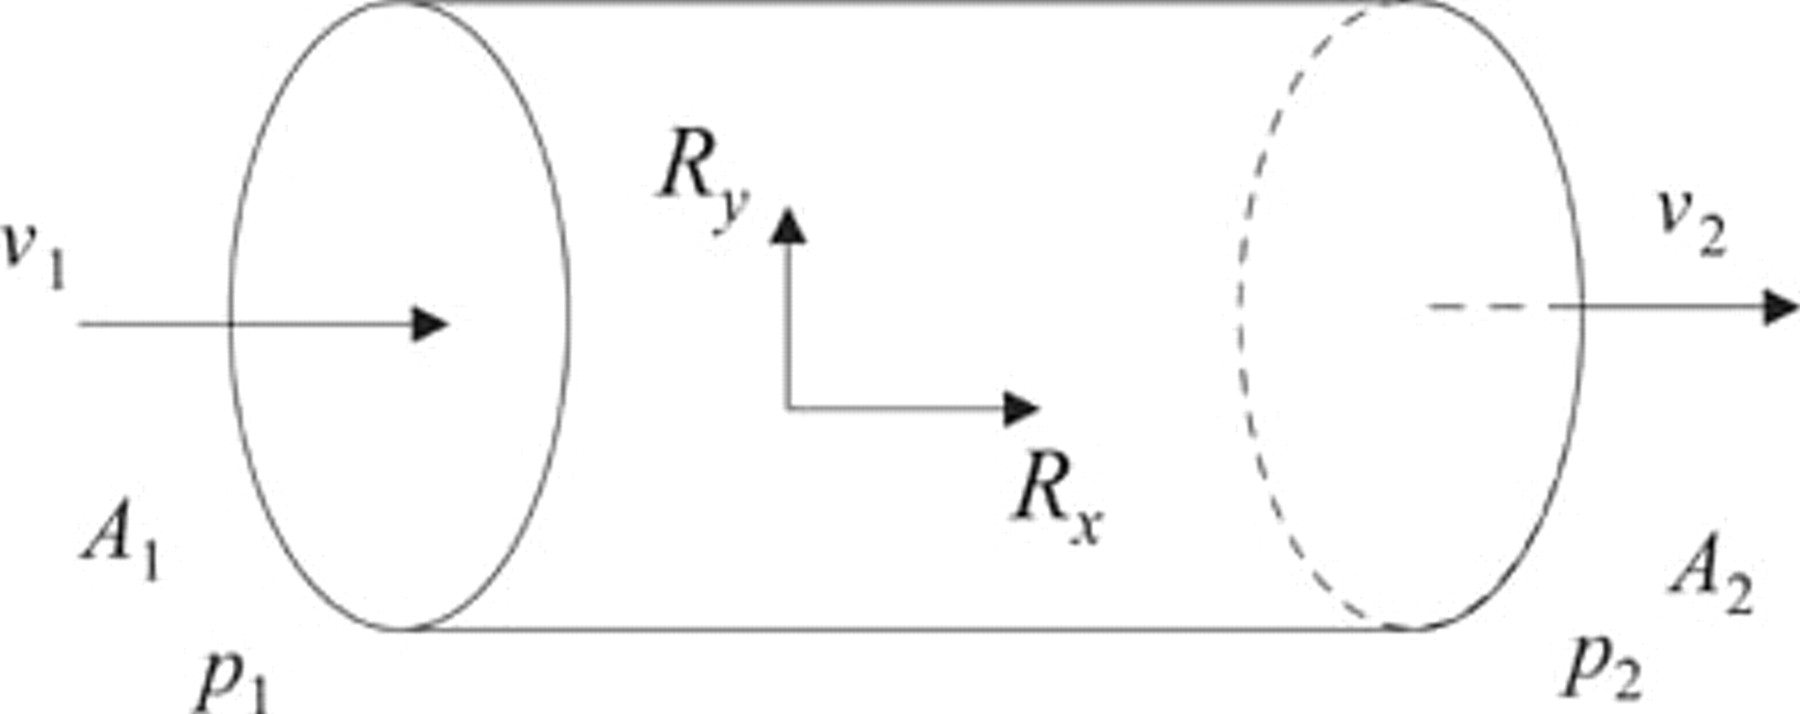
Case 1: Cylindrical Graft
For this case, the proximal inlet and the distal outlet areas (A 1 and A 2, respectively) are the same, so, by equation 8 (see Appendix 1), the inlet and outlet flow speeds (v 1 and v 2) are also equal. The inlet and outlet pressures (p 1 and p 2) are not equal owing to the frictional, shear interaction between the blood and the graft (ie, the head loss as given by equation 12). This frictional interaction causes the outlet pressure, p 2, to be less than the inlet pressure, p 1. This is called a pressure drop.
From all of this information, one can write down the restraint forces (R
x
and R
y
) on the graft. So, from equations 9 and 10,


Conclusion: Straight, noncompliant, cylindrical grafts are subject to a relatively small drag force in the direction of the flow.
Case 2: Windsock Graft
Suppose now we consider a graft in the shape of a windsock, such as in Figure 10. For this case, the inlet area is now larger than the outlet area, so, by equation 8, the outlet flow speed is greater than the inlet flow speed, as given by
An endoluminal graft in the shape of a windsock.
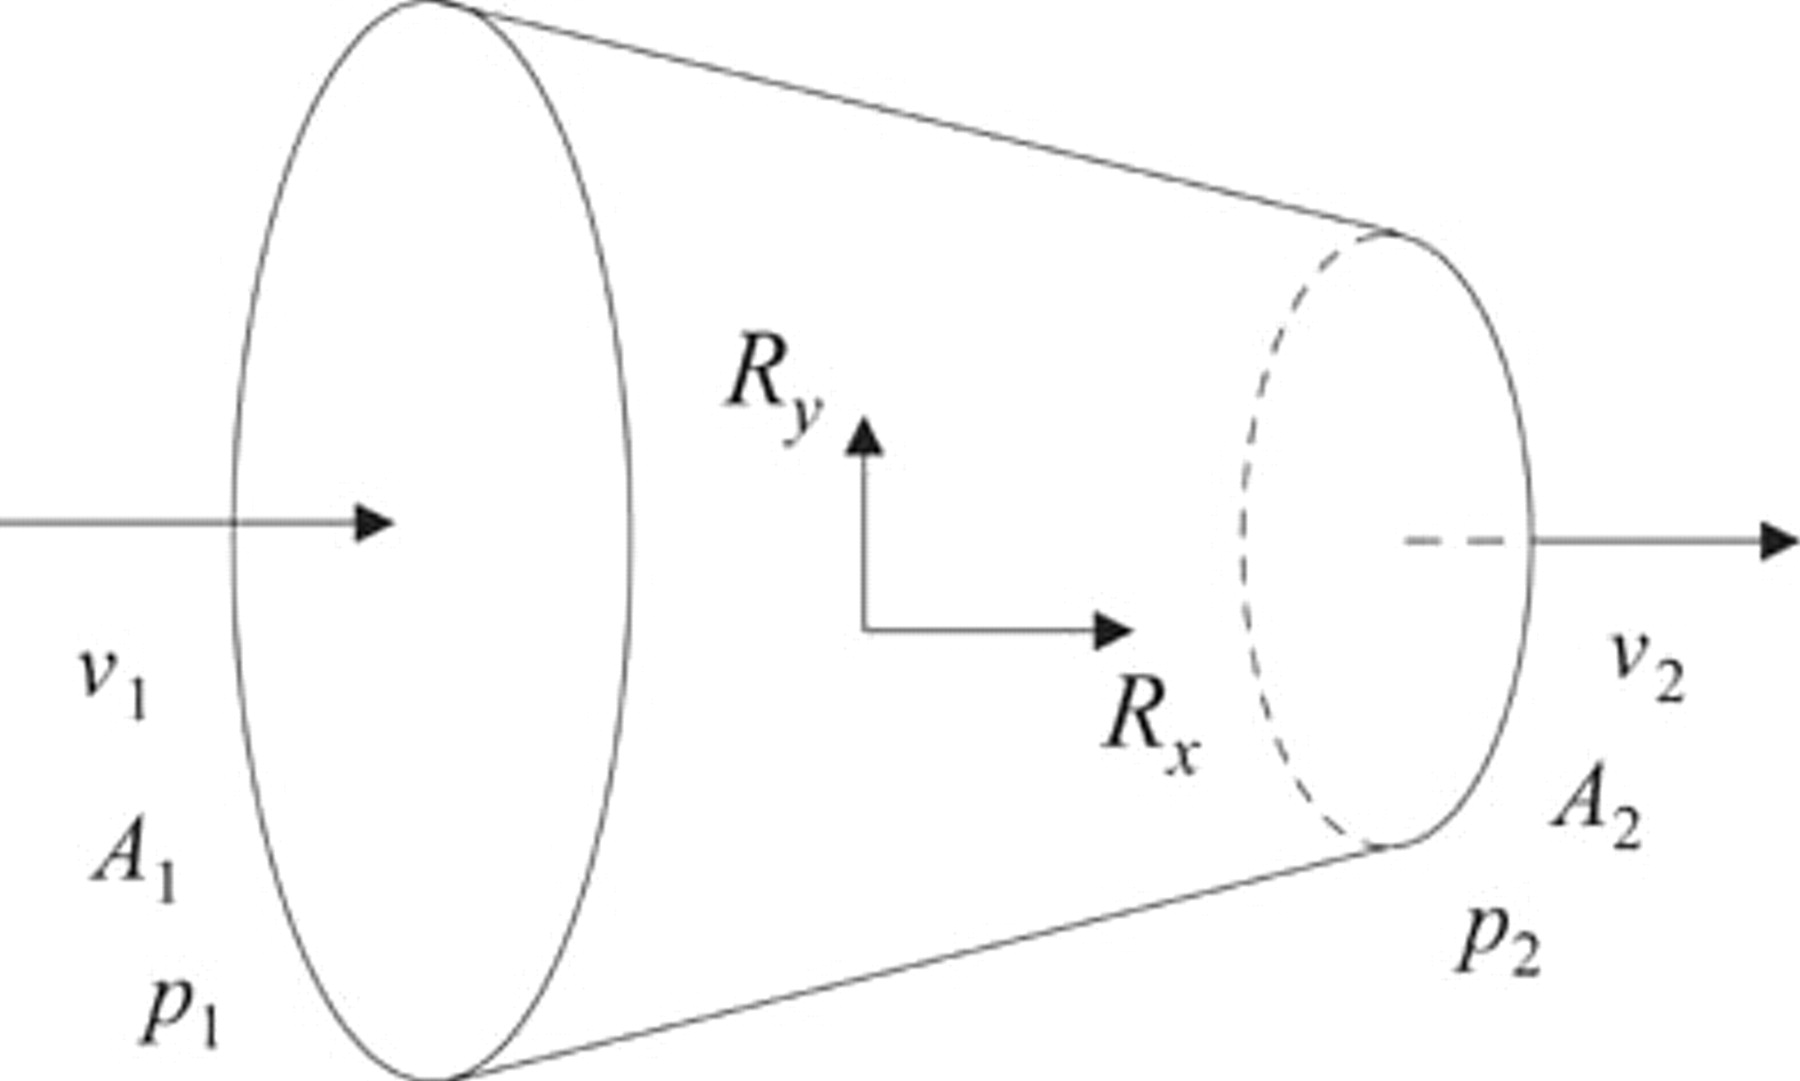
As in the previous case, the angles θ 1 and θ 2 are equal and have a value of 90°, and the inlet and outlet pressures are not equal owing to the frictional, shear interaction between the blood and the graft.
The restraint forces on the graft are from equations 9 and 10:

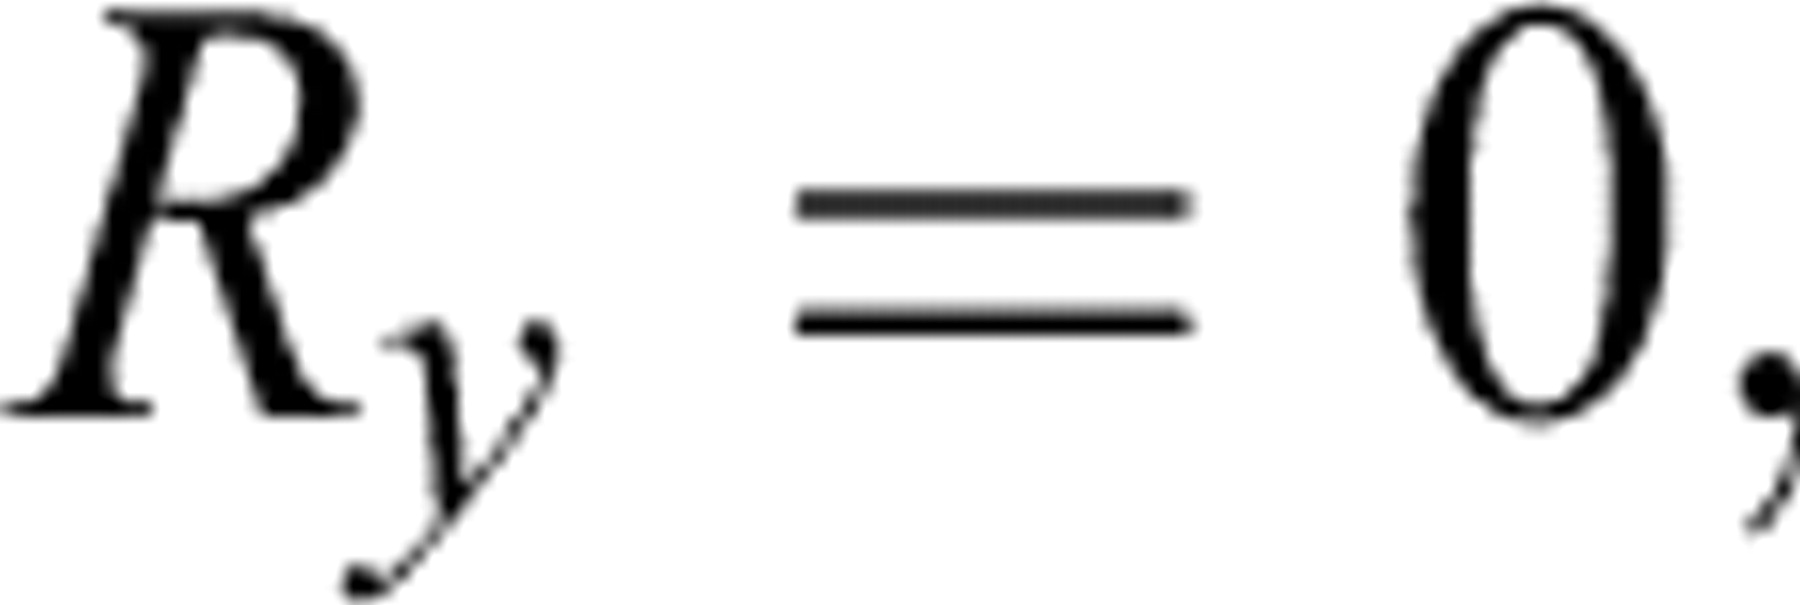
When you put the appropriate numbers into equation 4, it is found that the dominant term in this equation tends to be the p 1 A 1 term (more correctly, the important quantity is p 1 A 1 − p 2 A 2, but for realistic values of the inlet and outlet diameters, the dominant term is the p 1 A 1 term). That is, the inlet pressure and area tend to be the main influence on the graft force for this type of graft.
For example, suppose we had a single-tube graft with an inlet diameter of 26 mm and an outlet diameter of 12 mm, with an inlet pressure of 130 mm Hg and an inlet flow rate of 18 L/min. Then the inlet flow speed would be 0.565 m/s (calculated from the formula
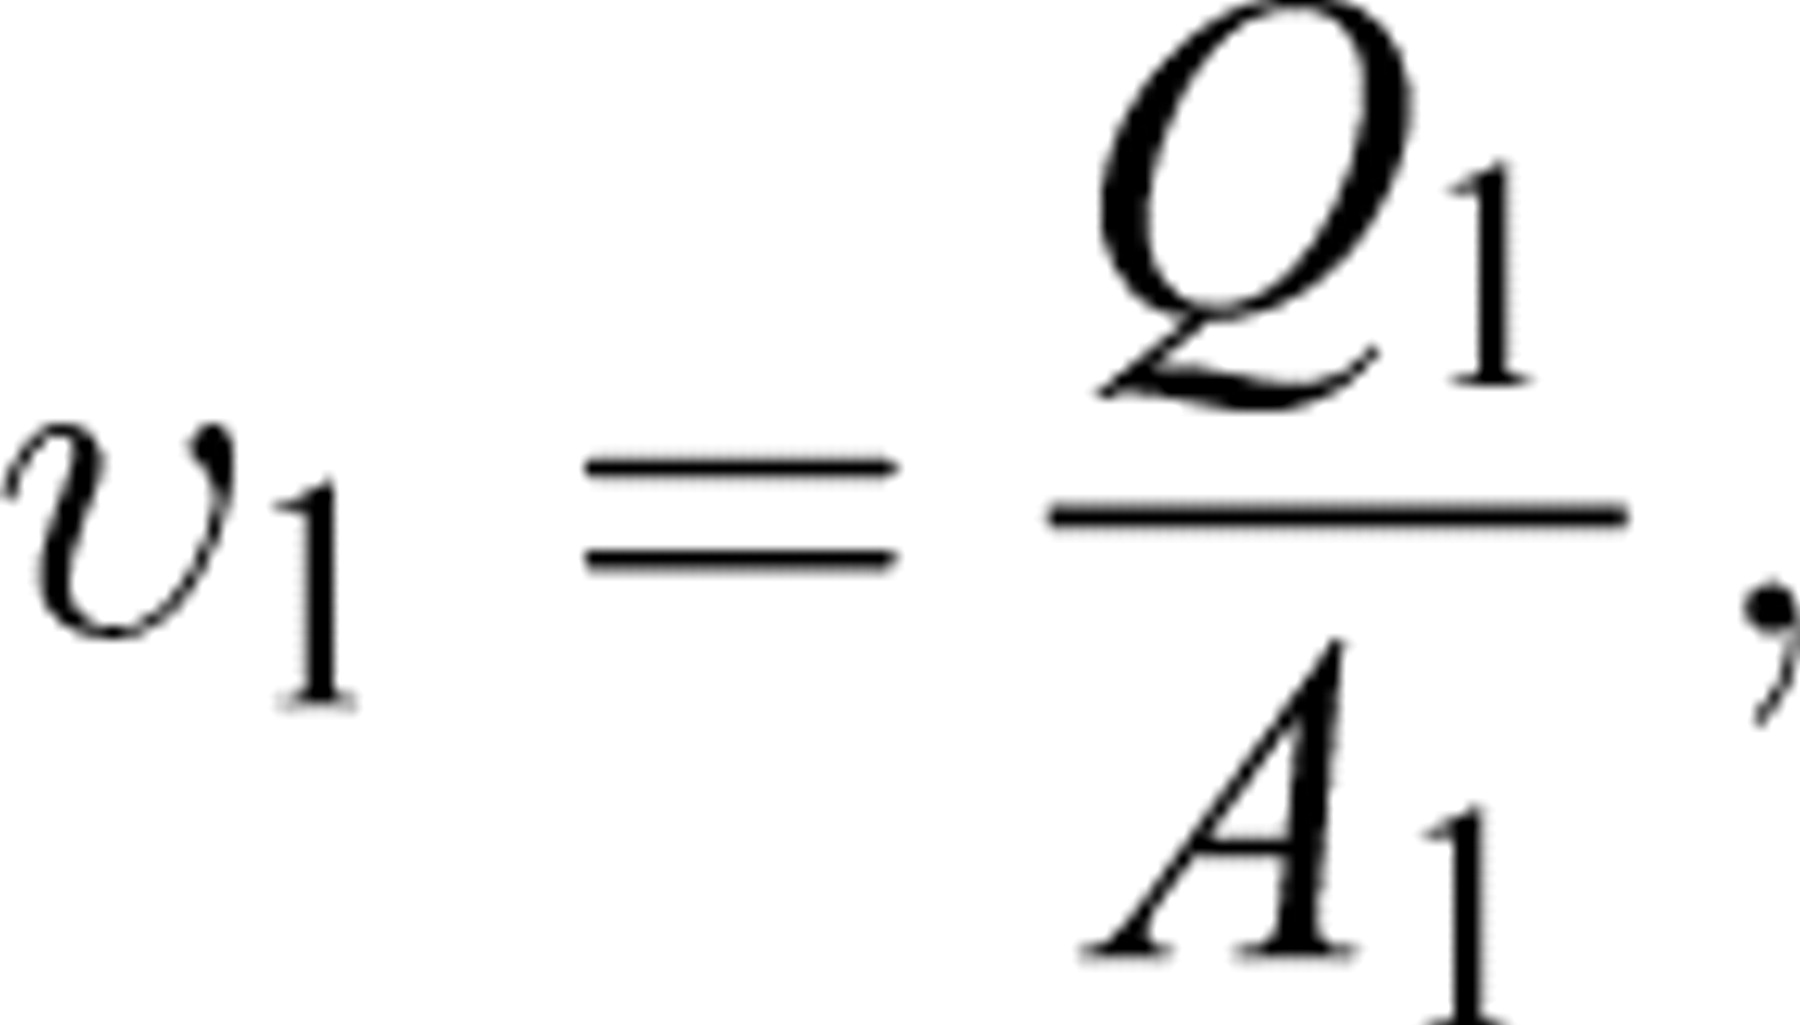
From equation 3, the outlet flow speed would be 2.65 m/s. Assuming a blood mass density of 1060 kg/m3, and using equation 13 to calculate the pressure at the outlet (p 2), the magnitudes of the terms in equation 4 are p 1 A 1 = 7.08 N, p 2 A 2 = 0.703 N, ρυ1 2A1 = 0.18 N, and ρυ2 2A2 = 0.84 N. As can be seen in this example, the p 1 A 1 term is the dominant term. Many endoluminal grafts have this windsock shape, in which the exit, distal area is significantly smaller than the proximal, inlet area.
Conclusion: The windsock shape can have a much larger drag force than a cylindrical graft.
Case 3: The Curved Graft
Suppose now we consider a curved graft, such as in Figure 11. As with the cylindrical graft, the inlet and the outlet areas are the same, so, by equation 8, the inlet and outlet flow speeds are also equal. Owing to the symmetry of the situation, the vertical restraint force is zero, and the horizontal restraint force is given by
A curved graft.
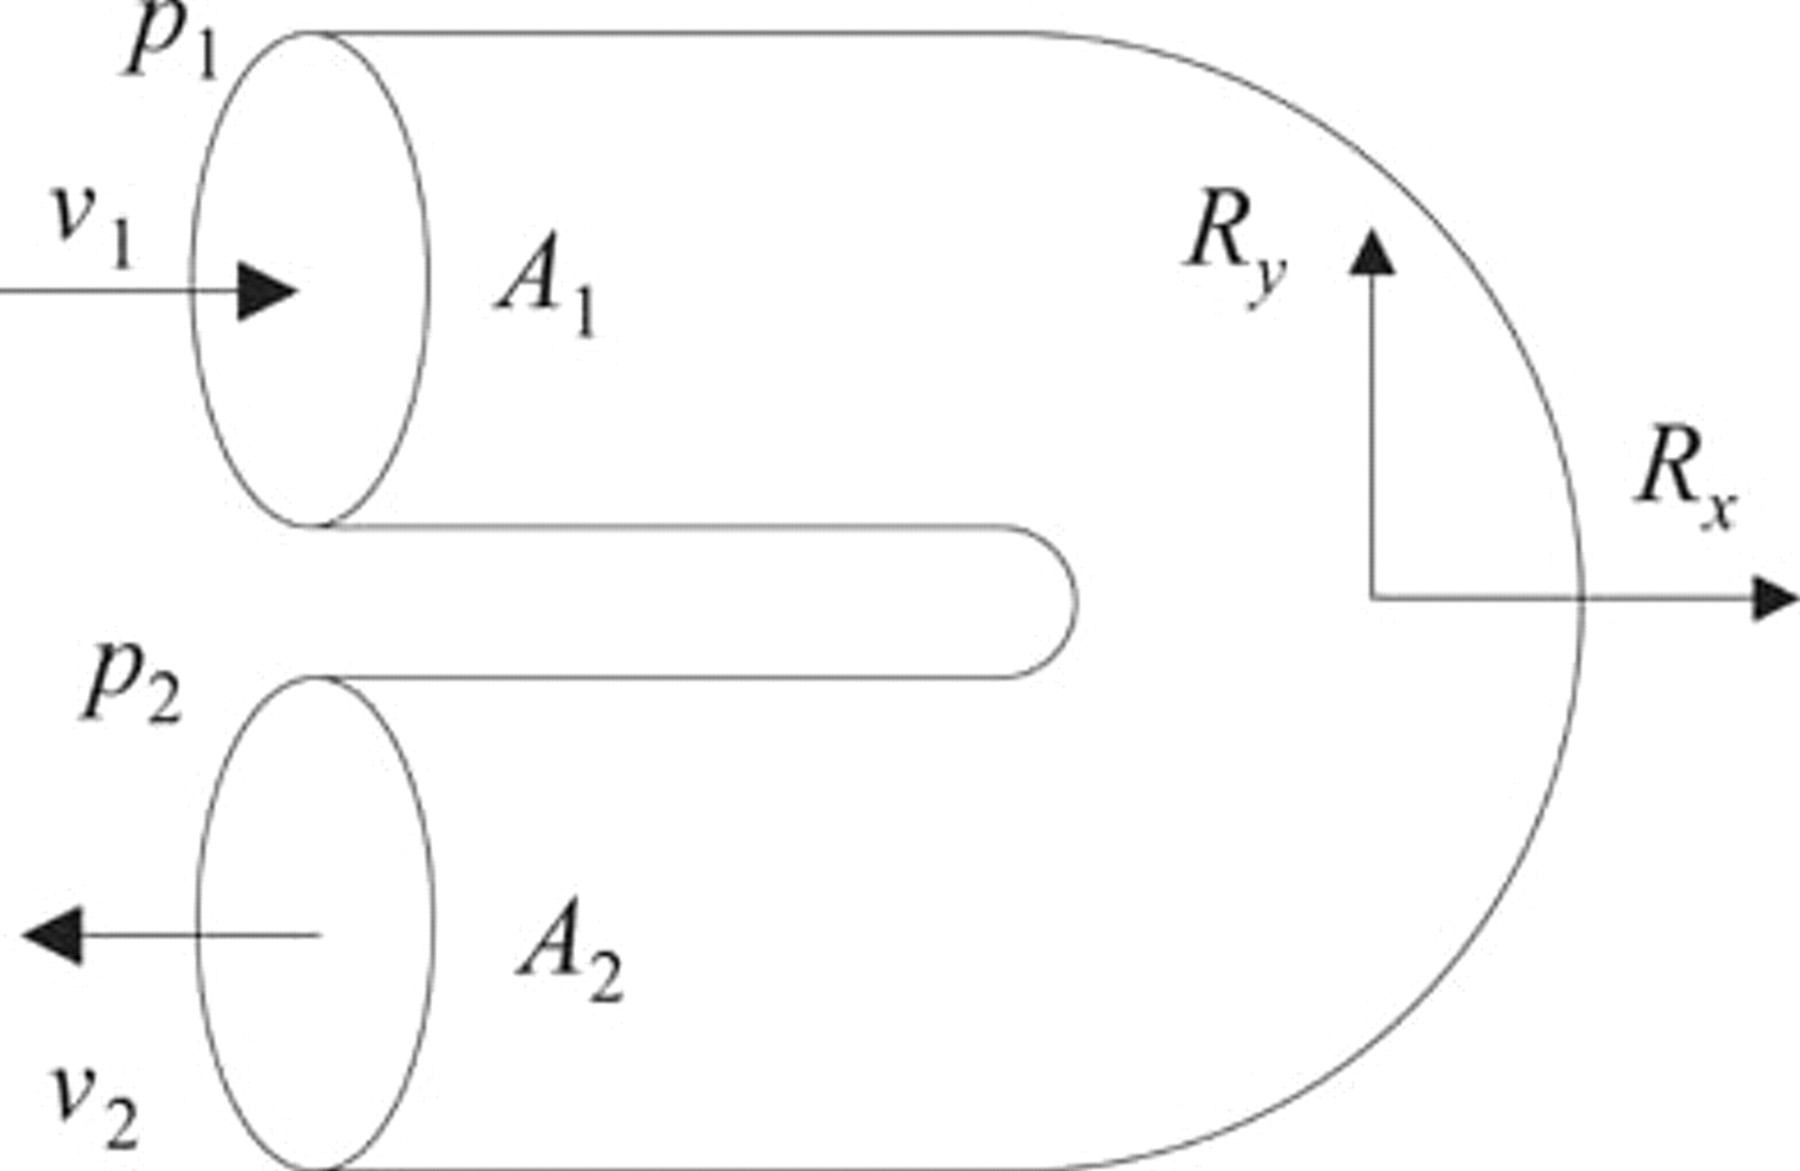
So now both the pressure and velocity components add together to produce a greater total force on the graft. This result suggests that a curved graft may be subject to greater forces than a windsock-shaped graft.
Conclusions
The effect of force on a model of a bifurcated, endoluminal graft was studied experimentally. It was shown that the force was strongly dependent on the upstream proximal pressure and was weakly dependent on flow rate. In the context of the simplifications and assumptions in the mathematical and experimental models, the experimental results suggest that the analytic force balance model 1,2 provides an accurate description of the forces on a planar, bifurcated graft.
It should be noted that we are investigating more sophisticated mathematical and experimental pulsatile models, which will more closely approximate the true clinical state. Nonetheless, the work in this article suggests that the force on a graft is strongly dependent on the inlet diameter (area) of the graft. A further analysis suggests that this behavior is due to the windsock shape of the graft.
Footnotes
Forces on a Single-Tube Graft System
To illustrate the steps used in determining the forces on a single-tube graft system, via analytic equations, we consider the steady flow of blood through a bent pipe (Figure 12). In this figure, the proximal inlet entrance is labeled 1 and the distal exit 2. D
1, A
1 and D
2, A
2 are the diameters and cross-sectional areas, respectively, of the graft at points 1 and 2. The vector normals of the cross-sectional areas are, respectively, at angles of θ
1 and θ
2 to the vertical. Similarly p and υ refer to the pressures and velocities at these points. R
x
and R
y
are the x and y components of the restoring force. The external pressure on the graft system is denoted by p
ex
.
The characteristic velocity, pressure, area, and force vectors required to compute the restraining forces on a bent single-tube graft system.
In our analysis, we assume steady-state, that is, nonpulsatile, flow. We do this for two reasons: first, it gives us a basic idea of how the system is behaving. Second, we are in the process of deriving and testing the appropriate equations for pulsatile flow, so it would be premature to release those results at this stage.
The first equation is the steady-state mass conservation equation, which basically states that what flows into the graft must come out of the graft. This equation has the form
Mass conservation, as expressed in equation 8, implies that if the area of the outlet, A 2, is less than the area of the inlet, A 1, then the flow speed from the proximal outlet, υ 2, will be greater than the inlet flow speed, υ 1. One should note that υ 1 and υ 2 are average flow speeds, where the average is taken over the areas of A 1 and A 2, respectively.
The next analysis tool at our disposal is the momentum conservation equation, which can be expressed in the form
An interesting point about the above equations is that they compute the force on the graft, but the length of the graft does not explicitly enter into the equations. Only the pressure and flow of blood through the faces of the graft are explicitly shown. This is because we have assumed steady-state flow. If we had assumed pulsatile flow, then the equations would be the same, except there would be an extra term, which does include the length of the graft. The relative magnitude of this pulsatile term is still under investigation and is not discussed here.
Energy is the final conserved quantity that we can use in our analysis. The energy conservation equation has the form
Forces on a Symmetric,Bifurcated Graft
We consider the symmetric, bifurcated graft shown in Figure 13 (the more general, nonsymmetric case is described elsewhere
1
). Fluid enters the proximal end of the graft, which we label 1, and exits via the distal ends, 2 and 3. The velocities, υ, and pressures, p, of the blood are shown, as are the areas, A, of the different ends of the pipe. The two outlet legs of the graft are symmetric and are at an angle α to the horizontal. R is the restraint force required to keep the graft in position and is given by the formula
1,2
Symmetric, bifurcated graft system.