
Abstract
The objective of this study was to measure the pulsatile forces acting on a symmetric, bifurcated endoluminal stent graft to validate a computational fluid dynamics (CFD) and analytic model so that they can be used for various graft dimensions. We used a load cell to measure the force owing to the movement of an acrylic model of a bifurcated stent graft under pulsatile flow. This was then simulated with a CFD and analytic model. The main features of the experimental pulsatile force data and the CFD results were consistent. The results showed that the total force was proportional to the inlet pressure cycle. The force rose from 3.32 N at 130 mm Hg systolic to 17.5 N at 250 mm Hg systolic pressure. For the more variable regions of the flow, the experimentally measured forces lagged the computational and analytic results. The CFD and analytic models provide approximate descriptions for the forces acting on a bifurcated stent graft subjected to pulsatile flow. Such models should be of assistance to designers of endoluminal stent grafts.
Keywords
The present surgical options for abdominal aortic aneurysms (AAAs) are either open replacement or endoluminal repair. In the past, standard surgery for AAA used the open replacement with a Dacron graft. This was found to be a durable solution, but it involves a fairly significant operation with potentially high blood loss, high physiologic stress, and long recovery times. Endoluminal repair requires a shorter, less severe operation with endografting resulting in improved early outcomes compared with open surgery and potentially better results in the long term but also higher costs. 1
A 20% reintervention rate for endovascular repair is consistently reported in the literature. 2 This is a major criticism of endovascular repair and is associated with the costs of postoperative surveillance and secondary procedures. Optimizing graft design requires understanding of the dynamics for long-term graft efficacy and durability and serves to reduce the reintervention rate. A reduction in the reintervention rate may make the procedure more cost-effective.
Much of the reintervention is of a minor nature. Major concerns with endovascular repair are migration and endoleak, which lead to repressurization of the aneurysm, and these are the reasons for long-term surveillance. These problems occur in the region of 10% of cases in the lifetime of current stent grafts. Typically, bifurcated stent grafts are used for the endovascular repair of AAAs. For complex aortic repair, the endovascular graft is made of modular components for practical reasons. As excessive force may dislodge a graft, it is desirable to understand the magnitude of the forces acting on bifurcated endoluminal grafts in a pressurized aorta. Knowing the forces on grafts for given pressures, flow rates, and configurations is important for graft design, use, prognosis, and follow-up. 3–5 For example, a modular graft designed to preserve the mesenteric and renal vessels will typically have a tube component in this region of the aorta and a second module with a bifurcated configuration to carry the blood through to the iliac system. Migration of the bifurcated component within the tubular proximal component does not lead to life-threatening complications until there is complete separation. In this example, the separate components serve to allow separate orientation and to remove the drag force from the component supplying the essential vessels. A better understanding of the disruptive forces acting on the device and its modular joint areas provides the base information for joint design for the modules. Designers need to ensure that the drive to minimize stent graft size for delivery purposes is not compromising the force that must be maintained for 10 years, including fatigue factors and peak requirements.
Previous experimental studies on measuring forces on grafts in real arteries without fluid found that the median displacement force required to extract stent grafts was typically 2.5 to 4.5 N, but the displacement force increased considerably when hooks and barbs were attached to the graft. 6–8 In vitro experiments have measured the pull-out forces under steady-state conditions 9 and pressures under pulsatile conditions 10 required to separate modular grafts and the peak displacement forces of stent grafts under pulsatile conditions. 11,12 Forces on bifurcated endoluminal stent grafts have been measured under steady-state 13 and pulsatile conditions. 14
Most previous investigations on predicting forces on grafts used analytic modeling 15–17 and computational fluid dynamics (CFD) modeling. 18–24 The simple analytic models have been based on the assumption of steady-state flow because it is easier to solve the steady-state, that is, nonpulsatile, form of the momentum equations. 15,16 This steady-state analytic force model is now used in the design of stent grafts and has been validated for a bifurcated endoluminal graft under steady-state 13 and pulsatile 14 flow conditions.
In this article, we have experimentally measured the effect of pulsatile pressure and flow rate on the forces acting on a model of a bifurcated endoluminal stent graft and modeled this situation by using CFD to validate and determine the accuracy of the predictions from the CFD and an analytic model.
Methods
Experimental Model
Force measurements were carried out on an acrylic model of a symmetric, bifurcated endoluminal graft (Figure 1), whose inlet and outlet diameters were selected as representative values for current endoluminal (AAA) grafts. A rigid acrylic model was selected in preference to a soft, silicone rubber model because the acrylic model was easier to use experimentally and analyze mathematically.
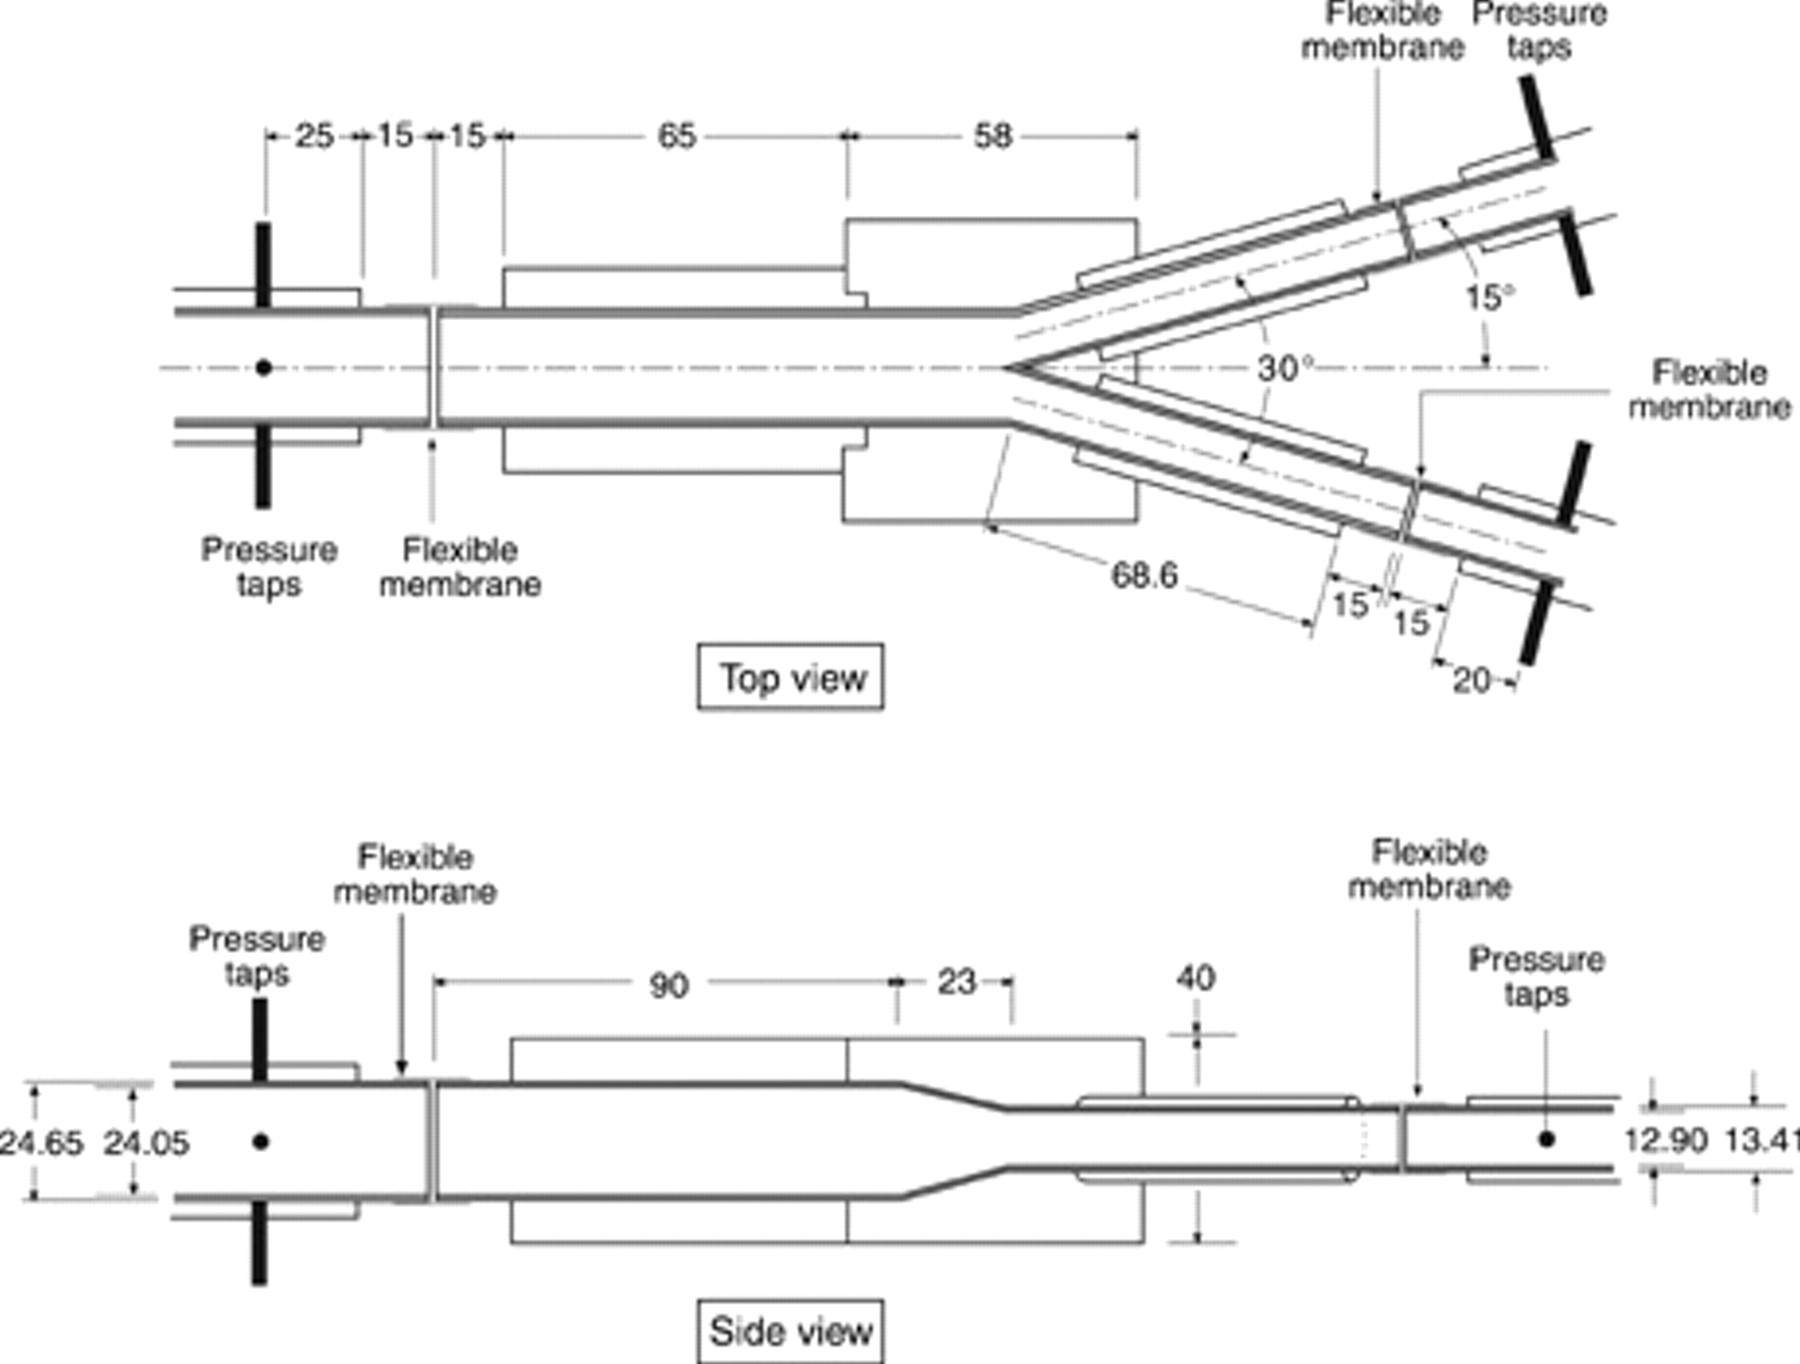
Close-up of the model of a bifurcated endoluminal graft (all dimensions are in millimeters).
An overall view of the bifurcated endoluminal graft model supported by a load cell is shown in Figure 2. The graft model was connected with flexible rubber membranes to the inlet and outlet piping to allow the model to move. The graft model was suspended via a metal support to a load cell that measured the movement of the graft, and this was converted into a force.
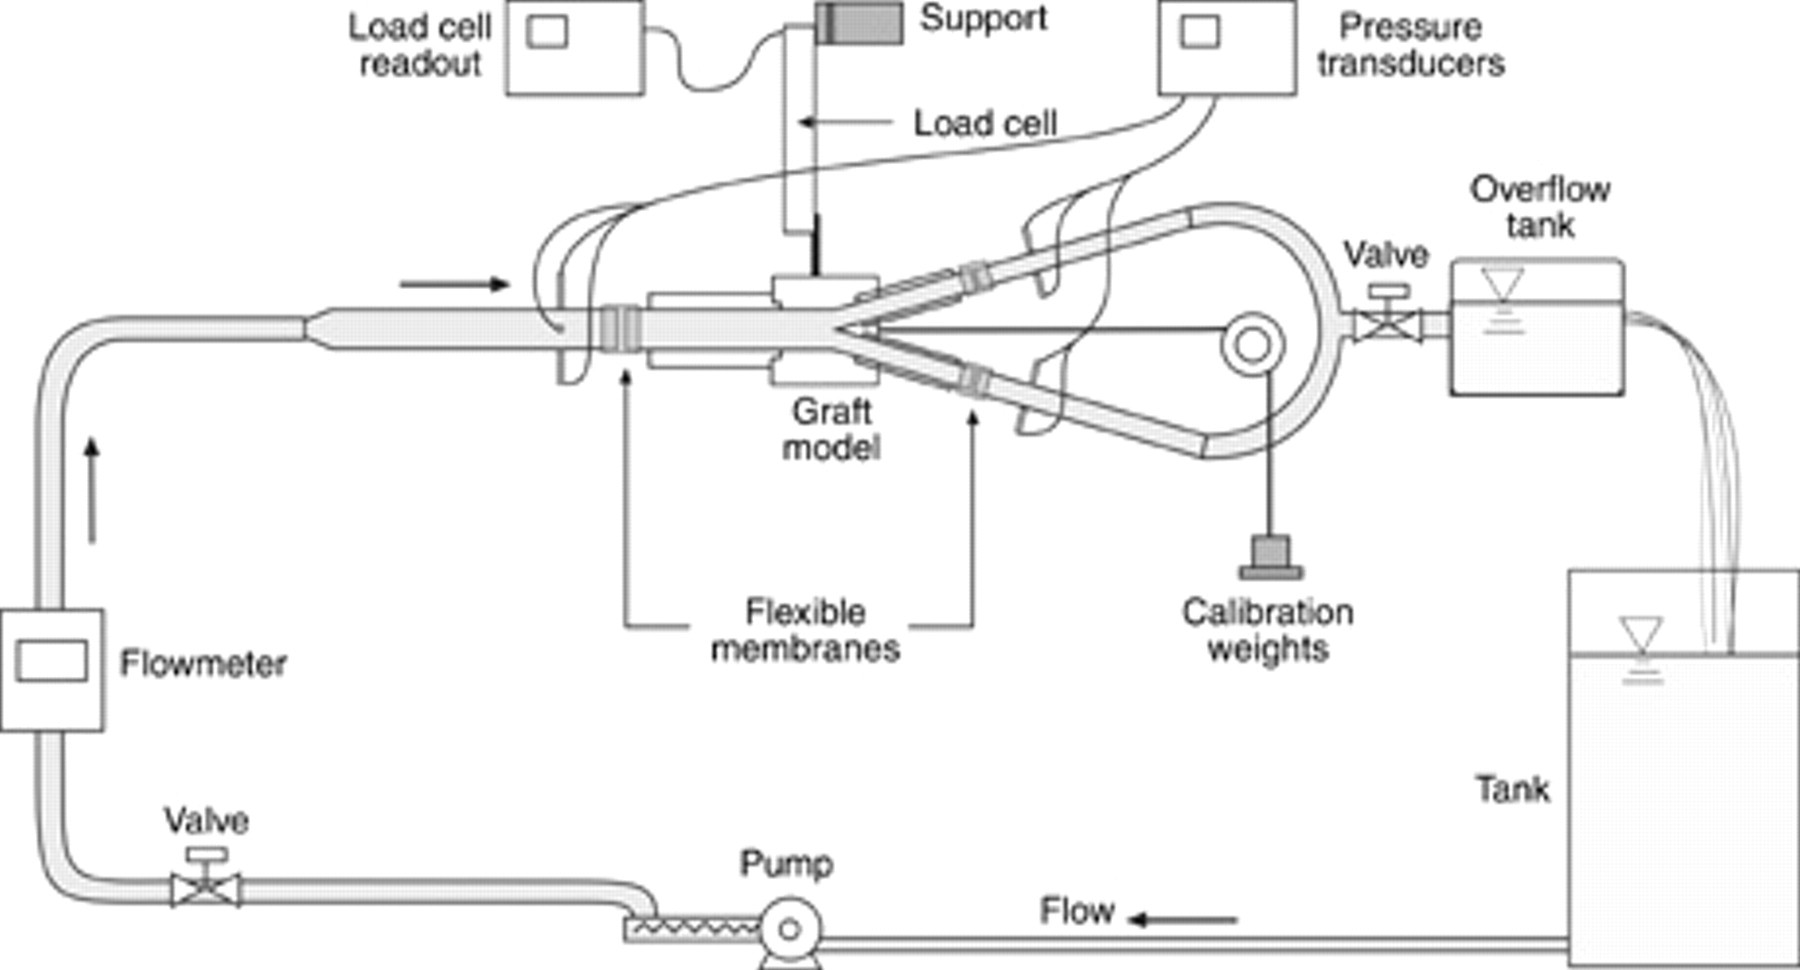
Overall view of the experimental model of a bifurcated endoluminal graft supported by a load cell.
The dimensions of the model were chosen to represent a typical stent graft for an infrarenal aorta based on a mean size of 21.4 mm + 12%. 25 The internal diameters of the graft inlet and outlets plus the flexible membranes (for an unpressurized system) are 24.05 mm for the proximal inlet side and 12.9 mm for the distal outlet sides (see Figure 1). The angle between the two symmetric distal graft legs was 30°. We have shown in previous work using this rig for steady-state flow that the graft force appears to be sensitive to the inlet and outlet graft diameters, 13 so we constrained the flexible membranes by external straps to ensure that the diameters of the membranes remained constant.
Pulsatile flow was produced by a Commonwealth Scientific and Industrial Research Organisation (CSIRO)-designed and -manufactured, computer-controlled pulsatile pump. The pump can produce various pulsatile flow profiles, from steady-state flow to human-like aortic flow. For experimental convenience, a glycerol-water mix solution was chosen as the working fluid with a viscosity of 0.0043 Pa s, which is similar to the viscosity of blood flowing through the aorta. 26
The systolic and diastolic pressures had an approximate value of 130 mm Hg and 80 mm Hg, respectively. The appropriate mean pressure was set by having a head tank at an appropriate height. The systolic speed of the fluid going into the graft had an approximate peak value of 0.62 m/s (16.6 L/min), and the mean flow rate was set at 5 L/min.
The graft was oriented horizontally so that the weight force on the graft could be ignored. The horizontal orientation is approximately equivalent to the case when a patient is lying down. The load cell (Precision Transducers Limited PT1000, Auckland, New Zealand) had a maximum rating of 30 N and was driven by an Analog Process Control Services WT127 Strain Gauge Transmitter (Sydney, Australia). The load cell was calibrated in situ by means of known weights. The rig was calibrated while it was full of a glycerol-water mix solution to eliminate any effect of the weight of the solution on the load cell output.
There were three measured quantities: pressure, flow rate, and force from the load cell. The pressure transducers (P26C, Honeywell, Phoenix, AZ) were calibrated against a Druck DPI 610 pressure transducer (GE Sensing, Billerica, MA) with a calibration certificate that had an error of less than ± 0.6 mm Hg. After calibration, the Honeywell pressure transducers were checked against the Druck DPI 610 pressure transducer at the start of each experiment and were found to be within 0.6 mm Hg. The model was arranged such that the outflow was at the same height as the rig and the pressure transducer so that no correction was needed for a slope-induced pressure “head.”
The magnetic flowmeter (ABB Automation Products GmbH, ABB Model DS41F, Göttingen, Germany) flow rate was checked against a bucket and stopwatch technique and was found to be within 0.1% of the reading on the flowmeter. This relative error is consistent with the manufacturer's claimed relative error of ± 0.1%. Again, for the purposes of this article, such an error is small enough to be ignored.
Finally, we checked the load cell–graft system by subjecting the load cell to a known horizontal force. The load cell was calibrated in situ by means of known weights suspended by cord lines over pulleys that minimized friction with the change in direction. When an individual measurement was carried out quickly and there were no changes in offset, the error for the load cell when compared with known weights was only ± 0.007 N. But the offsets on individual calibration curves changed depending on the weights applied and time period they were applied, whereas the slope stayed the same. When we took into account the changes in the offset owing to hysteresis of the rubber membrane sleeves, the error increased up to ± 0.1 N. For quick graft movement under pulsatile flow, there was a lag owing to the flexible membrane.
CFD Model
To compute the forces on the symmetric bifurcated stent graft, the CFD program ANSYS CFX 11 (ANSYS Inc., Canonsburg, PA) was used. The flow was assumed to be incompressible and Newtonian, which was modeled by the Navier-Stokes equations. ANSYS CFX 11 solves the model equations using a multigrid finite-element method. The high-order advection scheme was used in the simulations. The computational domain of the simulated bifurcated graft was based on the dimensions of the model used in the experiment. As such, the domain was composed of a cylinder with a diameter of 24.05 mm, which represented the main body of the graft. The graft legs were modeled using two small cylinders with diameters of 12.9 mm and some transitional sections connecting the body to the legs. The lengths of the body and legs were 90 mm and 84 mm, respectively. The axial dimension of the transitional section was 23 mm. The computational domain consisted of 272,667 grid elements (Figure 3). Grid refinement was applied where possible near the graft walls. Grid independence was checked and confirmed by varying the grid size.
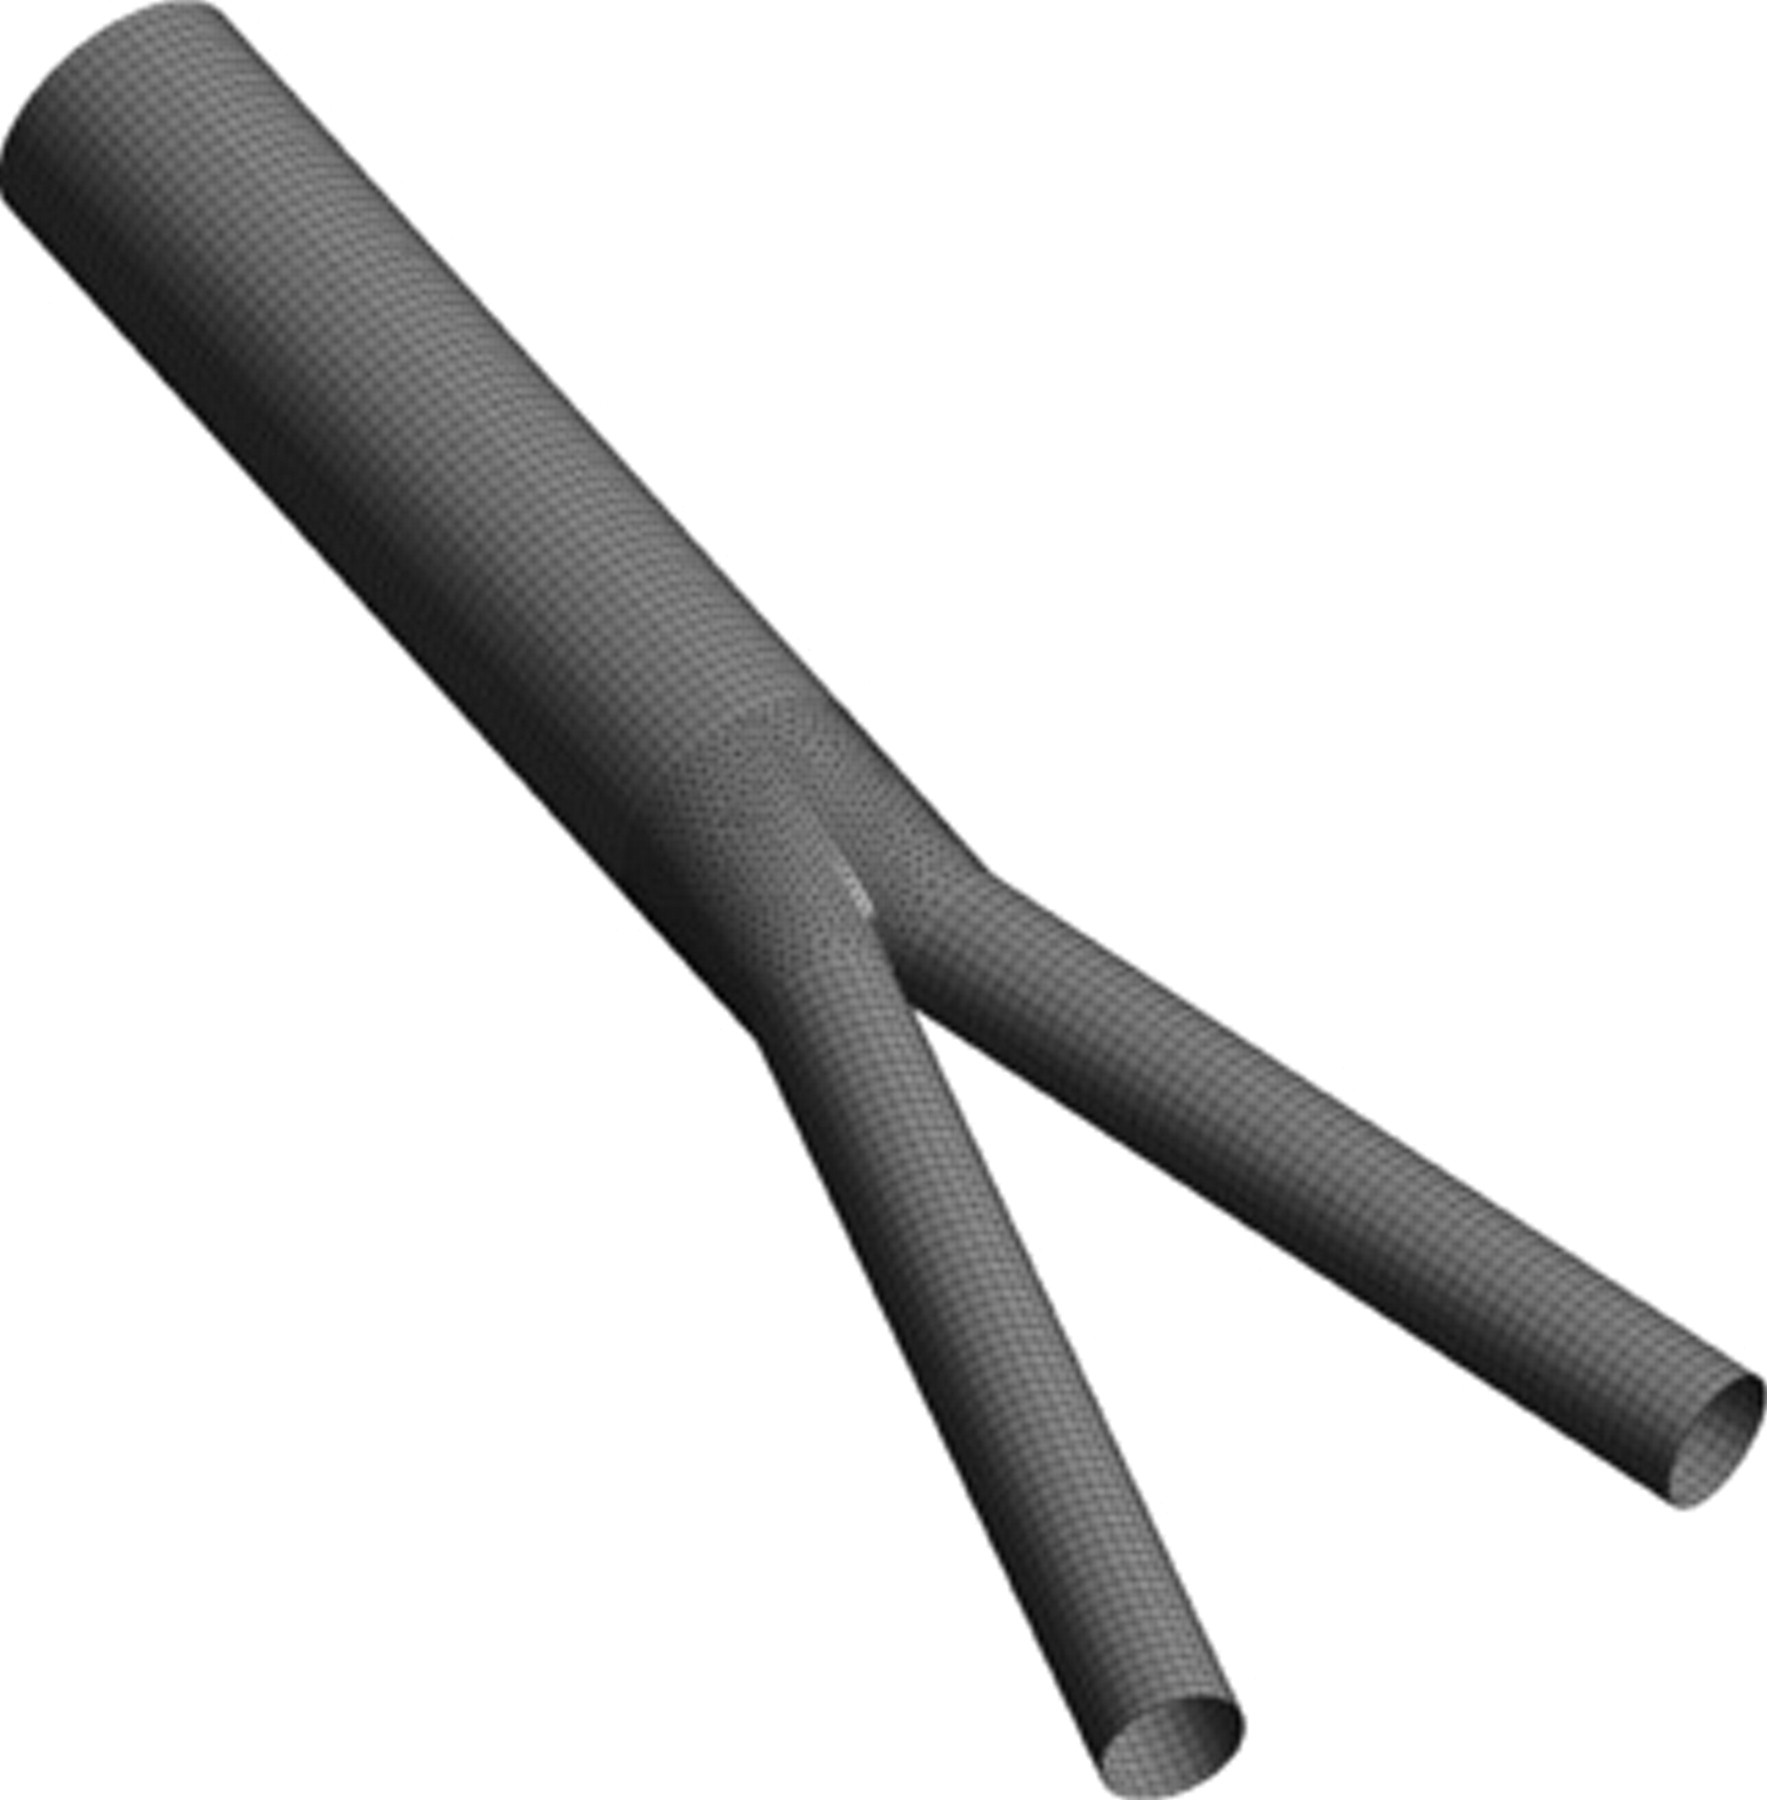
The computational grid of the symmetric, bifurcated endoluminal stent graft model.
A parabolic velocity profile was applied to the inlet flow of the graft, and an “opening” boundary condition was applied at the outlets. The opening boundary condition allows for full or partial flow reversing at those boundaries. In other words, it is a free boundary condition, where the flow is left unspecified and is derived from solving the Navier-Stokes equation. For pulsatile flow, the inlet volume flow rate is time dependent and was approximated by a curve fit of the measured flow rate of the water-glycerol working fluid into the physical bifurcated graft model. Figure 4 compares the curve fit with the measured velocity waveform. The velocity waveform is approximately modeled on measured waveforms given in the literature. 27,28
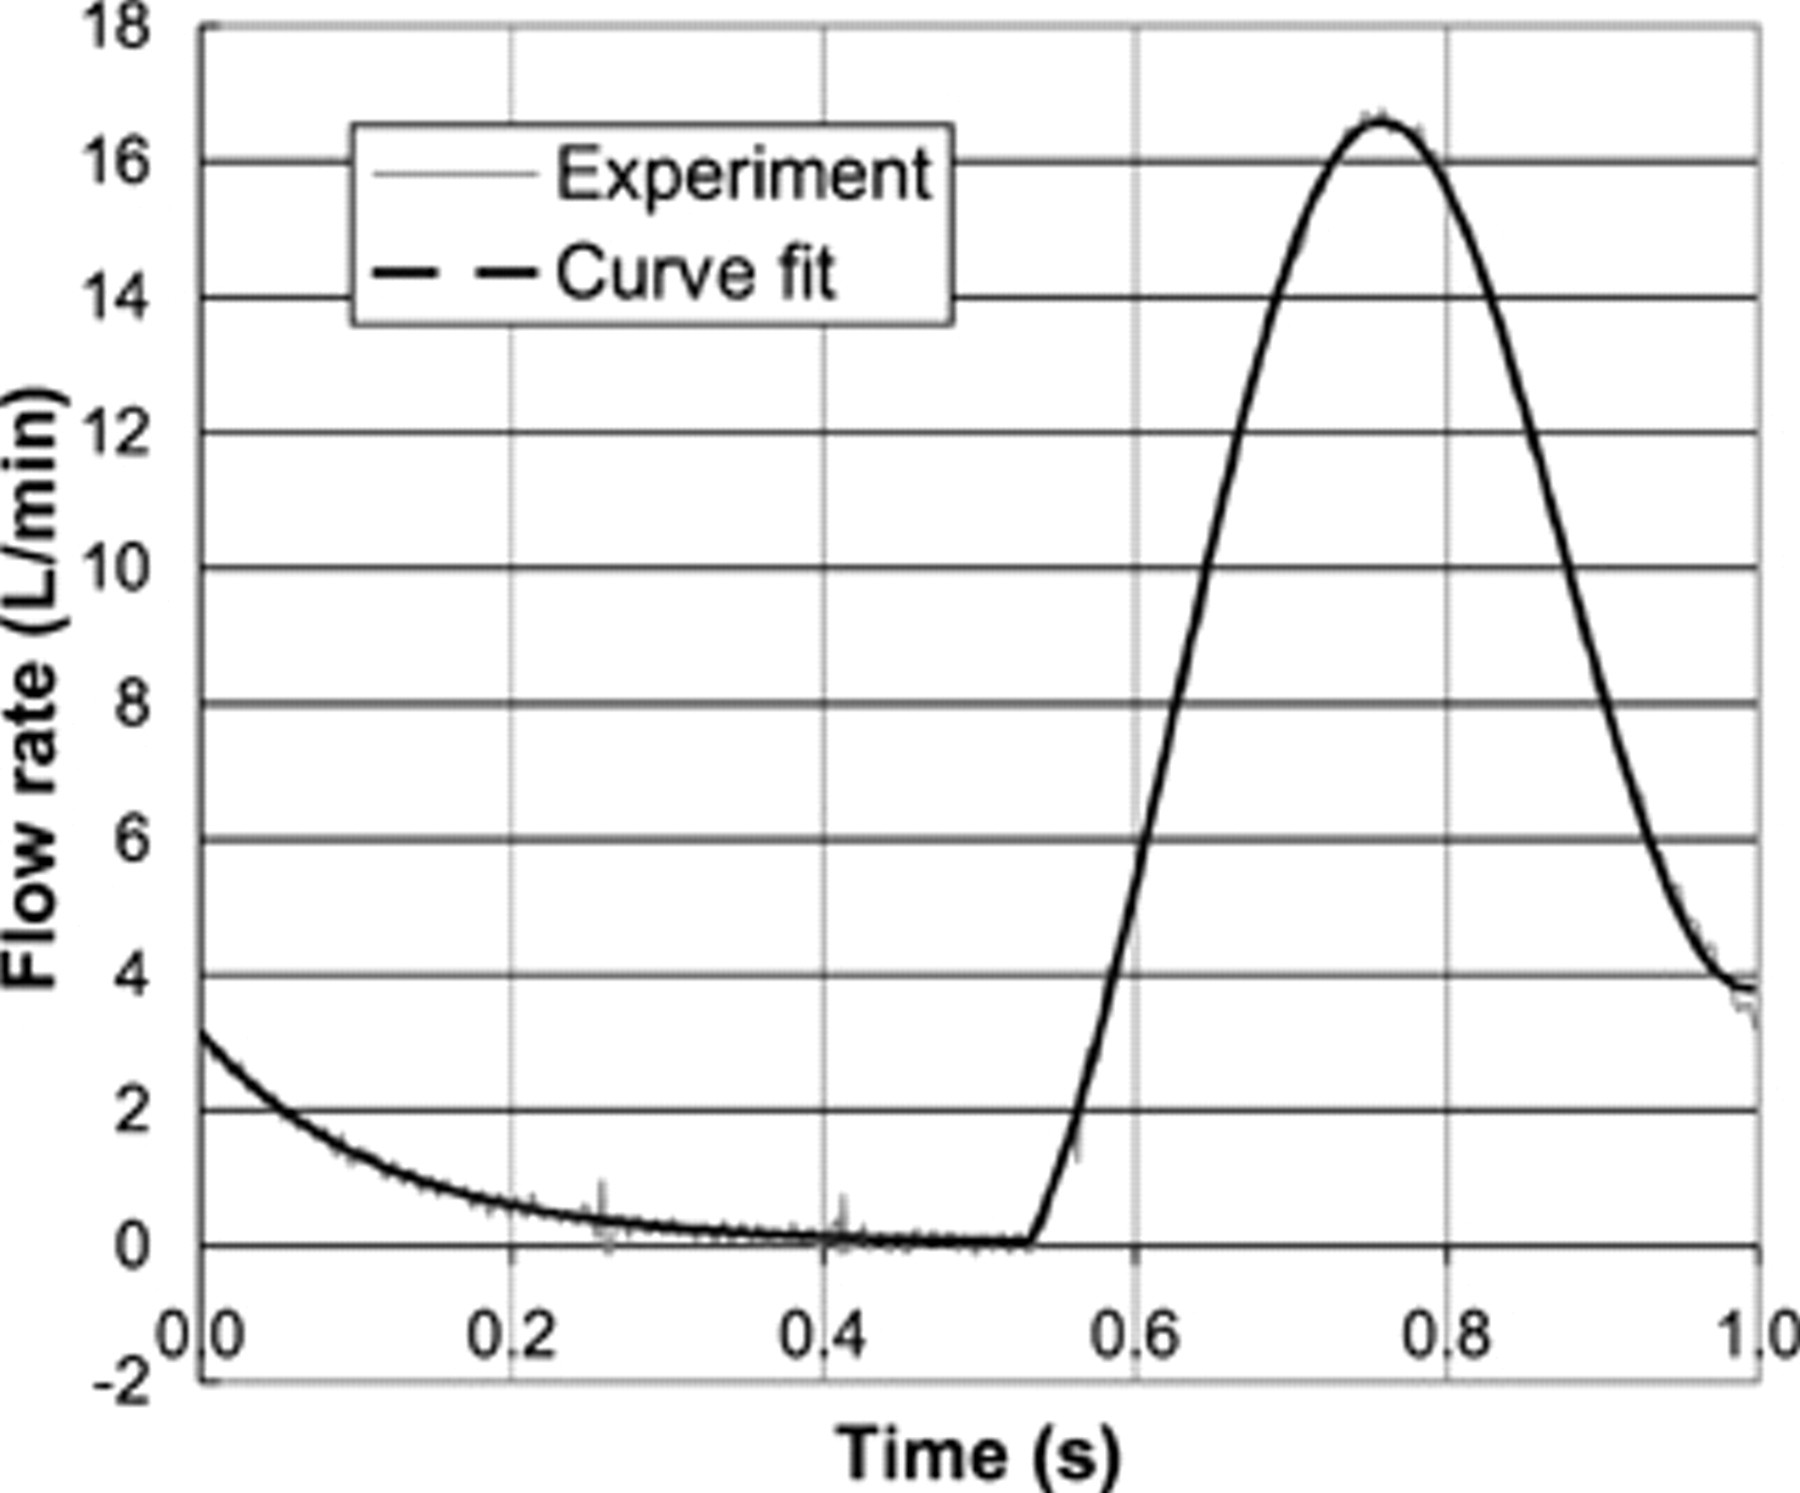
Experimentally measured flow rate curve during one pulse cycle.
The measured outlet pressures from the physical bifurcated graft model shown in Figure 5 were also applied to the CFD model. For most parts of the pulse, the outlet pressure is slightly lower than the inlet pressure, which indicates a small pressure drop through the bifurcated graft model. The pulsatile pressure varied in magnitude from a diastolic value of 80 mm Hg to a systolic value of 130 mm Hg.
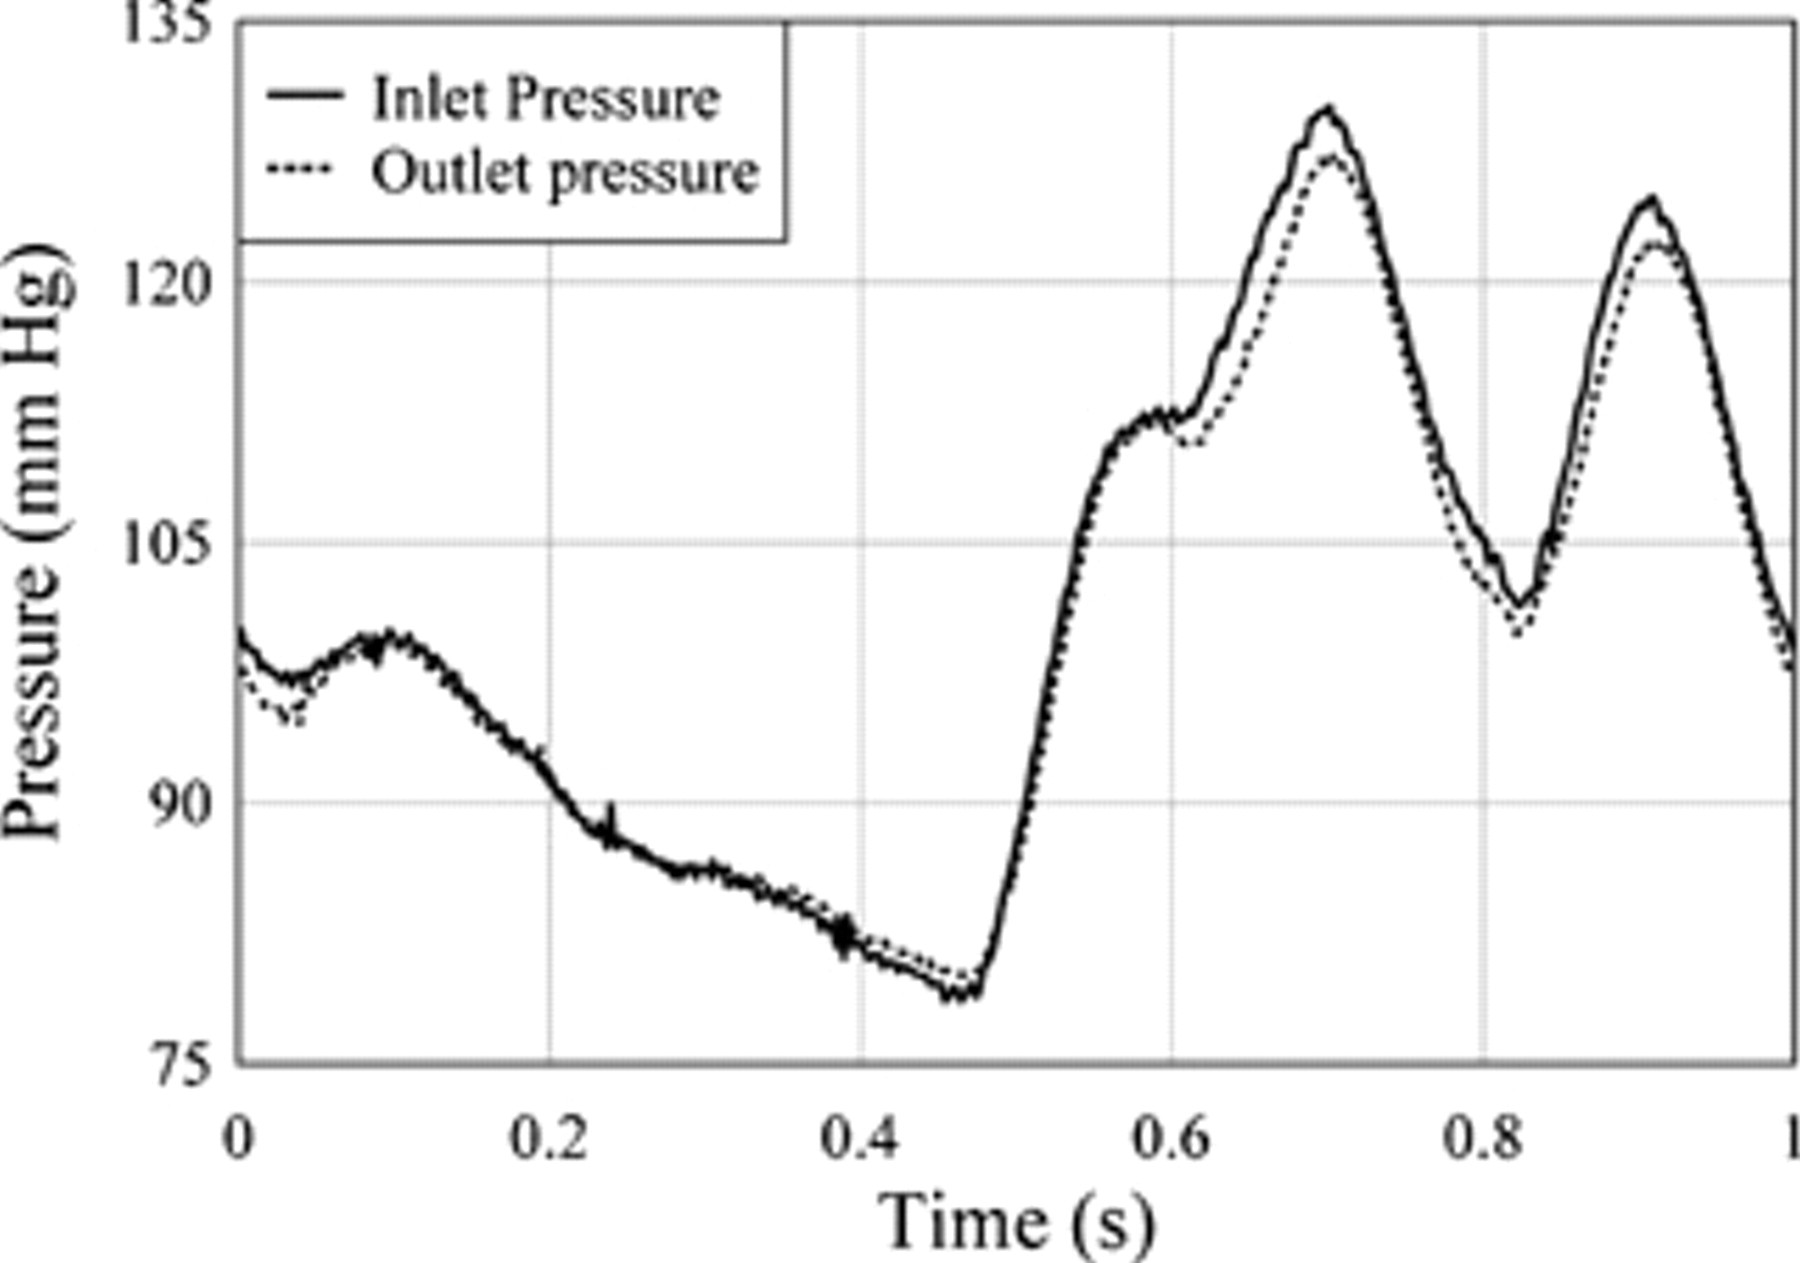
Experimental pulsatile pressure curve during one pulse cycle.
The double peak in the pressure pulse was due to a pressure oscillation probably caused by the hard acrylic, bifurcated graft model within the flow circuit and was not due to the pulsatile pump. The double peak did not occur when we used standard, more flexible, endoluminal grafts. Despite the double-pressure peak, the hard acrylic model was used in preference to a standard endoluminal graft because it was much easier to connect a load cell to the acrylic model.
As the peak Reynolds number in the graft model was approximately 3,700, the flow was considered laminar, and no turbulence model was used. For this problem, the Womersley number was estimated to be about 15 for the proximal inlet and 8 for the distal outlets.
Additional CFD modeling runs were carried out for high-pressure and -flow rate conditions for a pulsatile pressure that varied in magnitude from a diastolic value of 90 mm Hg to a systolic value of 250 mm Hg, as shown in Figure 6. The average flow rate was 10.4 L/min, and in the high-flow rate regions of the flow curve, there was turbulent flow. Hence, for the high-pressure and -flow rate runs, the k-e turbulence model was used in the CFD model to simulate turbulence.
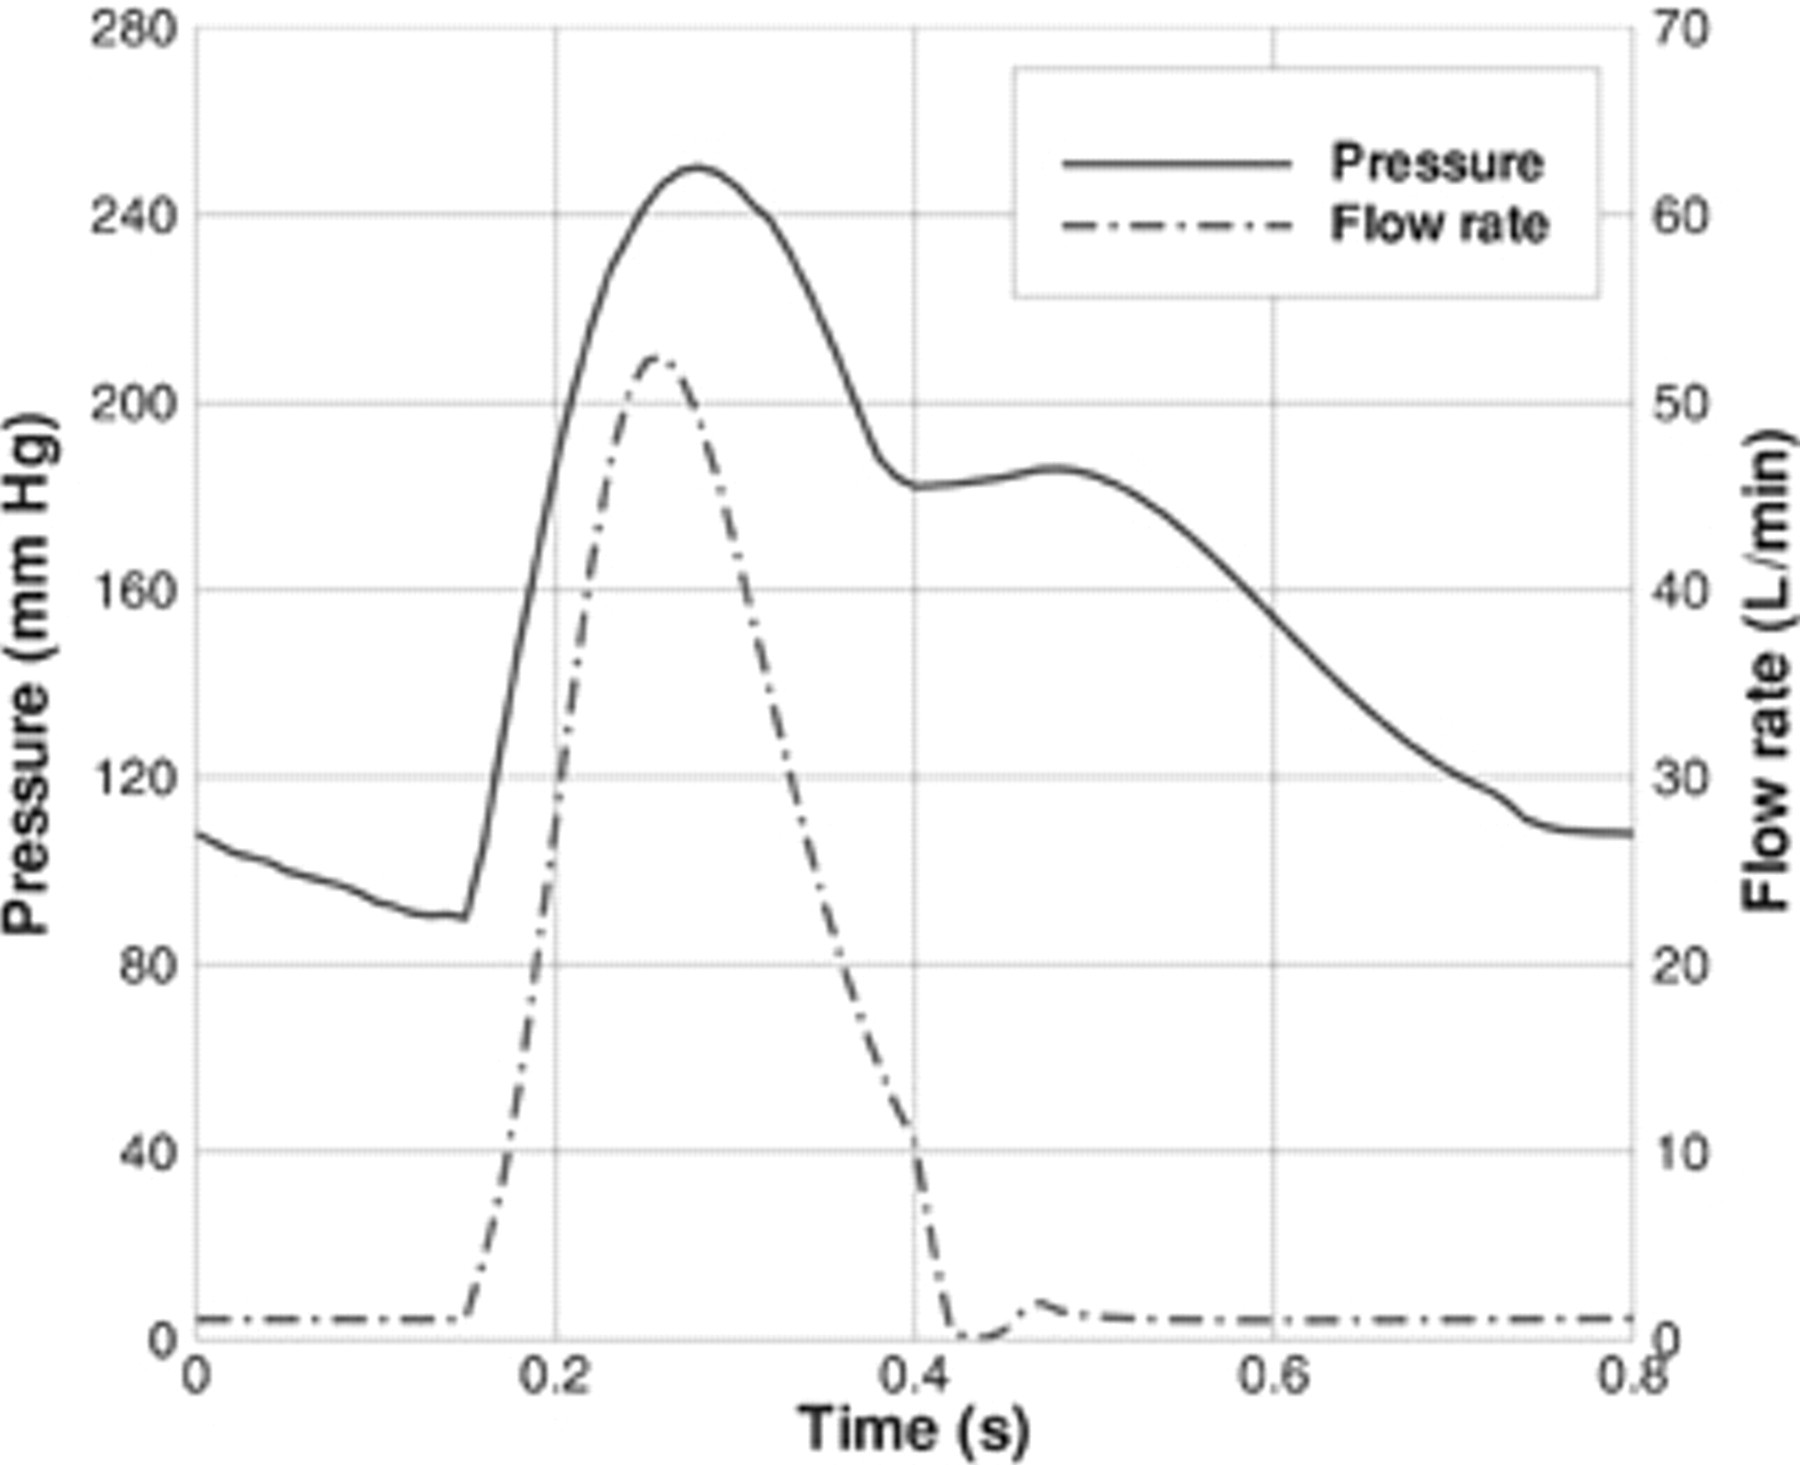
Pulsatile pressure and flow rate curves during one pulse cycle for the high-pressure conditions.
Analytic Mathematical Model
In this article, we have used a simpler form of the full steady-state flow force equation for a symmetric bifurcated endoluminal graft but applied it to pulsatile flow. The analytic equation 15,16 for the force on a symmetric bifurcated graft owing to a pressurized liquid flowing through the graft is shown in Equation 1:

Naturally, a steady-state assumption is questionable because pulsatile flow occurs in the human body; however, the purpose of this study is to determine whether the steady-state force equation is a reasonable approximation to a pulsatile force equation. The proximal end of the graft is labeled by the number 1 (Figure 7) and the symmetric distal ends by 2. In Equation 1, R denotes the force required to secure the graft, and A 1 and A 2 are the cross-sectional areas of the graft at the proximal and distal ends. Similarly, p and v refer to the pressures and velocities at the ends of the graft, ρ is the mass density of the fluid, the two outlet legs of the graft are at an angle α to the horizontal, and gravity is ignored. By symmetry, the values for the area, flow speed, and pressure at the distal ends of the graft are the same, so they are combined in Equation 1, which is used to compute the theoretical forces on a symmetric bifurcated graft. The dimensions of the graft were obtained from Figure 1, and these were used to compute A 1, A 2, and α. The values for the pressures p 1, p 2, and speeds v1 and v2 were measured from the laboratory test rig, whereas the mass density of the fluid, ρ, was measured at 1,060 kg m−3.
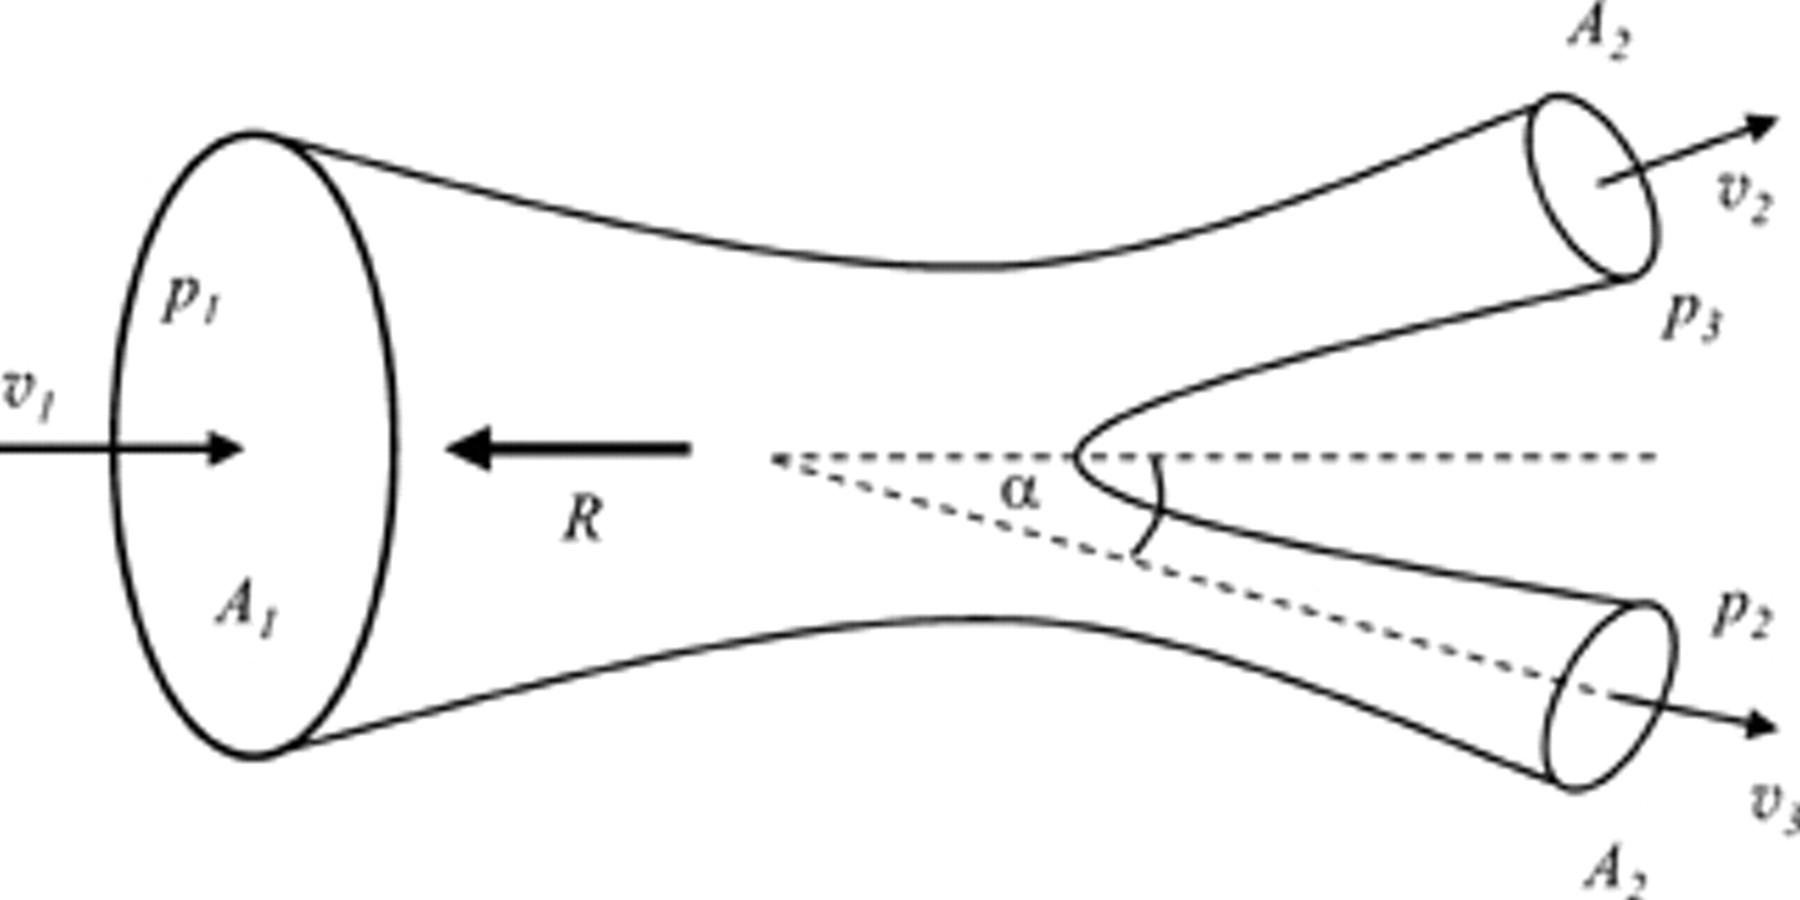
The characteristic velocity, pressure, area, and force vectors required to compute the pulsatile forces on a symmetric, bifurcated pipe of varying cross-sectional area.
This steady-state flow analytic model is a model for a stand-alone stent graft. Clearly, this is an approximation of the real case where a stent graft is subject to velocity and pressure wave reflections owing to the pulsatile flow in an artery. 29 Such a model, however, significantly simplifies the process of obtaining experimental data. These data can then be compared directly with the results from the computational and analytic models. Morris and colleagues derived an analytic mathematical model for pulsatile flow forces on a bifurcated graft in an artery, but their model has the possible deficiency of being somewhat complicated to implement, and they also did not validate their model with experimental results. 17
Results
Experimental Results
The experimentally measured forces on the stent graft for pulsatile pressures from 80 to 130 mm Hg varied from 1.94 to 3.23 N and had an average force of 2.55 N (as shown in Figure 8).
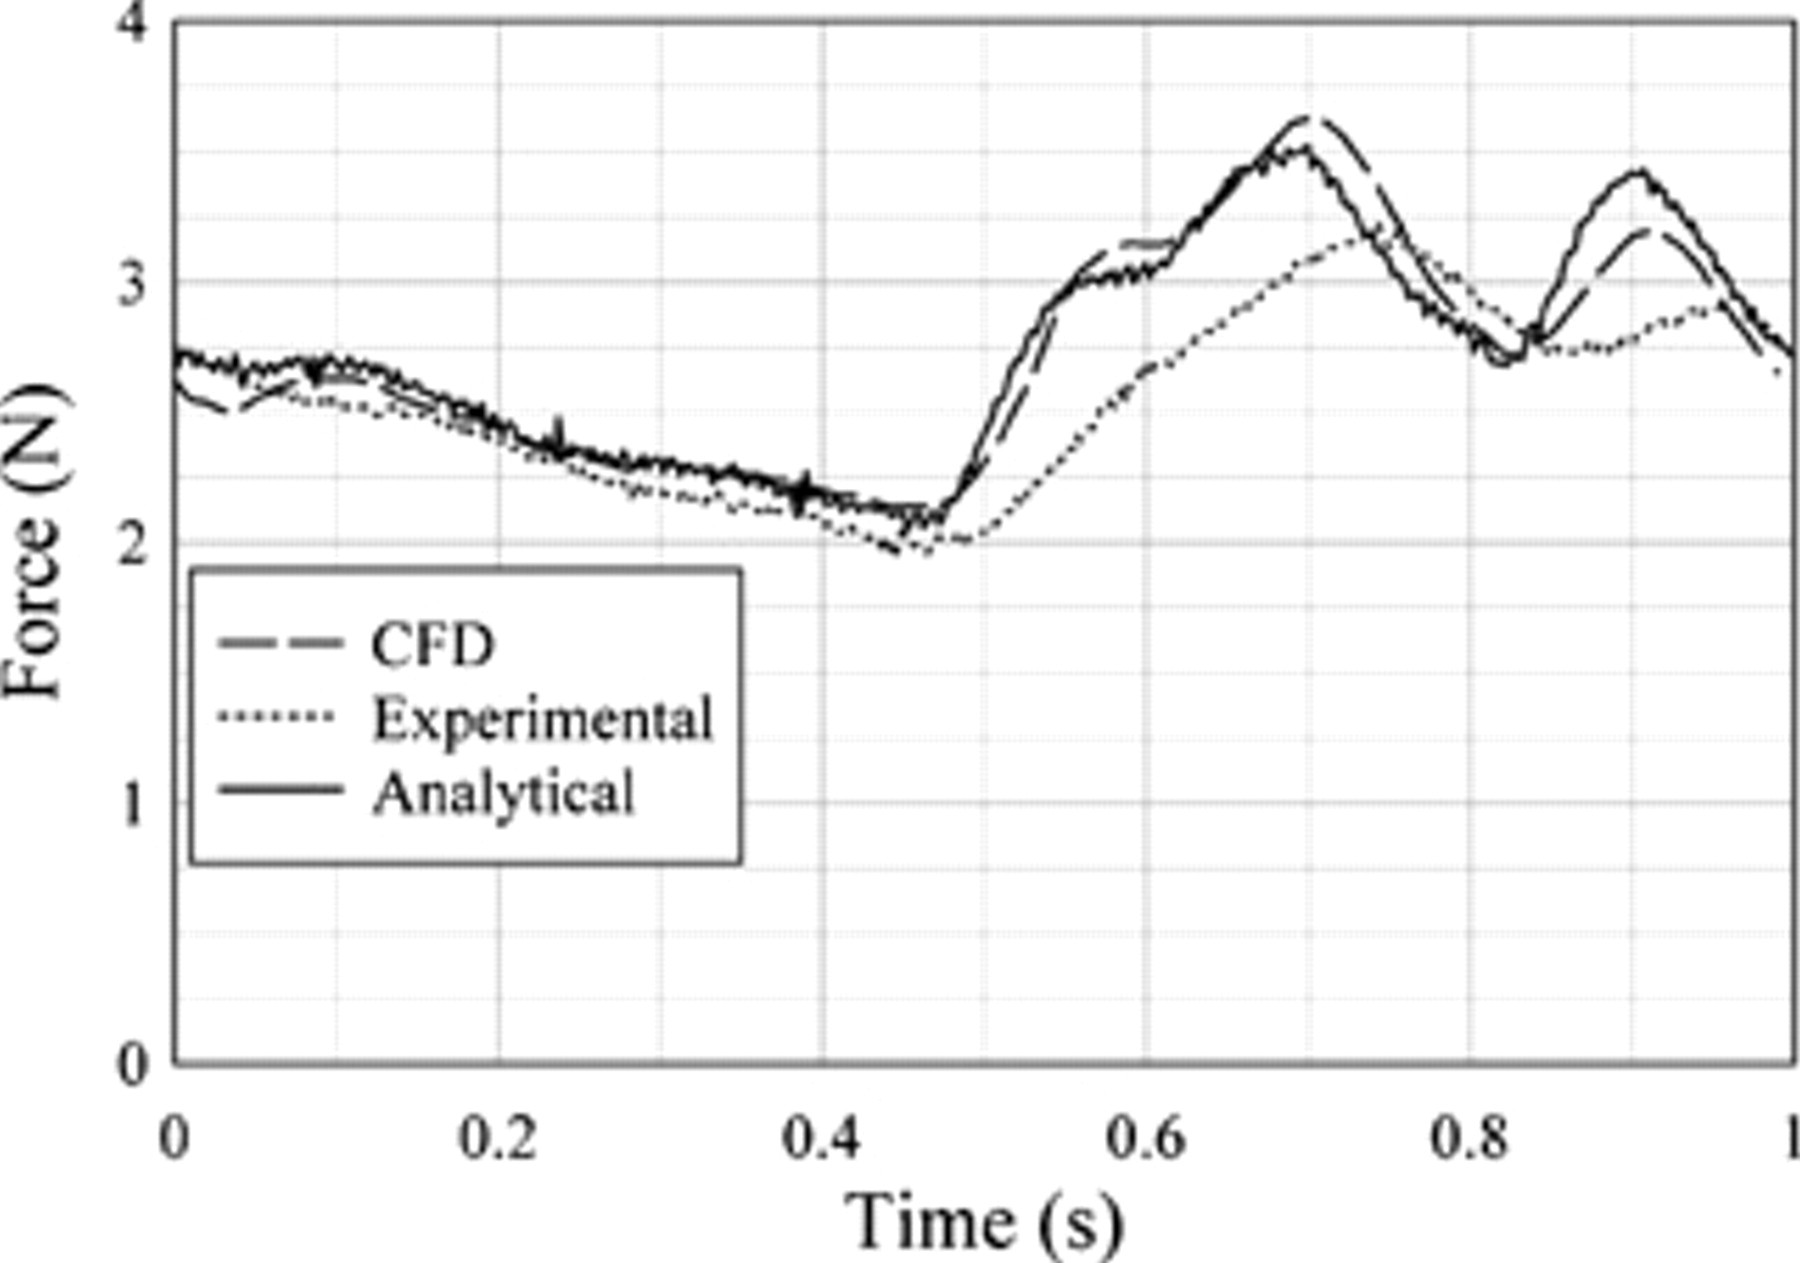
Experimental, analytic, and computational fluid dynamics (CFD) predictions force comparisons.
CFD Results
The predicted axial forces obtained from the CFD simulation are shown in Figure 9. In this figure, three different forces, total force, normal force, and shear force, are shown. The total force is the sum of the normal and shear forces. The total force was proportional to inlet pressure cycle; hence, the pressure contribution to force dominates. Normal force is the direct force onto the surface of the graft from the pressure within and motion of the fluid. As the name suggests, the shear force is the force exerted on the graft by the shearing motion of the liquid as it passes through the graft. Figure 9 shows that the contribution of the shear force to the total axial force ranges from small to negligible. Hence, although the shear force (see Figure 9) follows the volume flow rate profile (see Figure 4), its contribution to the overall force on the stent graft is negligible.
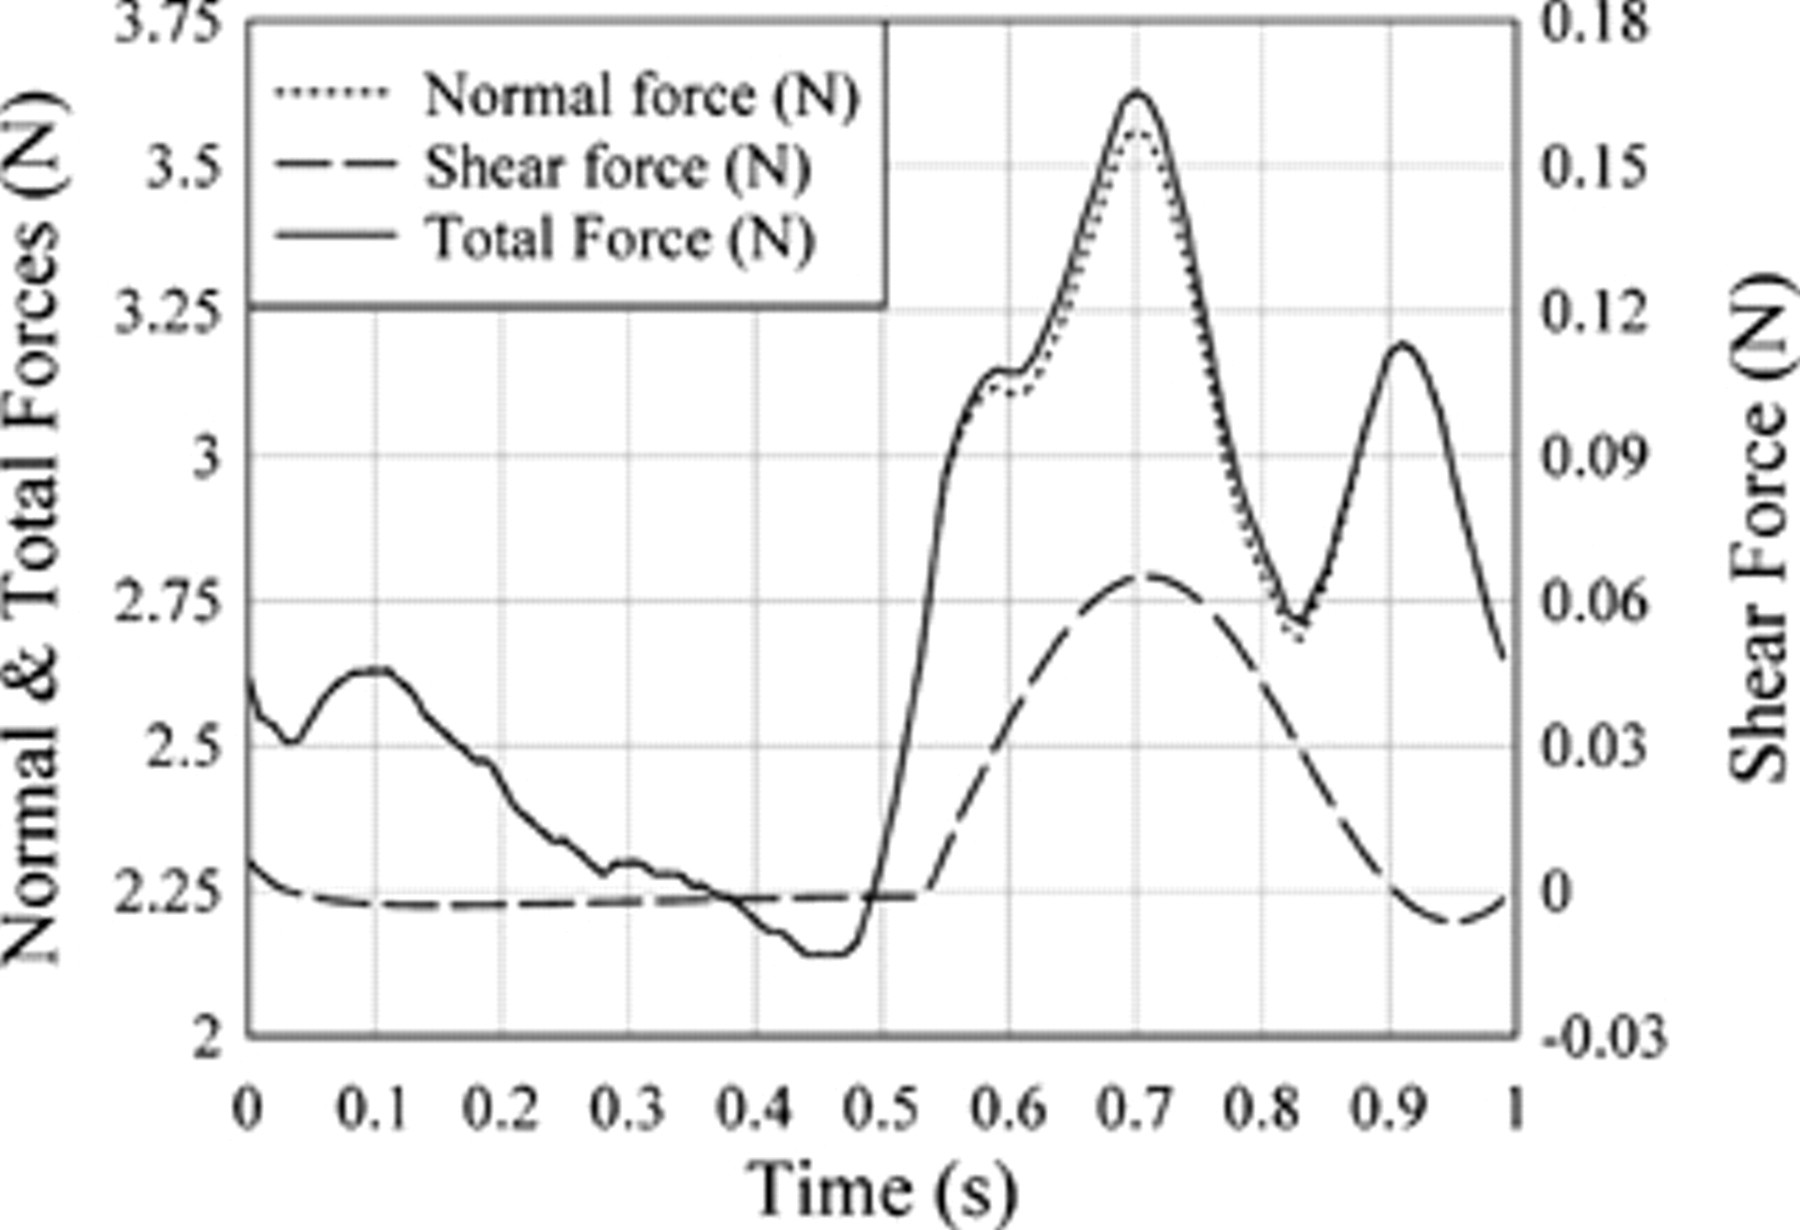
Comparison of the computational fluid dynamics predicted total, normal, and shear forces on a symmetric, bifurcated endoluminal stent graft model. Note the different scale on the right-hand side of the graph for the shear force.
Combined Force Results
The measured pulsatile inlet flow rate data and measured pressures at both the inlet and outlet of the bifurcated graft were input into the analytic force equation for a symmetric bifurcated graft, and the results were compared with the predicted CFD results and the experimentally measured forces (see Figure 8). The difference between the CFD force results and the analytic force results is shown in Figure 10, where the average difference was found to be about 0.03 N, with a standard deviation of 0.1 N. Similarly, the difference between the CFD force results and the experimental results is shown in Figure 11. For this case, the difference in forces between CFD and experiment had an average value of 0.17 N, with a standard deviation of 0.21 N. There is a 10% maximum relative difference for the analytic force results compared with the CFD results, whereas the experimental force results have a maximum relative difference of nearly 25%. The largest differences occur at the peak systole and high gradient systole region.

Comparison of the force difference between the computational fluid dynamics (CFD) and analytic equation force predictions.
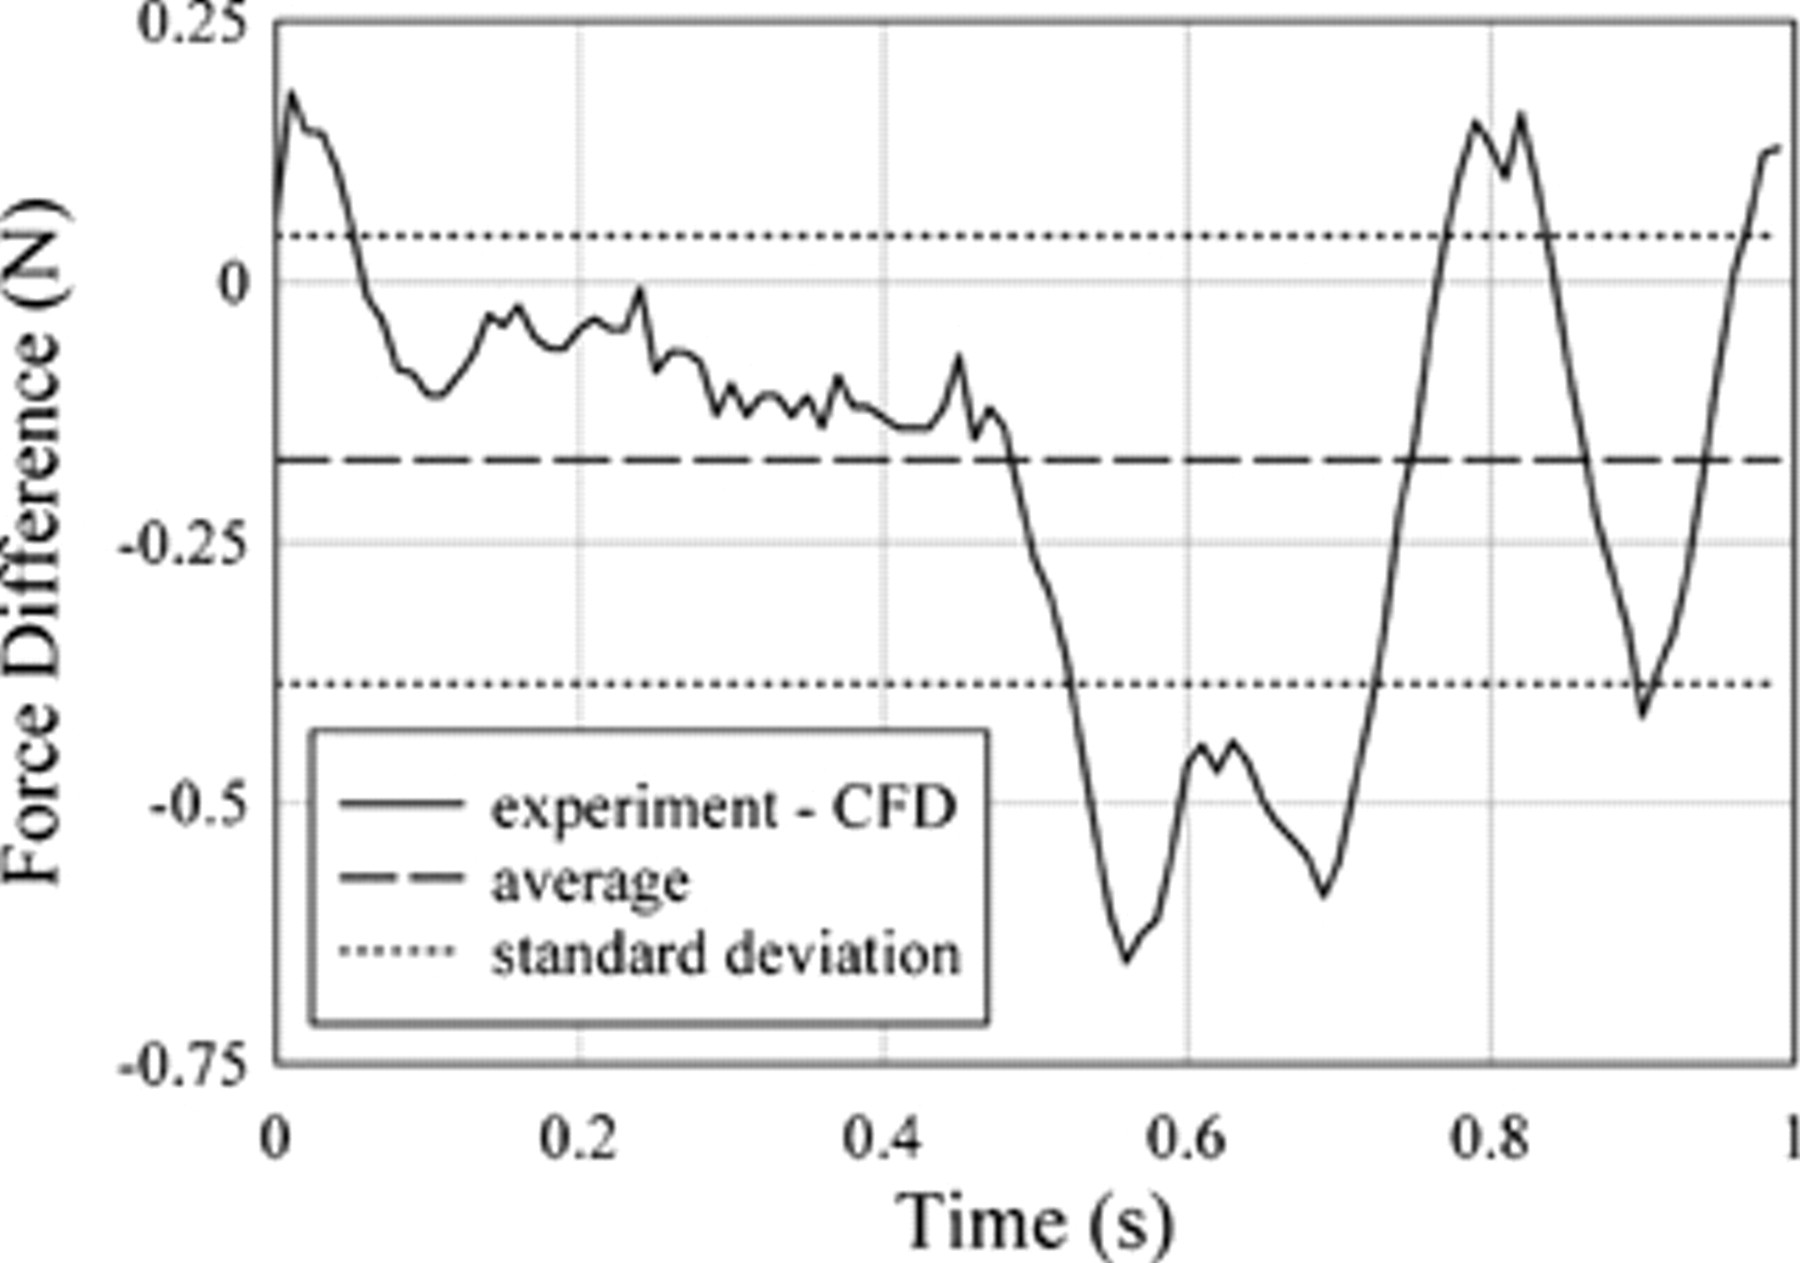
Comparison of the force difference between experimental and computational fluid dynamics (CFD) predictions.
As is apparent, the analytic results were significantly closer to the CFD results both in magnitude and phase, whereas the experimental forces appear to have suffered a time lag of approximately 0.05 seconds relative to the CFD and analytic results. This phase lag and smoothed force waveform were probably due to the flexible membrane connectors.
High-Pressure and High-Flow Rate Results
Figure 12 shows the CFD-predicted forces on two stent grafts, where one graft has a 30 mm proximal inlet diameter and the other has a 24 mm proximal inlet diameter. Both grafts have 12.9 mm distal outlets. The forces are determined for high-pressure and high-flow rate conditions. For the 24 mm proximal inlet diameter stent graft, the maximum predicted force was 7.8 N and the average force was 4.5 N, whereas for the 30 mm proximal inlet diameter stent graft, the maximum predicted force was 17.6 N and the average force was 10 N.
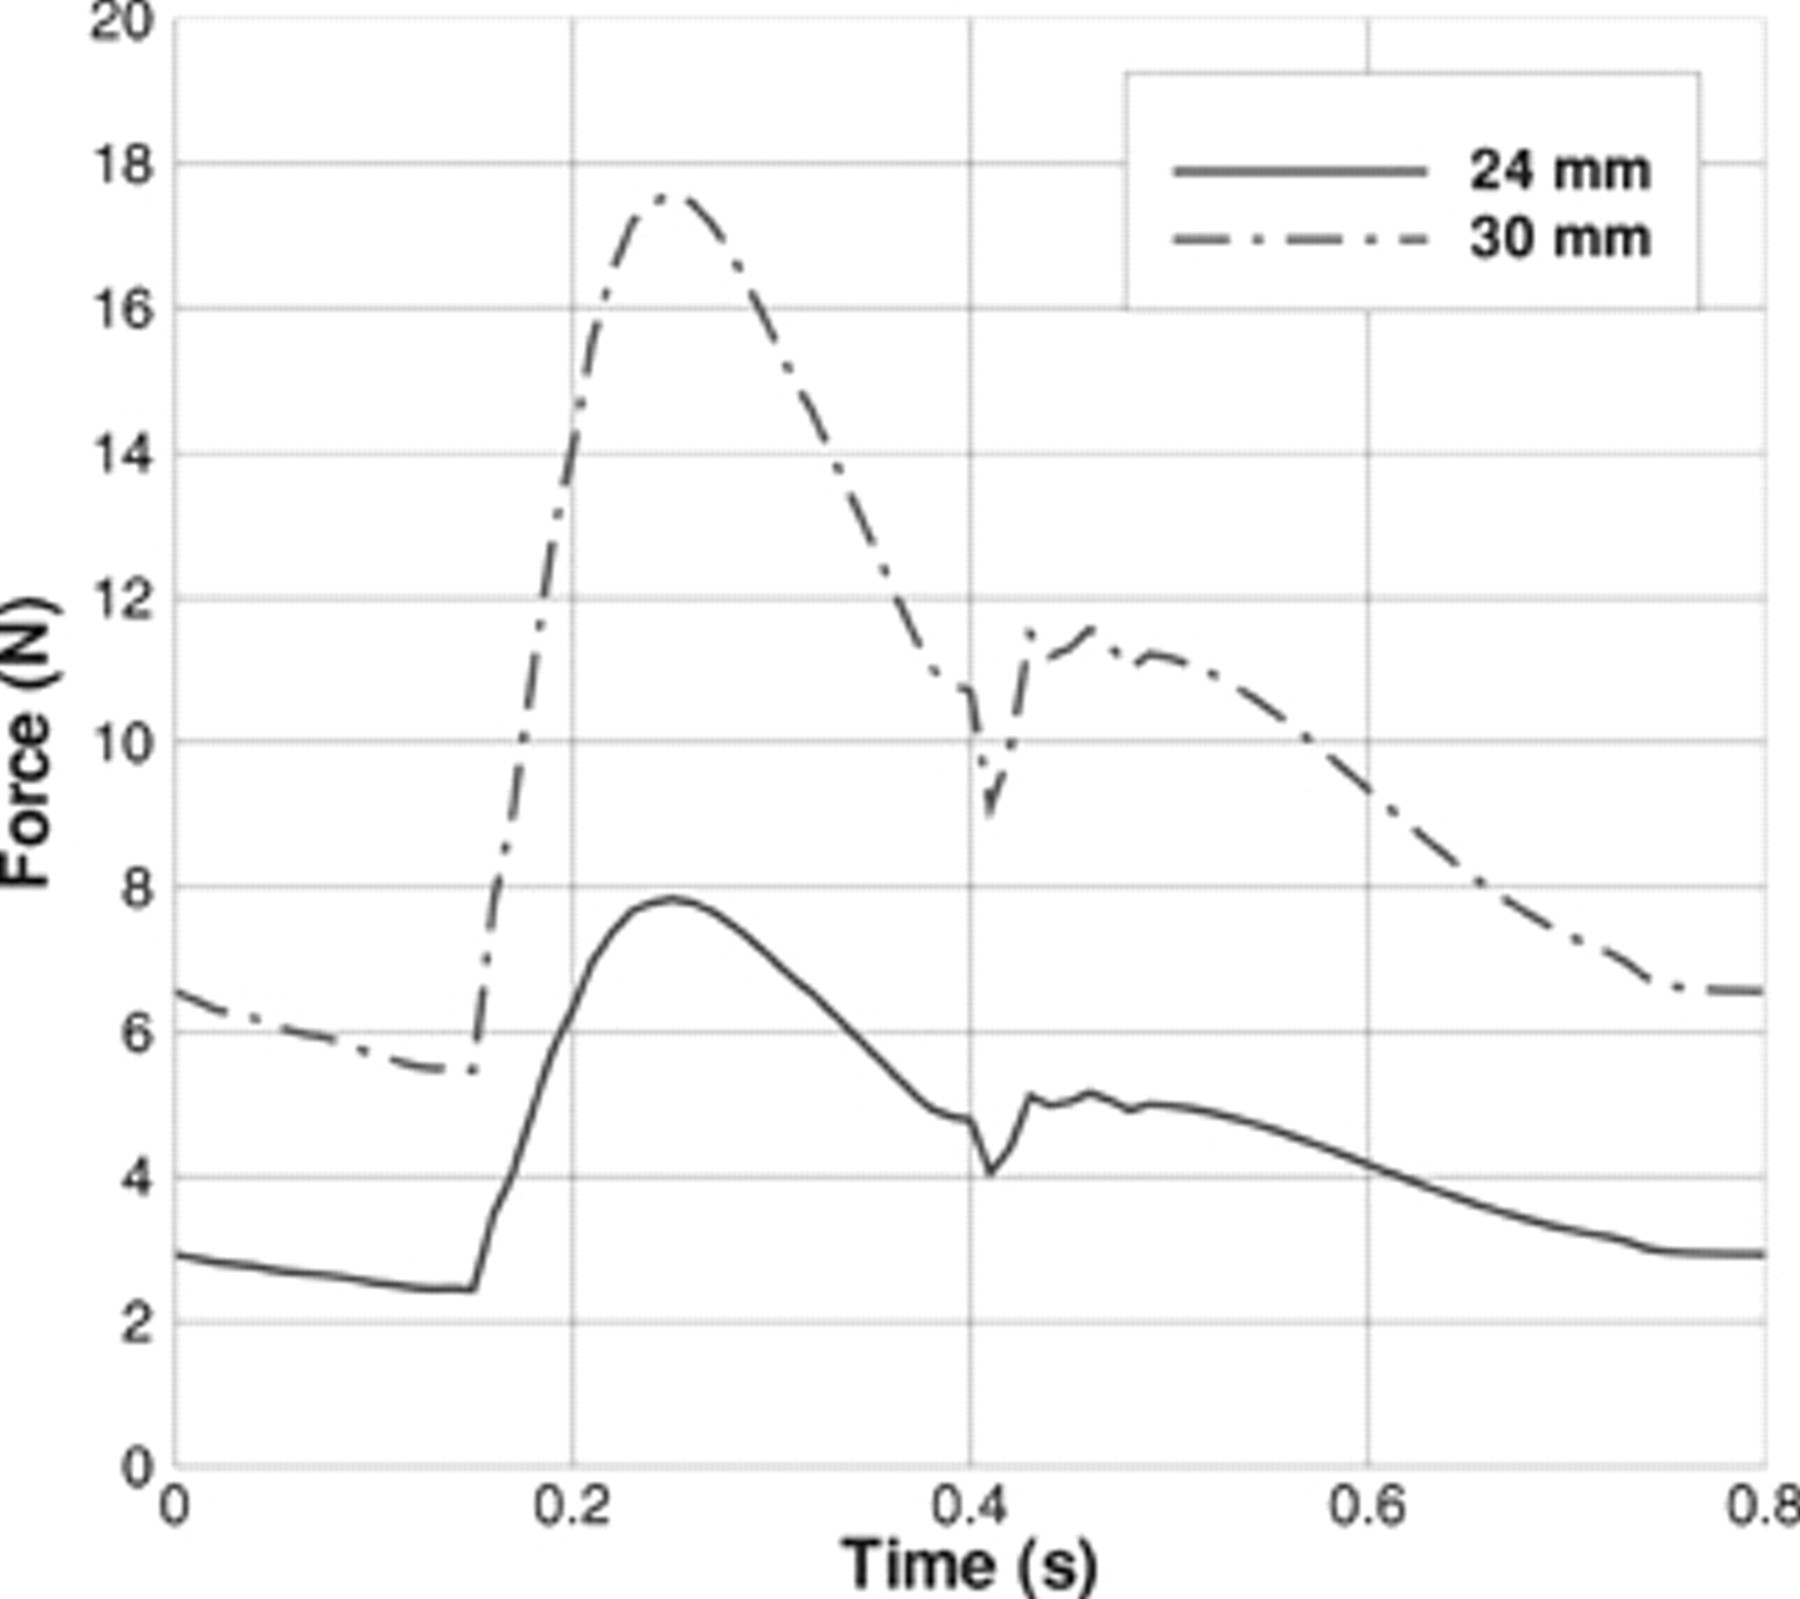
Computational fluid dynamics force predictions during one pulse cycle for the high-pressure conditions for a 24 mm proximal inlet diameter and a 30 mm proximal inlet diameter on a bifurcated endoluminal stent graft.
Discussion
This experimentally measured pulsatile force data on a bifurcated stent graft under pulsatile flow was used to validate the CFD model predictions. Most previous CFD or analytic models for predicting forces on stent grafts were not validated experimentally. Only Šutalo and colleagues and Zhou and colleagues compared theory with force measurements, but they made no comparisons with CFD-predicted forces. 13,14
Stent graft designers must allow for fatigue factors when using the peak forces in their design calculations because the forces will still be applying for 10 years. Engineers should not compromise structural strength, which includes the safety margin for fatigue and peak performance, to reduce the size for delivery.
In this article, we have shown that the steady-state analytic force model can predict forces in pulsatile flow with a maximum relative difference of approximately 10%. It is standard practice for graft designers to multiply the predicted forces by a factor of 2 or 3 to set force tolerances. For such design criteria, a 10% uncertainty is acceptable. The advantages of using the analytic force model are that it gives very good comparisons with the CFD results and that it is much easier and quicker to use. The analytic model can be used without extensive mathematical expertise to obtain quick force estimates for different pressure profiles and graft sizes.
This is especially important for patients who have hypertension, which has been shown to increase the force on the graft. 11 The maximum disruptive force will occur at high pressure. Pressure rises with cardiac output, especially in the elderly, when the compliance of the major vessels declines with hardening of the arteries. It is possible that posture also plays a part and posture that leads to increases in curvature increases the force on the curve of the graft and potential for disruption. 10 Graft design requires safety at the worst-case scenario point and a safety margin to adhere to good engineering principles. Systolic blood pressure during activity in the aneurysm age group may rise to 250 mm Hg in the absence of myocardial dysfunction, as seen during stress exercise testing of the elderly. The safety margin is added to this.
When the blood pressure was increased to 250 mm Hg systolic (and 90 diastolic) for an average flow rate of 10.4 L/min from a 130 mm Hg systolic (and 80 diastolic), the predicted peak force on the 24 mm inlet diameter stent graft more than doubled from 3.65 to 7.8 N. Under high-pressure and high-flow rate conditions, having a larger inlet diameter graft of 30 mm compared with 24 mm increased the peak force from 7.8 to 17.5 N and increased the average force from 4.5 to 10 N, which increased the risk of graft dislodgment.
The experimentally measured forces under pulsatile flow of 1.94 to 3.23 N compares well with previous experimental studies of forces on grafts in real arteries. 6–8 The measured force also compared well with the peak force measurements of 2.4 to 3.3 N on a polytetrafluoroethylene stent graft by Volodos and colleagues under pulsatile conditions with water for pressures of 100 to 140 mm Hg. 11,12 Zhou and colleagues measured forces under pulsatile flow of 3.4 to 12 N that were higher owing to their higher peak systole of 160 mm Hg and larger graft model diameter of 30 mm. 14 Their measured forces were within 18% of the analytic model predictions, whereas in this study, the measured forces for more complicated pressure profiles and an experimental setup where the graft was able to move were within 22% of the analytic model.
We experimentally confirmed that the stent graft force is similar in trend to the cardiac pressure, as was predicted by Li and colleagues. 18–20 We also confirmed that the pressure contribution to force on the graft dominates over flow. 13,14,22
A limitation in this study was the use of a rigid model rather than a soft, silicone rubber model. This was done because the rigid acrylic model was easier to use experimentally and to analyze mathematically, but it also did not introduce a further experimental variable owing to the elastic material. The other two studies that have compared theory with force measurements also used rigid stent graft models. 13,14 We assumed a parabolic input velocity profile with the justification that Morris and colleagues found that the input velocity profile did not affect the magnitude of the drag forces. 21
We assumed that the graft was oriented horizontally for our comparison, which is approximately equivalent to the case when a patient is lying down. However, for patients in the vertical position, the weight force can be included in the analytic model, as shown by Liffman and colleagues. 15 This would typically increase the average force by about 0.7 N for the 24 mm inlet standard case modeled here and should be taken into account when setting force tolerances.
An idealized geometry rather than patient-specific geometry was used in this study. According to Morris and colleagues, using patient-specific geometries could lead to higher force predictions of 26% for their geometries. 21 Hence, this should be taken into account when setting the force tolerances. The stent graft we considered was also simplified, with no hooks or barbs. We confirmed, by using CFD, that shear is not an important contributor to force on the graft.
Howell and colleagues concluded that using their realistic three-dimensional models, with non–steady-state conditions, gives many of the same conclusions as in steady-state models. 22 Similarly, we have shown that the steady-state analytic model with variable pressure and flow rate inputs can give force predictions similar to those of the CFD model.
Conclusion
The effect of pulsatile pressure and flow rate on the forces acting on a model of a bifurcated endoluminal stent graft was experimentally measured and compared with the results from a CFD model. Experimentally, it was confirmed that the total force on the bifurcated graft was proportional to the inlet pressure cycle. It was shown that a steady-state analytic model can be used, with variable pressure and flow rate inputs, to predict forces on a symmetric, bifurcated stent graft in pulsatile flow with a probable maximum relative difference between theory and reality of approximately 10%. This result may be of use to those who design and use endoluminal stent grafts.
Footnotes
Acknowledgment
This work was funded by National Health and Medical Research Council (NHMRC) development grant # 303267 and CSIRO MSE.
Financial disclosure of reviewers: None reported.