



Abstract
This research examines online course-taking in high schools, which is increasingly used by students falling behind in progress toward graduation. The study looks inside educational settings to observe how online courses are used and assess whether students gain academically through their use. Drawing on 7 million records of online instructional sessions linked to student records, we find mostly negative associations between online course-taking and math and reading scores, with some gains in credits earned and grade point averages by upperclassmen. Those least prepared academically and with weaker course-taking behaviors fared more poorly and were likely set back by online course-taking. Limited resources constrained the implementation of district-recommended practices and instructional supports, such as live teacher interactions and individualized content assistance.
Introduction
Digital instruction in K–12 public schools has been expanding rapidly since No Child Left Behind (2002) opened a greater role for the private sector and ushered in increasing accountability pressures for improved high school graduation rates (Cavanaugh, DiPietro, Valdes, & White, 2007; U.S. Department of Education, 2008). The federal government further contributed to this growth by providing resources for public schools to purchase educational technology and requiring states to set aside funds for procuring digital educational resources (Enyedy, 2014). The pace of expansion has been particularly rapid at the secondary education level, where digital instruction occurs “primarily over the Internet, using an online delivery system to provide access to course content” in “multiple settings” (Gemin, Pape, Vashaw, & Watson, 2015, p. 5; Powell, Roberts, & Patrick, 2015). While technology providers typically sell online course systems with expectations and guidance for delivering content in a blended format that combines face-to-face and online instruction, what online instruction looks like in practice in high school classrooms or technology labs varies greatly (Lee & Hannafin, 2016; Orlikowski, 2000).
Powell et al. (2015) reported that more than 75% of school districts were using blended and online learning to either increase course offerings or for credit recovery, while Gemin et al.’s (2015) analysis of a representative sample of 3.8 million online courses showed that nearly three quarters of online courses taken by public school students were in core subjects (math, science, social studies, and language arts). Although Gemin et al. (2015) distinguished “supplemental online courses” (students taking one or two courses per school year) from virtual or fully online course-taking, there are currently no national data on the prevalence of online course-taking or that track the purpose (e.g., for enrichment, to expand course offerings, or as a remedy for course failure) or the format of the instruction (blended or fully online) as it is accessed by students (Queen & Lewis, 2011; Viano, 2018).
With many large, urban school districts targeting students who are struggling in traditional classroom settings for online course-taking, the potential for differential access to quality learning experiences between online and traditional classroom environments could have profound implications for equality (Ahn & McEachin, 2017; Heppen et al., 2017). While federal e-Rate program and Title I funding used by low-income school districts to purchase educational technology may have reduced gaps in access to online instructional tools for low-income students and students of color in schools, disparities persist in how and for what purposes they are used by race and socioeconomic status (Becker, 2000; DiMaggio, Hargittai, Celeste, & Shafer, 2004; Hohlfeld, Ritzhaupt, Barron, & Kemker, 2008; Warschauer & Matuchniak, 2010; Zickuhr & Smith, 2012). At the same time, proponents argue that online course-taking may help students recover credits from prior course failures by offering more opportunities to customize content and individualize instruction (Archambault et al., 2010). And if blended learning models that integrate live, personalized instruction and attention to individual needs are implemented in online instructional settings, students who require additional support or individualized modifications to overcome barriers to learning could potentially benefit from such blended instructional approaches (Picciano & Seaman, 2009).
Recognizing the enormous variability in how online instructional programs are accessed, used, and supported in schools and the roles of context and capacity in determining whether or not students benefit from their use (Burch, Good, & Heinrich, 2016; Means, Toyama, Murphy, Bakia, & Jones, 2010), we explore in a large urban school district three primary research questions: (1) Who among secondary school students are taking courses online? (2) How are they interacting with the online course system and what structural factors (e.g., physical environment, instructional support) impede or support their access to quality learning opportunities? (3) How does the use of online instructional programming in high schools affect whether or not students make academic progress through its use? Through this research, we also consider the effectiveness of policies and strategies at district, school, and classroom levels that are being implemented with the intent to improve student educational outcomes through online learning.
The context for our research is an urban school district that began implementing an online instructional program primarily, but not exclusively, for high school students falling behind in their academic progress toward graduation (i.e., credit recovery). The online course-taking system was first rolled out in the 2010–2011 school year with the objectives of increasing course and credit completion, providing personalized learning opportunities for students who perform less well in the traditional classroom, and improving student achievement. Nearly every high school in the district (46 in total over our study period) enrolled students in online courses in at least 1 year. By the 2016–2017 school year, 5,678 courses, or about 20% of all credits accrued in middle and high schools in the study district, were completed online, and 40% of 2016–2017 graduating seniors had completed at least one course through the online course-taking system. The particular online course-taking system we study is used for similar purposes in other school districts throughout the nation.
In undertaking this investigation of the implementation and effects of an online instructional program, we employ mixed methods and draw on variation in the use of online instruction within and across schools (and over time), which we observe both qualitatively and quantitatively. Specifically, we examine variation in environment and setting, instructional delivery mechanism and style, student and instructor engagement, and policy implementation. We also focus on factors at the school, classroom, and student levels that have the potential to influence equity in access to and use of online instructional programs, particularly for students of color, low socioeconomic status, English language learners, and students with special needs.
Below, we briefly review existing research on the motivation for and use of digital instruction in K–12 education, particularly at the secondary school level, and describe the framing of our research investigation. We then introduce our study samples, data, and the focus and methods of our quantitative and qualitative analyses. We follow with the presentation and discussion of our research findings and their implications for policy and practice as online learning continues to expand in K–12 schools.
Background and Framework
The Promise for and Evidence on Digital Instruction
Digital instructional programs are marketed to state and local educational agencies on the premise that they will expand quality learning opportunities for students and enhance instructional practices for teachers, albeit perhaps with expectations for conditions and capacities in place that may be unreasonable for many large, resource-constrained school districts to attain (Burch & Good, 2014). Arguments for the adoption of online instructional programs include more personalization of course content and tailoring of instruction to student experiences and skill levels; access to more diverse learning resources and wider course offerings (within and outside the classroom); and fostering greater student engagement and motivation for learning and more connected learning opportunities (Cavanaugh et al., 2007; Collins & Halverson, 2009; Darling-Hammond & Bransford, 2007). In addition, new strategies and forms of assessment are being built into online instructional programs, with more rapid feedback loops, structured forms and processes for monitoring student progress, and greater access to assessment information for teachers, parents, and students (Burch et al., 2016; Halverson et al., 2015). Indeed, many digital learning initiatives begin with a plan to deliver instruction through blended learning approaches that combine digital and face-to-face content delivery as a way to marry the flexibility, access, and monitoring and feedback tools of online instruction with the social aspects, individualization, and contextual benefits of face-to-face instruction (Enyedy, 2014; Osguthorpe & Graham, 2003). Existing research emphasizes the importance of continued live interaction between teachers and students as online instruction is adopted, as well as more collaborative rather than independent interactions with online instructional components (Means et al., 2010; VanLehn, 2011; Zhao, Lei, Yan, Tan, & Lai, 2005).
Despite the promising features embedded in online instructional programs, prior research finds mixed (positive and negative) and wide variation in effects on student achievement across schools and student subgroups, as well as limited implementation of the program features that are intended to enhance learning and instructional quality (Ahn & McEachin, 2017; Chingos, Griffiths, & Mulhern, 2017; Cole, Kemple, & Segeritz, 2012; Margolin, Kleidon, Williams, & Schmidt, 2011; Pane, Steiner, Baird, Hamilton, & Pane, 2017). Pane et al. (2017) pointed out that most personalized learning efforts have been implemented in school and classroom settings that continue to employ traditional models of large-group instruction, while the modal approach to personalization involves student self-pacing and some additional choices of media for learning, due in part to the limited capacity of teachers to organize classrooms in ways that support more innovative digital learning (Margolin et al., 2011).
Research focusing specifically on online course-taking shows that a large share of high schools adopt online course instruction primarily for credit recovery and realize relatively low rates of course completion, generally in the range of 30% to 55% (Carr, 2000; Roblyer, 2006; Simpson, 2004; Stevens, Frazelle, Bisht, & Hamilton, 2016; Viano, 2018). The few studies that examine the implementation of online learning at the secondary level emphasize the importance of staff with training to provide instructional support and monitor student progress (Hannum, Irvin, Lei, & Farmer, 2008; Stevens et al., 2016). A study of online course-taking for credit recovery in Montana found that only a handful of schools provided extensive student support, with the role of most teachers limited to addressing classroom management and technology access issues (Stevens et al., 2016). This study also identified student engagement and attendance as critical factors, yet there has been little attention in the literature as to which students enroll in and complete courses online or what influences the extent to which they engage and how well they perform. Another concern with rapid growth rates in online instruction (more than 100% in some states) is the disproportionate share of students with disabilities and of color taking these courses (Corry, Dardick, & Stella, 2016; Smith & Basham, 2014). In Arizona, online school options are seen as one way to increase access and reduce dropout rates for Hispanic or Latino students, despite a lack of conclusive evidence that online schools meet the needs of this particular student population or increase their high school graduation rates (Corry et al., 2016). More recently, allegations have been made of inflated high school graduation rates attributed in part to low standards in and misuse of online credit recovery programs in school districts in Chicago, Nashville, New York, San Diego, and Washington, D.C. (Malkus, 2018).
Heppen et al. (2017) conducted one of the first studies using an experimental design to assess the effectiveness of online credit recovery course-taking in high school compared with a face-to-face option. The study followed students in 17 Chicago Public Schools who failed algebra in their first year of high school and were randomly assigned to retake the course in the summer through either an online course provider or a traditional face-to-face course. Of these students, 90% were Hispanic or African American, 86% were free- or reduced-price lunch eligible, and 12% qualified as students with disabilities. Heppen et al. (2017) described the various ways the courses might have differed when offered online versus face-to-face—such as content and sequencing, staffing intensity, interactions between instructors and students, and grading and feedback—with more variation expected across these dimensions within the face-to-face setting. They reported that the online instruction was delivered mainly in school computer labs, with most communication between students and teachers occurring asynchronously. When comparing student outcomes following the summer courses, they found that students in the online course had significantly lower end-of-course posttest scores and lower credit recovery rates compared with those in the face-to-face course. Contrary to touted advantages of online instructional models for facilitating personalized learning, the authors surmised that the online course may have been less effective in adapting to students’ individual needs, in that these courses lacked flexibility for addressing gaps in students’ initial skills and understanding of algebra. More rigorous evidence, such as this across a wider variety of online course-taking and in more grades and settings, is needed to determine if these results generalize beyond this particular online course and context.
Theoretical Framing
This longitudinal, mixed methods study of online course-taking in high schools is situated within a broader research investigation of digital learning in K–12 public schools. In formulating the logic model shown in Figure 1 to guide our research, we drew on sociotechnical and sociocultural theories. Sociotechnical theory takes into consideration the technical properties of the educational technology and examines how the technology users enact them in practice, positing that individuals and their social settings will shape the types and intensity of their use through recurring interactions (Orlikowski, 2000). Sociocultural theory similarly focuses on understanding student learning and development through their interactions in educational settings, but it places a greater emphasis on social and cultural norms and processes that influence how students use technology and whether and how they draw on other individuals and resources in the classroom to support their learning with it (Nasir & Hand, 2006). Sociocultural theory also stresses that we should not lose sight of how educational settings, particularly in large urban school districts such as the one we study, are interleaved with larger societal forces such as those that perpetuate poverty, discrimination, and inequality. These two theories and the logic model developed through this framing guided the focus of our data collection—including classroom observations of instructor and student use of the technology and their behaviors and interactions that varied around physical settings and resources such as instructional and technical supports (see Figure 1)—as well as our analysis of student online user behaviors, outputs (e.g., time on task) and short-term outcomes (e.g., course completion, credit accumulation, and grades).
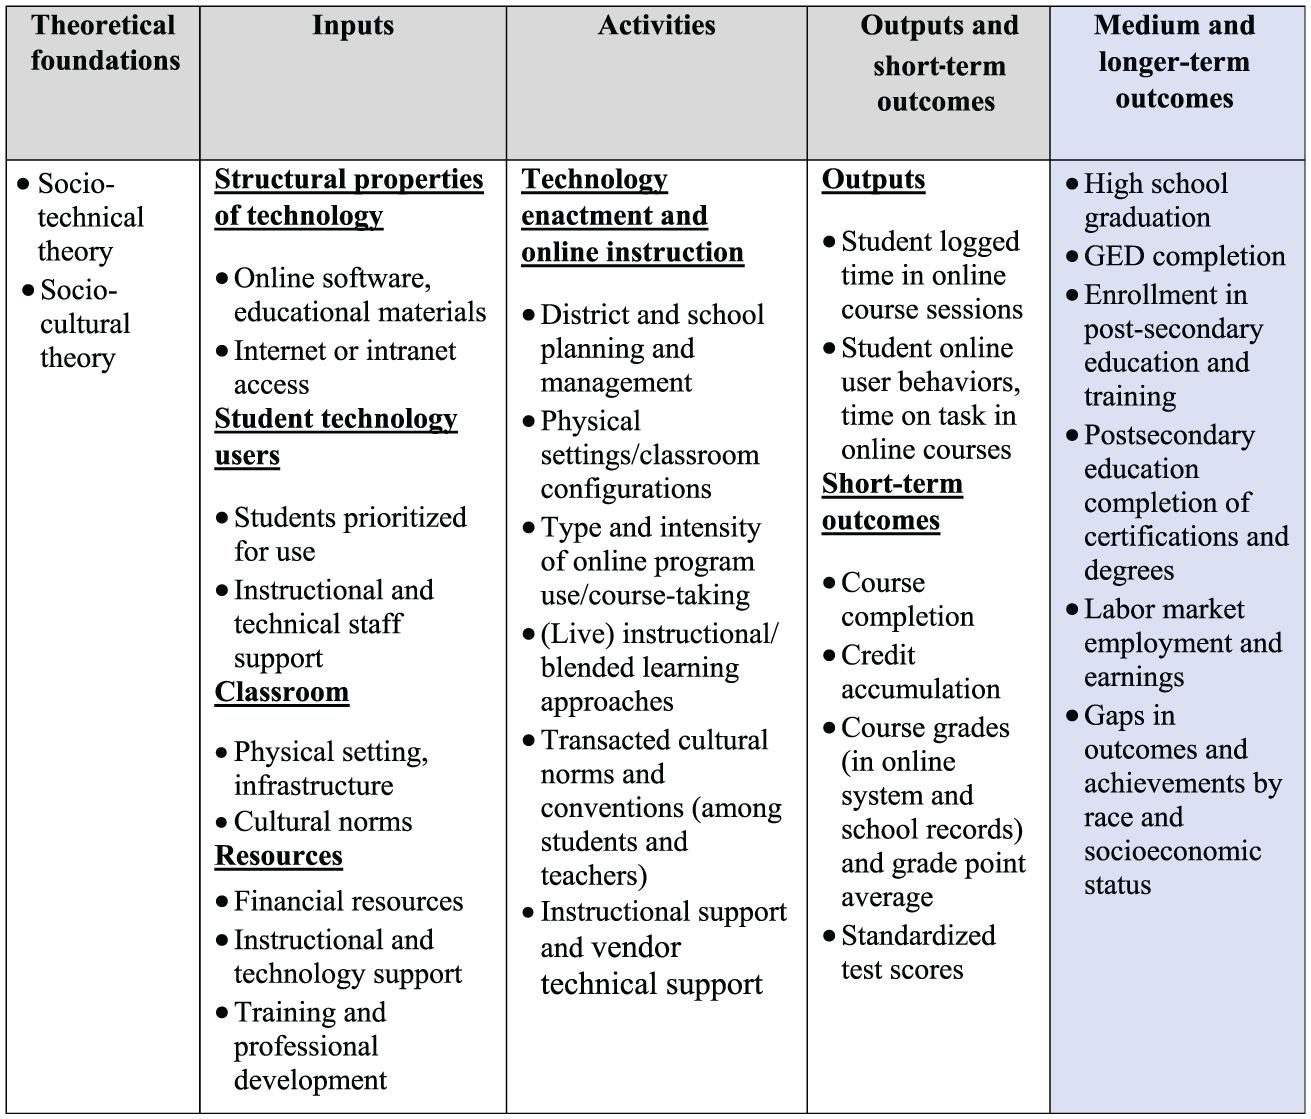
Logic model for assessing equity and effects of online instruction in high schools.
As our in-depth investigation of digital learning progressed and we uncovered patterns in the targeting and implementation of high school online course-taking, we sharpened our theoretical framing to hone in on concerns about equity in access to quality learning opportunities and instructional supports for the historically underserved student populations that are frequently prioritized for online learning in low-resource, urban school districts. In particular, we bring in theory on categorical inequality that describes how education systems create social categories and sort students into groups such as classrooms and academic tracks, often by ability, which in turn influence the educational environments and resources made available to them for learning (Domina, Penner, & Penner, 2017; Massey, 2007). For example, in our partner district, as we discuss below, we observed that high school students are typically assigned to take courses online after failing a course in a traditional classroom or being removed for behavioral problems or special educational needs. These students often go to an online learning lab rather than a regular classroom for instruction, which effectively segregates them according to their academic performance and institutionalizes their exclusion from better performing peers. As Domina et al. (2017) elaborate, this social categorization of students may influence not only influence students’ access to academic content and resources but also their own identity formation and social status in ways that can exacerbate negative stereotypes and reinforce racial and class disparities in educational processes that extend beyond students’ time in school. Relating this theoretical perspective to our logic model in Figure 1, we explore how categorical inequalities emerge in how students are prioritized for online course-taking and in the physical settings where online instruction is accessed and the resources and supports provided to teachers and students to create quality learning opportunities with technology.
Research Methods
Study Samples and Data
This study is set in an urban, Midwestern school district, where approximately one quarter of students in Grades 9 to 12 access course instruction through an online instructional program, both during and outside the school day (up from about 5% of all high school students when use of the program began in 2010–2011). Data from the technology vendor on online course-taking in this district are currently available through the 2016–2017 school year, including detailed information on student use in each online session, course information, and progress toward course completion and performance. We link these data to student record data that include demographic information, absences and suspensions, credits earned and GPA (grade point average), ACT (American College Test) scores, and standardized test scores, as well as to measures of high school characteristics.
In the analyses of quantitative data, we focus on online instruction occurring in 46 high schools over the 2013–2014, 2014–2015, 2015–2016, and 2016–2017 school years. We linked student district records to the vendor’s online instructional program records with match rates ranging from 80.1% to 86.6% as follows: (1) 4,676 online course-takers (81.4%) matched with 1,648,380 session-level vendor records in 2013–2014, (2) 5,175 online course-takers (86.6%) matched with 2,142,340 session-level vendor records in 2014–2015, (3) 4,976 online course-takers (83.3%) matched with 1,599,852 session-level vendor records in 2015–2016, and (4) 5,250 online course-takers (80.1%) matched with 1,510,189 session-level vendor records in 2016–2017. Table 1 presents basic demographic characteristics for our study sample, comparing all high school students in this district with online course-takers with linked district-online vendor records. The simple descriptive statistics in Table 1 suggest that a higher proportion of students taking courses online identify as Black and low-income. Online course-takers in the district are also absent more often from school and have lower average fall math and reading test scores than the overall district high school student population.
High School Student Characteristics (Study District)

Note. Online course-takers without linked district records had shorter course durations and lower on-time course passing rates. A table with the details of the comparison of these two groups (with and without linked records) is available from the authors.
The strength of qualitative research methods lies in its focus on the creation of meaning, situating the research in natural settings or contexts, and the holistic and rich nature of its data sets (Miles & Huberman, 1994). Qualitative approaches allow us to examine the conditions and processes through which a phenomenon like online credit recovery interacts with students, teachers, and the persistent characteristics of classrooms and schools (e.g., structures, beliefs, perspectives, culture). In our effort to better understand the nuances of digital learning in high schools, this study draws on rich data collected in 158 observations of student online course-taking in 18 high schools across the 2014–2015, 2015–2016, and 2016–2017 school years. While there is considerable variation in the percentage of students taking courses online in the high schools over time, the particular high schools observed included approximately 90% of all the students who took courses online in the district. We used a standardized observation instrument developed to evaluate the nature of digital tools and their implementation in digital and blended instructional settings (Burch et al., 2016). The rubric evaluates the extent to which the instructional session facilitates quality learning opportunities for students using a set of indicators or dimensions for rating the entire learning experience (see the full instrument in the Appendix, available in the online version of the journal) along a 5-point Likert-type (0–4) scale. The instrument also records narrative comments for each dimension and an in-depth narrative vignette. We capture total instructional time, time on task, the extent to which the format facilitates live interaction between instructors and students, and the functionality/operability of the technology, which map to many of the specific inputs, activities, and outputs shown in the logic model in Figure 1. As we do not identify the students observed, we do not directly link the data collected in the observations to the student-level district provider data. All research team members conducting observations went through a series of reliability trainings to ensure consistency in ratings and the nature of and constructs captured via our qualitative fieldnotes.
In addition, we conducted 24 structured interviews with district- and school-level administrators and support staff over 2 years to characterize and understand how malleable factors such as organizational capacity, staffing, training, support decisions, and policy guidance and requirements for implementing the technology influence access to, and the effectiveness of, the online instructional tool in increasing student learning. The interviews addressed teacher background, training and experience with technology, how the online instructional program is used in the classroom and integrated with other instructional practices, support received for using the program, impediments to their access and effective use by students, and needs for additional resources to improve program use and student outcomes (corresponding to inputs and activities in our logic model, particularly resources and supports in technology enactment). Consistent with recent calls for better implementation studies of digital K–12 initiatives (e.g., Pane, 2018), our qualitative approach adds a nuanced understanding of conditions surrounding digital learning in K–12 classrooms, a detailed description of implementation processes, and context and texture to the quantitative analysis of program participation and outcomes.
Study Measures
Treatment and Control Measures
We conceptualize and investigate “treatment” in online instruction in two primary ways to address our first two research questions, assessing (1) who accesses courses online (for at least one course during high school) when targeted or offered the opportunity and (2) how students are using (interacting with) the online instructional program in the educational setting, including these measures of user behavior: session and course duration, number of courses in which a student enrolled, number of sessions per course, activities completed per day, idle-to-active time per session, and the percentage of sessions taking place outside the regular school day. We begin by investigating the extent to which student demographic characteristics (see Table 1 again) and their academic status and experiences (i.e., course failure, credits earned, GPA, absences, suspensions, and test score performance) predict the likelihood that they will take a course online. We also factor in school characteristics using school fixed effects as well as publicly available data that describe the type of high school (alternative, charter, neighborhood, and specialty schools), administrator type (principal, assistant or co-principal, teacher/teacher leader, etc.), school calendar, geographic location, and other attributes. Administrative and support staff conveyed in interviews that decisions about how to organize online course-taking and how intensively it is used are typically made at the school level and vary from year to year (as discussed below and shown in Table 2).
Percentage of Students Taking Courses Online by High School and School Year
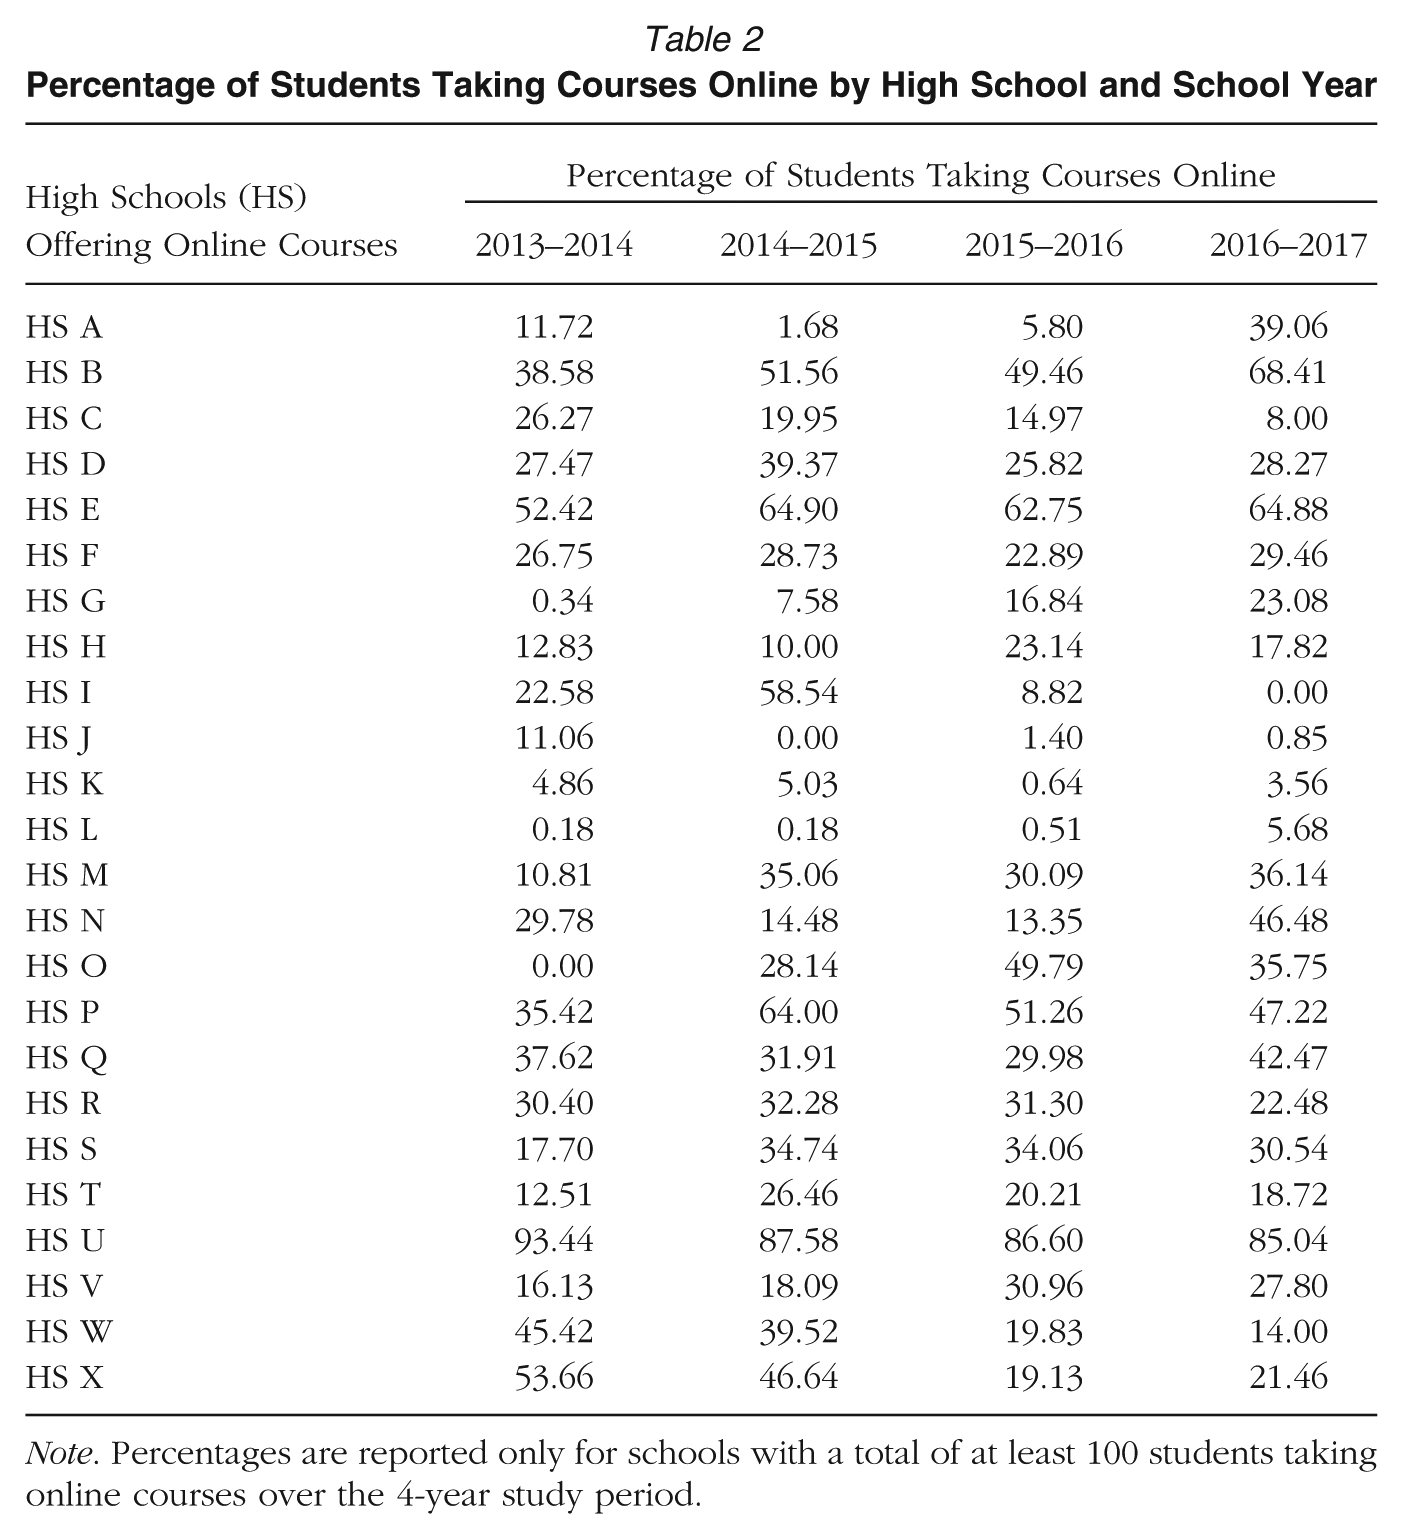
Note. Percentages are reported only for schools with a total of at least 100 students taking online courses over the 4-year study period.
We next draw on the rich data available on student user behaviors and level of engagement with the online instructional program to elicit some descriptive typologies of student use (or “user types”), using k-means cluster analysis. In this way, we differentiate student use based not only on their individual (or historical group member) characteristics (Catterall, 1998) and prior academic performance but also on factors in the implementation of online course-taking that may be more malleable at the classroom level for improving student use of the online instructional program (see again Figure 1).
Outcome Measures
To address the third research question about how online course-taking affects students’ academic progress and educational outcomes, we first use the session-level data on student engagement with the course-taking system to construct measures of their online course performance. These include four primary measures: online course pass rates, on-time completion (relative to semester deadlines), course grades, and the percentage of courses disabled. Students are required to achieve a minimum score, typically 70%, on all course tests to pass the course, although teachers can manually adjust passing requirements for students in exceptional cases. In addition, the school district explored using pretests to exempt students from part or all of course requirements over the course of our study, although a systematic policy to guide the use pretesting was not in place during this time. Disabling a student’s course involves restricting their ability to log in and work in the system (temporarily or permanently) and is typically performed by the supervising instructor when a student is not making progress toward course completion. We use the information on student course-taking behaviors, in conjunction with the student typologies constructed from the session-level analysis of those data, to assess the relationships between student interactions with the online instructional program and their course performance, controlling for student and school characteristics.
We then extend the analysis of the effects of online course-taking to examine student intermediate outcomes in high school, including the relationship between any online course-taking and intermediate outcomes, and that of varying intensities of online course-taking. The four intermediate outcomes we focus on are reading and math standardized test scores (scaled scores from fall and spring MAP and Star assessments), course credits earned in the academic year, and GPA. In assessing associations between online course-taking and these student outcomes, we strive to control for selective differences between students who take courses online and those who do not, and in models examining types of use, factors associated with stronger levels of engagement, and intensity of use. We describe these methods below.
Mixed Methods Analysis
Quantitative Analysis of Who Takes Courses Online
First, in empirically assessing who among high school students is taking courses online, we employ estimation approaches that take advantage of the panel structure of our data (covering four successive academic years), which enables us to adjust for school and grade factors that remain stable across time. Specifically, we estimate what predicts: (1) student use of the online instructional program over time using logistic regressions with pooled data and school, grade, and year fixed effects; (2) year-by-year patterns in student online course-taking, estimating separate logistics regressions for each year that include school and grade fixed effects; and (3) the number of years of online course-taking by a given high school student, using multinomial logit regressions with school fixed effects.
k-Means Cluster Analysis of Student User Typologies
To identify typologies of student interactions with the online course-taking system, we focus on online course-takers only and employ k-means cluster analysis with session-level data (i.e., each observation is a student session in the system). k-Means cluster analysis is an iterative process that divides the available cases into k number of groups and then assigns each case to the cluster with the closest centroid (minimizing the Euclidian distance between each case and its assigned cluster; Saenz et al., 2011; Steinley, 2006). After each assignment, the procedure updates the cluster centroids, reassigning cases as needed as it proceeds through the data, with the resulting clusters selected to minimize the error sum of squares (Steinley, 2006). Since many of the variables were on different scales, we standardized the variables on a common range, a procedure established by Milligan and Cooper (1988) as an alternative to z-score standardization, which can distort underlying group structures (Dillon, Mulani, & Frederick, 1989).
For inclusion in the k-means cluster analysis, variables had to meet the following conditions: (1) measured student interactions with the online course platform, (2) were not highly correlated with another included measure, and (3) were controlled directly by the student. For instance, we did not include information on the type of courses enrolled in or whether a student’s course was disabled, as these were influenced by school-level policy. We also excluded inherent student characteristics such as race, gender, or poverty status. The following variables met all criteria for inclusion in the k-means cluster analysis: course duration, the number of activities completed per day, average session time, idle to session time ratio, number of sessions per course, number of courses, and percentage of coursework completed at night.
To identify the number of clusters in the k-means cluster analysis, we used Ward’s (1963) hierarchical method (Knight, 2014; Steinley & Brusco, 2007). Based on the resulting dendrograms, we selected the largest number of distinct groups identified for each school year, prioritizing groups with a large enough number of students to have practical significance, more than 1% of the sample. Using this process, individuals were assigned to a group in a manner that minimizes the within-cluster variance of each group. When interpreting the dendrogram, the larger the distance on the y-axis before lines merge, the more distinct the groups. We identified four distinct groups, with the cutoff point at approximately 500 on the dissimilarity measure. The dissimilarity measure we report is calculated based on the Euclidean distance between group means. Last, although we observed similar patterns when conducting the typology analysis year by year, some of the variation picked up by k-means cluster analysis in generating typologies across the 4 years may reflect programmatic and policy changes or differences in student usage of the online course platform over time. In general, this type of analysis is useful for better understanding relationships and patterns that are grounded in the data (vs. in theory or practice). Thus, we consider these to be exploratory analyses, limited by their sensitivity to available data and to researcher decisions about the variables selected for inclusion.
Quantitative Analysis of Student Outcomes
In our analysis of the potential effectiveness of online course-taking in improving student outcomes, we aim to adjust for the selective differences between students who take courses online and those who do not and for factors that affect types and intensity of use over time in models examining associations between how the online instructional system is used and student outcomes. In particular, we control for student “baseline” demographic characteristics and academic status and experiences (described above), as well as important time-varying high school characteristics. Our primary estimation strategy employs panel data models, where we pool data across the four school years (2013–2014 through 2016–2017) and adjust for stable student, school, grade, and year factors (fixed effects) to identify the average effects of online course-taking in high school. More than 38% of high school students in our sample took at least one course online during high school, and of those taking courses online, close to two thirds did so in only 1 year; another quarter took courses online in 2 years, and the other 12% took courses online in three or more years of high school.
In a typical fixed effects model for estimating average effects of online course-taking on student-level outcomes in a given school year, we would estimate

where Ajst is the achievement/intermediate outcome of student j attending school s in year t; Djt is an indicator if the student accessed instruction online in year t; X1jt are student characteristics at the start of the school year in which instruction is accessed online (including student demographics, percentage of students absent in prior year, special educational needs, etc.); Ajst− 1 is the prior year assessment/outcome measure; P is the percentage of students in a given school who access online instruction (as shown in Table 2); π s is a school fixed effect that captures school attributes that are stable over time; μ gt are grade by year fixed effects, and ε jst is the random error term.
In the above model, the coefficient on the online instruction variable indicates, on average, if there was an association (positive or negative) between online course-taking and student intermediate outcomes in these settings, controlling for student characteristics and time-invariant school and/or classroom and grade year effects, as well as time-varying rates of online instruction use in schools. This model would only identify effects of online course-taking if it was reasonable to assume that no other unobserved, time-varying factors influenced online course-taking and student educational outcomes (the conditional independence assumption).
With longitudinal (panel) data that we employ in our estimation (i.e., following students over four school years), we improve on this method of identification by adding student fixed effects to our models as follows, where δj is the student fixed effect:

Identification of the average effect of online course-taking in this model comes from students who take courses online in some but not all years that we observe them in high school (Heinrich & Nisar, 2013), which is the case for many of the students in our sample.
As the assumption that no other unobserved, time-varying factors (at student, school, and grade levels) had influenced online course-taking and student educational outcomes is a relatively strong one, we also estimated inverse probability weighting models with regression adjustment (IPWRA), a double-robust estimator that aims to align the observed characteristics of online course-takers and nonusers at baseline in assessing the relationship of online course-taking and its intensity of use to student outcomes. This doubly robust estimation method uses probability weights from a model that predicts treatment status (i.e., online course-taking or the number of years of online course-taking) to obtain outcome-regression parameters that account for the fact that each student is observed in only one of the potential outcomes. The estimated inverse-probability weights are used to fit weighted regression models of the outcome for each treatment level and to obtain predicted outcomes for each student. Average treatment effects (ATE) are then computed from these estimates of treatment effects.
The multivalued treatment model that is used to estimate the effects of intensity of online course-taking is shown in Equation (3). Again defining Dt,i as a binary variable that equals 1 if student i is in a given treatment state and 0 if not, the model we estimate is as follows:

In the above formula,
Qualitative Analysis of Implementation
In qualitative analyses, we employed a constant comparative method to explore and explain malleable factors in the implementation of online instruction, as articulated in our logic model and identified in classroom observations and interviews with district staff and teachers. We developed analytic codes from our research questions and logic model, and subsequent code trees and data were then input into NVivo, a qualitative coding software. The parent codes and sample child codes included the following:
Digital tools (hardware, software, connectivity)
Students served
Program goals
Program model (environment/setting, access, curricular content, instructional model, interaction, student engagement, digital citizenship, instructor engagement, assessment)
Staff (role, capacity)
Impact (academic, other outcomes, capacity, structural changes)
Three qualitative team members manually coded all narrative vignettes, comments, and notes from observations in NVivo. We then cross-coded excerpts to establish reliability and examine any discrepancies. Manual coding was layered over auto-coding, where sections of the observation data were placed into codes (or “nodes”) via the auto-code function based on relevant constructs, and the team reviewed the auto-coding process for accuracy and alignment to the code tree. Following manual coding of these data, analytic memos were developed using an iterative, deductive process to identify and analyze emergent themes within key analytic codes. Analytic memos focused on emergent themes such as access, instructor capacity, and student-centered instruction.
We employed a tightly integrated, mixed methods approach (Burch & Heinrich, 2015), in which emerging findings from the qualitative and quantitative analyses were regularly shared and combined over the course of the study both within the research team and with our district partner. This aided in optimizing sampling strategies for observations, improving the sensitivity and validity of our measures, refining our conceptual and empirical models, and deepening our understanding of the relationships of online course-taking to student learning and outcomes. Accordingly, we integrate the discussion of qualitative and quantitative results below, reflecting how these analyses have proceeded jointly and enriched our interpretation of the data.
Results
Who Takes Online Courses, and How Intensively?
Table 2 shows that the proportion of high school students in the district taking online courses in a given high school ranged considerably by school, as well as within high schools over time, from 0 to a high of more than 93%. Interviews with district staff and teachers pointed to numerous factors that might influence the proportion of students participating in online course-taking, including administrative decisions about the types of educational programs offered at schools and the staffing and management of online instruction, the student bodies served, and policy changes in the district over these years that addressed who should be directed to take courses online. Sometimes substantial swings in the proportion of students taking courses online were related to administrative (e.g., principal) changes or space or staffing constraints. In addition, several of the high schools with the highest rates of online course-taking serve particular student populations, such as pregnant and parenting students and those returning to the classroom from incarceration or expulsion (the latter with 85% to 93% of the student body taking courses online over the four study years). Indeed, descriptive statistics confirm that the highest proportion of online course-takers were in alternative schools (on average more than 31% of their student body), with citywide specialty schools the next highest proportion (more than 11% on average). In addition, nearly all students using the online instructional program were in the same three (of eight) school zones that follow the district’s early calendar year start time, and a number of the high school zip codes with relatively higher proportions of online course-takers are in inner-city, high-poverty areas.
Table 3 presents the results of the logistic regression estimated to predict student use of the online instructional program over time (with pooled data), including school, grade, and year fixed effects. Among the student characteristics examined, a student suspension increased the odds of online course-taking by approximately 15%. With regard to student characteristics, Asian students, English language learners, students with disabilities, and those absent more frequently were less likely to take any courses online, although measures of their prior educational performance were relatively stronger predictors of online course-taking. In particular, students who failed a course in the prior year had 126% higher odds of taking a course online, affirming the “credit recovery” focus of online instruction in the district. This emphasis is also suggested by the fact that the odds of online course-taking increased as a student entered higher grades and were 101% and 89% higher, respectively, in Grades 11 and 12 than in Grade 9. The separate year-to-year logistic regressions predicting online course-taking for each of the four school years showed the same statistically significant patterns of relationships. The odds of course-taking associated with a course failure in the prior year were highest (186% higher) in the most recent (2016–2017) year.
Logistic Regression Predicting Student Online Course-Taking, 2013–2014 to 2016–2017 School Years
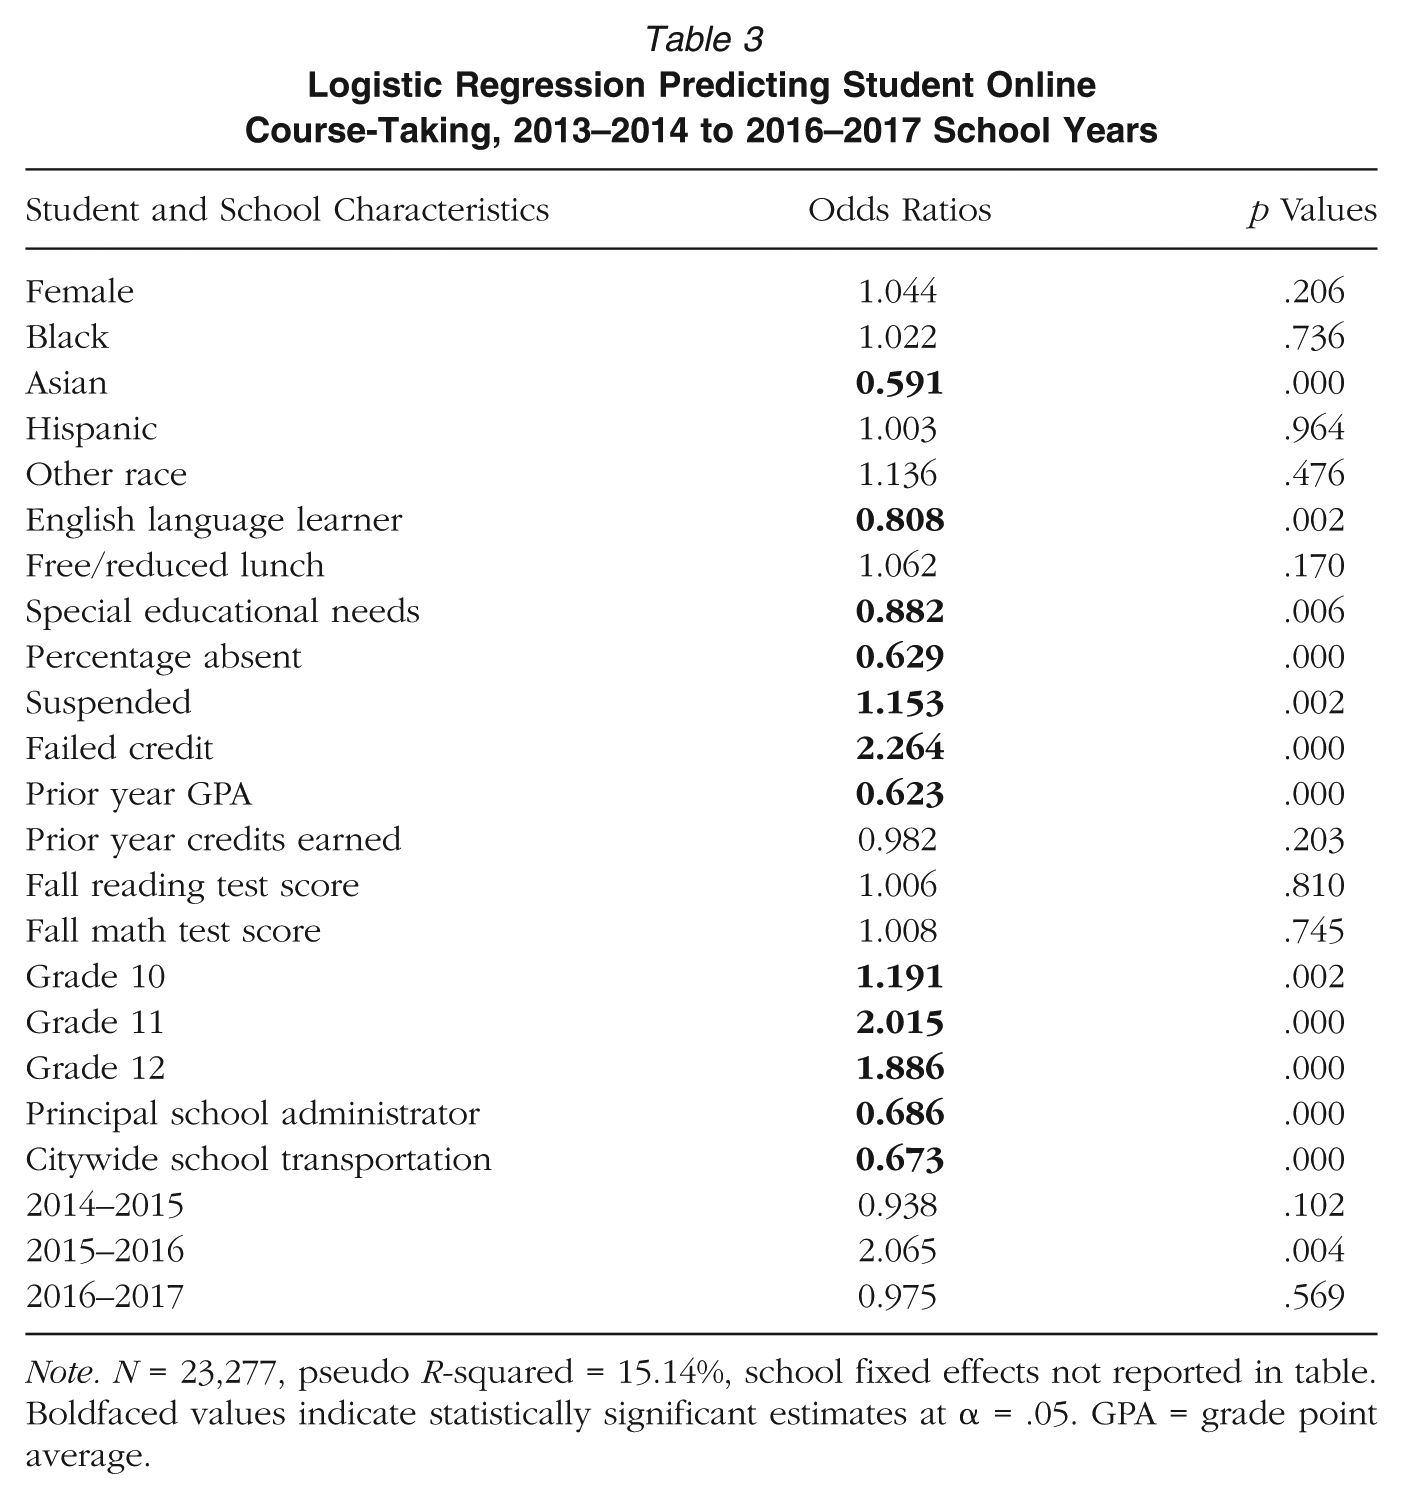
Note. N = 23,277, pseudo R-squared = 15.14%, school fixed effects not reported in table. Boldfaced values indicate statistically significant estimates at α = .05. GPA = grade point average.
We found that including school fixed effects accounted for more of the between-school variation than including specific measures of school attributes, with the exception of measures indicating whether a principal was the lead administrator in the school and citywide school transportation. These were (separately) statistically significantly, negative predictors of online course-taking in high schools and were thus retained in the models. The school fixed effects coefficients showed that students in the alternative high school that serves those transitioning back from incarceration or expulsion had the highest (about 3,400% higher) odds of online instructional program use among high schools in the district.
As noted earlier, we also predicted the number of years of online course-taking by a given high school student (0–4 years) using a multinomial logit regression with school fixed effects. These results, presented in Table 4, show that students taking online courses for 1 to 3 years (vs. no years) were statistically significantly more likely to be Black and economically disadvantaged (eligible for free or reduced lunch), although these demographic characteristics did not predict online course-taking for 4 years. Prior course failure is still the strongest predictor of online course-taking for each category (other than some specific schools), with the odds increasing steadily each year to nearly 700% greater odds for students taking courses online for 4 years. In light of this finding, we also predicted the probability that students ever failed a course during the time we observed them in high school, including demographic characteristics and school fixed effects. These results indicated negative, statistically significant associations between being female, Asian, and a student with special needs and course failures, and positive, statistically significant associations between course failures and being Black, Hispanic, other race, an English language learner, economically disadvantaged, suspended, and a higher proportion of school absences. In other words, the students being directed to take courses online—or being grouped into online learning labs after failing courses and segregated from their peers who were performing better—are more likely to be poor, students of color, English language learners, and those missing school for disciplinary or other reasons.
Predicting Total Years of Student Online Course-Taking, 2013–2014 to 2016–2017 School Years

Note. Full results available from authors (school fixed effects not reported in table). Boldfaced values indicate statistically significant estimates at α = .05. Pseudo R-squared = 11.14%. GPA = grade point average.
How Are Students Using the Online Instructional Program?
In addressing our second research question concerning how students interact with the online course instructional program, we examine student user behaviors in course sessions to better understand the use and implementation of online course-taking and inform policies and strategies at district, school, or classroom levels for improving student use and educational outcomes. This approach also recognizes the potential for diverse types of student users that could mask important variation in associations between online course-taking and student outcomes. Using all 4 years of student data (approximately 7 million observations) in the k-means cluster and discriminant function analysis, we identified four typologies of student users that we characterize as follows: engaged users, moonlighters, nominal exerters, and incompatible users. Below, we describe these four groups of student users in terms of their course-taking behaviors. Table 5 presents descriptive statistics on these user behaviors, as well as the types of courses taken online and students’ demographic characteristics by user type.
Course-Taking Behaviors, Courses Taken, and Student Demographics by User Type, 2013–2014 to 2016–2017

Note. M = mean; SD = standard deviation.
Focusing on the first seven rows of Table 5, distinct patterns emerge in user behaviors across the four user types. The engaged users (the largest of the four groups) and moonlighters both have longer course durations and time in their course sessions, and they completed more activities per day (on average) and spent less time idle in the online course-taking system. The primary distinction between the moonlighters and engaged users (reflected in our labeling of the user groups) is that the moonlighters were working on their online courses mostly outside the regular school day (more than 80% of their time in online sessions). The nominal exerters were comparatively less productive users of the online course-taking system with close to half of their time in sessions spent idle (not interacting with the system) and less than half as many sessions per course as the engaged users and moonlighters. The fourth and final group, the incompatible users, was the smallest group and was only identified in the analysis in the first of the four school years (2013–2014). The incompatible users took only one course on average, spent the least amount of time in their course and online sessions, and completed the fewest number of activities in their courses per day.
While the incompatible users were especially ineffectual in their online course-taking, we observed high idle/session time ratios of 0.21 or greater across all four user groups. The following excerpt from a classroom observation describes a typical online course-taking session of a student with a high proportion of idle or unproductive time in session: The student entered a direct instruction lesson on scenes in Romeo and Juliet, but his cell phone was also in his hand, and he was texting. Some announcements were coming in loudly over the PA system, and students were walking around. The student toggled between his phone and the lesson on the screen, texting while the lecture played and talking to a student nearby. He was playing a game on his phone and attending less and less to the lecture. The instructor came by and told him to take notes, but he did not follow through.
The student in the above observation had full access to the technology and instructional environment, and there was an instructor encouraging the student to work effectively. The student demonstrated a preference for the content available through his cell phone over the video lecture, however, and as we frequently observed, the instructor was ineffective in minimizing this distraction. District policy did not allow teachers to take away phones, but in the 2014–2015 school year, some schools started using cell phone pouches that allowed teachers to lock phones inside, so students could hold onto but not access their phones. Teachers reported initial increases in course progress that filtered off as students learned how to open the pouches.
The demographic characteristics of the different user groups and the types of courses they were taking online (see again Table 5) also shed some light on the distinctions among them. For example, more than 60% of the incompatible users were underclassmen (in 9th and 10th grades), and higher percentages of them were taking math and language arts courses (about half in total) versus electives. We frequently heard in interviews with classroom instructors that they believed this younger group of users was less compatible with the online course-taking system: Some of the underclassmen are in here all day and it is not working very well; underclassmen do not appreciate the opportunity of making up classes. They do not work. . . . They are not at the reading level of the program. They shouldn’t even take 9th and 10th graders, because they aren’t motivated to finish. The [online instructional] program . . . started with 9th grade repeaters, but juniors and seniors progress better because they are more motivated to get out. [Older students] aren’t as distracted by phones, music, etc., because they a) have been out there [and] are super motivated to graduate, and b) developmentally are more ready to focus, just with their brains.
Recognizing that underclassmen were often unprepared academically and seemingly less motivated to make progress in their online courses, the school district began discouraging (and disabling) online course-taking among 9th and 10th graders, which aligns with our finding that this user group no longer emerged in the cluster analysis after the 2013–2014 school year.
There are other important demographic differences across the four user types as well. The nominal exerters were absent more frequently, were more likely to have special educational needs, were more likely to be Black and male, and, across the four groups, they were the least well-prepared academically in terms of their baseline (fall) reading and math scaled test score averages. Alternatively, the moonlighters were the least likely to qualify for free or reduced priced lunch, least likely to have special educational needs, and were the most academically prepared for online course-taking. Moonlighters spent the longest time on average per course session (nearly 100 minutes), which likely reflects their ability to consistently access the online course system outside of school (unconstrained by bell schedules) and also their slight advantage socioeconomically. The more academically disadvantaged students, alternatively, were less likely to engage with and progress in online courses. As we discuss further below, instructor capacity and willingness to support students in online course-taking outside of regular school hours also likely affected students’ ability to make progress in online courses outside of school.
Associations Between Student Online Course-Taking Behaviors and Course Performance
Table 6 summarizes the results of fixed effects regressions (pooled across the four school years) that adjust for student, school, grade, and year fixed effects in assessing the relationship between course-taking behaviors and students’ online course performance—course pass rates, on-time completion of courses, course grades, and the rate at which courses were disabled by instructors—over time, while also controlling for student demographic characteristics (see the specific measures in Table 3) and prior test score performance. The results show a number of strong, consistent (statistically significant) predictors of online course outcomes across the four course performance measures and years. Students who spent more time in their courses and completed more activities per day (fitting the profile of the engaged users) appeared to be more successful in online course-taking and were less likely to have their courses disabled for lack of progress. Alternatively, the higher the proportion of time that they spent idle in their course sessions, the worse they did in all course outcomes. For example, for each additional percentage point of time idle, on average, course pass rates fell by about one third of a percent and on-time pass rates by about one fifth; this is relative to average course passing rates of about 30% and on-time pass rates of about 17% across the four school years. Course grades (on a scale of 0–100) were about 0.42 points lower for each additional percentage point of time idle.
Relationship of Student Online Course-Taking Behaviors to Course Performance

Note. Standard errors in parentheses. Estimates from fixed effects regressions (with student, school, grade, and year fixed effects). Coefficients in boldface are statistically significant at α = .05.
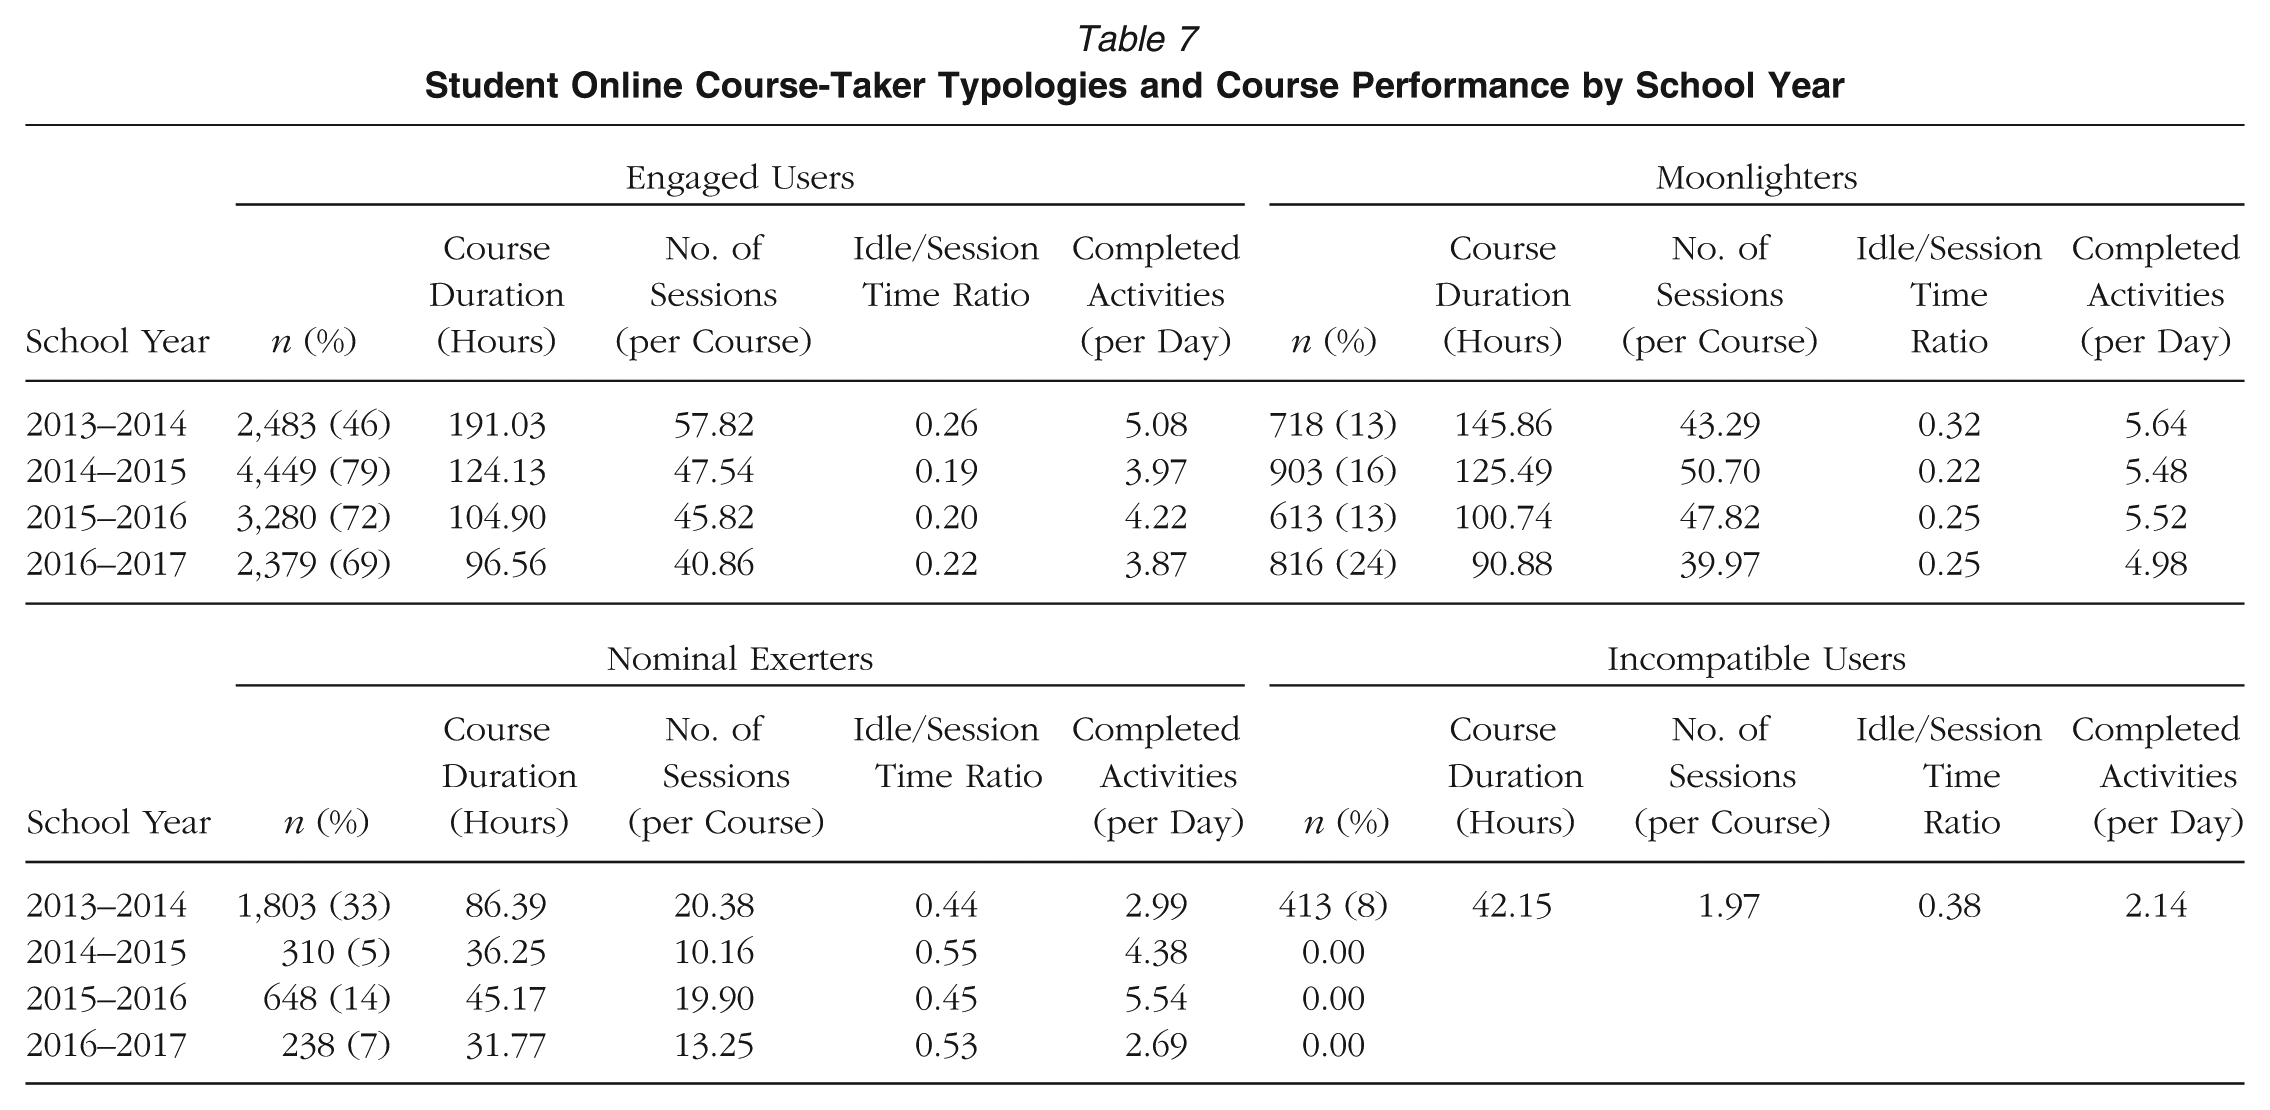
Table 7 shows how these critical student course-taking behaviors changed over time by the four typologies of student users identified. It is notable that for the three groups identified in each of these school years, the course duration (in hours) steadily declined, and students were completing their courses in fewer sessions. Activities completed per day also declined, which would be expected with fewer hours spent in online courses. The analyses presented in Table 6 showed that these three course-taking behaviors were associated with better online course outcomes, and online course performance (e.g., passing rates and on-time completion rates) were continually improving over time. It is plausible that these patterns could reflect more efficient use of the online course-taking system over time; the fraction of all students falling into the nominal exerters category declined from 33% in 2013–2014 to only 7% in 2016–2017; the incompatible users fell out of the classifications as a group, and the moonlighters (engaging in most of their online course sessions outside the school day) nearly doubled over this period. Another possible explanation relates to a substantial increase over time in the proportion of students taking and passing course pretests—from passing rates of 26% in 2013–2014 to 67% in 2016–2017—which allowed students to “test out of” and bypass some or all parts of course instruction (and thereby complete courses in fewer sessions). This raises the question of whether course passing rates imply mastery of content—that is, learning that would be reflected in other measures of academic progress. We turn now to further explore how these student interactions with the online course-taking system affected students’ academic progress and intermediate academic outcomes, comparing online course-takers over time (in traditional and online courses) and with students who did not engage in online course-taking in high school.
Student Online Course-Taker Typologies and Course Performance by School Year
Associations Between Online Course-Taking and Intermediate Academic Outcomes
As discussed above, with panel data available (over 4 years) and variation in online course-taking within students and schools over time, we estimated fixed effects models to examine associations between online course-taking and intermediate academic outcomes. These models allow us to adjust for stable student, school, grade-level, and year factors, while controlling for other student characteristics, pretreatment measures of the outcomes, and time-varying school characteristics, including the percentage of online course-takers in each school (see again the covariates in Table 3). Panel A in Table 8 presents the fixed effects and IPWRA estimates of average effects (associations) of any online course-taking to test scores, GPA, and credits earned at the end of the school year, along with standard errors (statistically significant coefficients in bold). As seen in Panel A, the average associations between online course-taking and intermediate outcomes are mostly negative, although only the associations between math and reading test scores and online course-taking are statistically significant. The fixed effects and IPWRA estimates are highly comparable. They suggest that, on average, online course-taking is not benefitting students or reflecting real learning, and some students may even be set back in their learning (as suggested by lower average test scores).
Estimated Average Associations Between Online Course-Taking and Student Intermediate Academic Outcomes

Note. Estimation methods are fixed effects regressions and IPWRA. Data provided are coefficient estimates with standard errors in parentheses. Coefficient estimates in boldface are statistically significant at α = .05. IPWRA = inverse propensity score weighting with regression adjustment.
In light of instructors’ comments about the incompatibility of the online course-taking system for underclassmen and the district’s change in policies to discourage use among 9th and 10th graders, we also estimated fixed effects models with interactions between online course-taking and grade level (distinguishing 11th and 12th graders from the underclassmen). These results (see Panel B in Table 8) show negative and statistically significant average associations between online course-taking and all four intermediate outcomes. The interactions between online course-taking and the indicators for 11th and 12th grades, however, are positive and statistically significant for credits earned and GPA. When combining the treatment and interaction estimates, the associations between online course-taking and these two outcomes are positive: 11th graders earned 0.236 more credits and 12th graders earned 0.192 more credits on average in online course-taking, and their GPAs were accordingly 0.06 grade points (11th graders) and 0.098 grade points (12th graders) higher on average, as failed courses were replaced with online course grades. Alternatively, the results of these models appear to substantiate the finding that there were no significant increases in student learning through online course completion, as measured by their reading and math (scaled) scores at any grade level.
In our final empirical analysis, we examine how intensity (number of years) of online course-taking in high school is associated with student intermediate outcomes, using the doubly robust IPWRA estimation approach that adjusts for selective differences in the level of course taking (0–4 years). In Table 4, we showed that students taking online courses for 1 to 3 years (vs. 0 years) were statistically significantly more likely to be Black and economically disadvantaged, although prior course failure was the strongest predictor for all levels of online course-taking. The findings of this analysis, presented in Panel C of Table 8, show increasingly negative and statistically significant associations between more years of online course-taking and academic outcomes, where students taking courses online for 4 years (vs. 0 years) appear to experience the largest penalties (particularly in terms of GPA and test scores). This subgroup of students (taking courses online all 4 years) constitutes about 1.25% of all high school students and 6% of the online course-takers over this period (in this district) and, therefore, represents an extreme form of ability grouping of academically struggling students who were confined primarily to an online instructional environment that provided few supports for their learning, as the qualitative findings suggest below. These larger estimated negative effects on student achievement associated with online course-taking in all 4 years (−0.194 SD [standard deviation] for math scaled scores and −0.161 SD for reading scaled scores) also align with the findings of Ahn and McEachin (2017), who examined patterns in student achievement outcomes in e-schools and found that e-school high school students performed worse on standardized tests (−0.230 SD for math and −0.128 SD for reading) relative to their peers in traditional classroom settings.
Insights From Qualitative Analysis on Lack of Student Academic Gains
The classroom observations and interviews with teachers, as well as discussions of the findings with district staff, suggested possible reasons for the lack of positive (and some negative) associations between online course-taking and student achievement. One consistent concern reported in teacher interviews was the low reading levels among students directed into online course-taking. One teacher indicated that many students enrolled in the courses were at 3rd- to 5th-grade reading levels and that the mismatch between their reading levels and the level of reading required in the online courses was a “big demotivator.” In addition, for students for whom English is a second language, teachers found that the language accommodations in the online course-taking system were not adequate. A teacher pointed out that the translation function in the system occurs in text (not voice) format, so students have to be able to read the text while the online instructor is talking in English. However, it is more often the case that students understand the spoken language but do not know or learn the written (native) language.
Another recurrent challenge was the apparent lack of accommodations in the online course-taking system for students with special educational needs. Teachers indicated that they typically did not have access to information about student individual education plans (IEPs) or extra resources to support their needs; as one teacher explained, I have someone with an IEP in my second hour . . . nothing in [the online course-taking system] really accommodates them. They expect the teachers to accommodate them.
Some instructors made efforts to meet these students’ needs, particularly if they had experience or training in special education. For example, one teacher printed the transcripts of online videos and had students highlight them, while another found practice tests and worked with students outside the online system on content support. Several teachers also mentioned a resource room where special education students could work on online courses with their IEP teacher, although this depended on whether the IEP teacher possessed technical knowledge required to support use of the online course-taking system: I think that many of the special ed kids are frustrated. I have a very good relationship with my special ed teacher, so a lot of the kids that have me for class go to the resource room to work on this. She is also trained [in the system] and has her own account, which makes a difference.
We also saw many student behaviors that suggested a lack of engagement in the learning process, such as the following examples from classroom observations: The student did not interact much at all with the software (i.e., didn’t progress through the screen). The aide checked in with her at the beginning of class and told her to get going, that “she is smart and can do it.” There was no direct interaction with a teacher after that point. The student just talked to another student next to her. The student would click on a screen when the teacher walked by, otherwise she would just stare at the screen and talk with her friend. The student spent some of the class period with videos running and answering problems, but she was easily distracted. She talked with classmates, used her phone, and did not have headphones in to hear the audio. She made minimal progress in the videos. After filling in answers to the assessment (mostly incorrect), she went up to the teacher’s desk multiple times for a list of questions that were wrong before changing them (randomly?) and going back to check again.
Other students appeared to be somewhat engaged in getting through their online courses, but not necessarily in learning. We observed distinct differences between active and passive engagement among students, where in the latter case, they moved through the program, sometimes taking notes, but not necessarily engaging with the content, as shown below: The student was working on a lesson on the Mongol Empire when the observation began, reading a source document and taking notes. He entered an assessment mode (about halfway through the observation) and went to Google to search for answers to the questions. In some cases, the student copied and pasted the exact assessment question into Google to find the answers. The student works quietly in the corner of the room away from other students. She progresses through the assessment, using the Internet to find answers. She copies and pastes some content from Wikipedia. At about the 20-minute mark, the student asks the teacher to check her work, which she does. The teacher tells her to change the answers to two questions. The student goes back to the Internet to find the answers.
Observations such as these raise the question of whether the goal of online credit recovery is to simply provide students an opportunity to earn credits needed to graduate, or whether an important aim is to provide an alternative instructional environment and flexibility for students who may not have been successful in a traditional classroom setting to master content needed for life after graduation. These findings also raise concerns about whether students taking courses online are learning at the same level as those in traditional classrooms as they earn course credit. Two teachers, both with substantial (multiyear) experience as instructors in online course-taking classrooms, commented on the low attendance rates in the online instructional settings, which both pegged at about 25%. One of these instructors was very direct in stating “the students aren’t learning anything” [in their online courses].
One of the barriers to students mastering content in the online setting may relate to the fact that some classroom instructors struggled to help students when they were challenged in their online courses, particularly in subjects outside their content expertise. In an interview, one teacher explained her difficulty with providing math support: As a non-math person, I find it difficult. I can do it if I watch the whole video, but I don’t have the time to watch the entire video to answer the questions with a student.
We observed a lack of math content expertise limiting the efficacy of instructor assistance more often than in other subjects. In response to this concern, some schools have placed content teachers in lab settings where online courses are accessed, and one school grouped course subjects by period so all students were working on math modules that session, allowing content teachers to come in and provide extra instructional help to more students. To date, the efficacy of this strategy has been mixed. For example, in one observation, the content teacher was reported to be effectual and engaged, while another sat in a corner working on his own stuff, and a third just gave the students the answers.
Finally, for some of the students, academic progression may be a secondary aim to the implicit goal of the online instructional program in providing a “safe space” for students who might otherwise not be in school. This theme came out in observations and interviews, particularly in contexts where lab instructors were managing the intersection of the classroom with students’ complicated lives. For example, one teacher was describing how “these kids have so much baggage and drama in their lives” when a pregnant and parenting youth coordinator came into the room to speak with two of the students. One of the students had only one class to finish but was not progressing well. The teacher pointed to another student who she said had emotional problems and had made very little progress. The student came into the classroom, put her head down, and slept throughout the period without logging onto a computer. The instructor indicated that she was 19 already but at the 11th grade level in terms of her credits and that she would probably “just sit here until she is 21 and will call it a day.” Another teacher explained during an observation that if a student is making progress, she does not harass them. “This lab becomes a place for EBD (emotionally, behaviorally, disabled) students to decompress for a period so they are better able to deal with their other classes.” In fact, some teachers went out of their way to extend support to students outside the regular school day: The teacher will take emails from kids until 9:00 pm at night (and often much later) to unlock or help them progress through a course. He showed me an email from 12:30 am the previous night and said, “If kids are motivated enough to work at home, the least I can do is respond.”
In interviews and research briefings, teachers and other staff suggested that if it were not for the online course-taking option, some of these students would not be in school at all or would be disruptive in the regular classroom. In one classroom observation, a teacher pointed out that a student who was sleeping in the room had completed his courses and had nowhere else to go for the rest of the school year. More than one instructor used the term dumping ground to describe how students came to be placed in their classrooms for online course-taking. Ultimately, analyses of students’ longer-term outcomes, including high school completion and postsecondary education and labor market outcomes, may shed further light on whether, or the extent to which, these students benefit or are harmed through online course-taking.
Strategies Employed in Schools to Improve Online Course-Taking
The school district partnering in this research is aware of many of the challenges and constraints to successfully implementing online course-taking and credit recovery in this context. Through classroom observations, interviews, and research briefings with district staff, we identified specific strategies they are pursuing to address some of the concerns highlighted above and improve online course-taking and student outcomes. These include specific guidelines and directives for implementing online course-taking, for both students and instructors, which were rolled out in the 2015–2016 school year:
Student note-taking during online instructional videos and note-checking by instructors before allowing a student to start a course quiz or test
Expectations for instructors to do weekly check-ins of student progress and complete progress report forms
Regular monitoring of student online course-taking during class periods, such as through a local area network (LAN) system
Disabling courses when students consistently fail to meet progress goals, and requiring them to engage with an instructor to get restarted in the system
Limiting students to taking only two online courses simultaneously
The following excerpts from observations of online course-taking in classrooms illustrate some of these practices: The teacher was emphasizing to the students that they needed to strive for the goal of completing three percent of their coursework per week. He told them to focus more and to take advantage of the resources they have both during and after the school day to work in [the online instructional system]. He asked to see their notes when they requested access to an assessment (quiz).
By setting weekly progress goals in conjunction with weekly one-on-one student-teacher check-ins, teachers provided students regular feedback and directed them toward more manageable goals. Indeed, we saw many examples of creative and concerted efforts by teachers to follow the district’s guidance and improve online course-taking supports, including teachers who tracked and encouraged student progress toward goals using charts and incentives (e.g., certificates, rewards) and those who developed their own instructional materials to aid student interactions with the system. One teacher, for example, created a “March Madness” competition for his students in different class periods to motivate their progress toward individual goals.
The process of taking notes can help students in learning content and provide focus for future studying, as well as support their successful completion of online course assessments. The practice of asking students to show notes before allowing access to an online assessment was intended to increase the likelihood that students would view and interact with the instructional content and resources available online and also discourage behaviors such as guessing answers or otherwise attempting to complete the quiz without learning the content. Our classroom observations in the school years since this policy was first implemented suggest, however, that it is inconsistently enforced, and many students simply ignore teacher directives to take notes during instructional videos. In the effort to provide students with more structure for note-taking, one teacher even went as far as to watch the online courses himself and create “guided notes” to help students identify the material in the online instructional videos that would be important to know for the end-of-course assessments.
Students who did not meet goals established by teachers to incentivize adequate course progress often had their online courses disabled, and some were reassigned to an alternative class setting where they could receive more in-person and one-on-one assistance from an instructor. The policy intent was to prevent students from spending extensive time in online courses without making progress toward course completion.
During the session, the instructor told students that if they save a quiz, the answers are locked in and cannot be changed later. He offered to check their answers before they save. He stated: “Everyone is behind, and no one seems to have a sense of urgency.” Another teacher entered the room to make an announcement. He said that students who don’t get to 12 percent by next Thursday will have their accounts suspended. He tells the students that he is available every day from 4–6 p.m. (Mon.–Thurs.) and that [the online instructional system] is available 24/7.
Above, the instructor offered to check student answers before they submitted an assessment. This practice, encouraged by the district, made instructors aware of the questions that students did not answer correctly. On occasion, this led to reteaching and targeted, blended instruction to help students better understand the content underlying the questions they had answered incorrectly. More often, however, instructors told students which questions they had answered incorrectly, in which case some students went back to review their notes, but more commonly, students used a process of elimination to determine the answers (for the questions then known to be wrong).
Limited resources undoubtedly constrained the implementation of these practice guidelines and other instructional supports (e.g., live teacher interactions) for online course-taking. One teacher indicated that she was supposed to have 20 students in the classroom, but that on any given day, she might have as many as 45 students; she reported having 65 students in her classroom the previous year. Another teacher explained how a high student-teacher ratio limited his interactions with students: We need smaller class sizes than we have; I think I could do it well with 35. One class we saw was 74 students; ideally, we would have 25–30 students. We need more time for one-on-one interactions with the students.
Our descriptive analysis of classroom observation data—which revealed a negative association between observed student-teacher ratios and student digital citizenship (i.e., appropriate use of technology)—aligned with this teacher’s insight. A few instructors also described problems using the LAN, explaining that it has not consistently worked with some of the operating systems in use (e.g., Chrome). And in cases where substitute teachers were present but lacking experience with or the ability to log into the online course-taking system or use the LAN, instructional supports might be completely absent, as seen in the following classroom observation: The first thing the sub said as students were coming in was, “I can’t check your work today. I can’t help you.” The sub had no way to interact with the resources, and therefore, had no real interaction with the students.
Observations such as this underscore our strong concerns about the potential for differential access to quality learning experiences between online and traditional classroom environments and the perpetuation of racial and class disparities through ability grouping in online learning environments, given the disparate access to fundamental instructional supports and learning opportunities we have observed in these settings.
Discussion and Conclusions
As online credit recovery programs continue to expand, concerns are growing that a corresponding rise in high school graduation rates may not reflect student learning. For example, a Fordham Institute report pointed out that in the same year that national high school graduation rates reached new heights in 2015, data from the National Assessment of Educational Progress showed that the percentage of 12th graders ready for college-level reading and math declined by 2 percentage points in math and 1 percentage point in reading (Noonan, 2016). Some school districts, such as Los Angeles Unified School District, have explicitly linked their highest graduation rate success to the use of online course-taking. In the large, urban school district where we studied online instruction, the proportion of high school students taking online courses ranged widely across schools, from a low of less than 1% to a high of more than 93%. In addition, our analysis of who is taking courses online identified distinct user groups with very different course-taking behaviors and online course performance. Some of the students facing the most severe barriers to completing high school—that is, pregnant and parenting students, those returning to the classroom from incarceration or expulsion, and those with high absence rates and low reading levels—were among those most likely to be grouped together into classrooms or online learning labs that provided differential access to educational resources.
Our analysis of high school student academic outcomes points to this as a highly concerning form of categorical inequality, given our findings that many high school students are unlikely to gain (or may even be set back) when assigned to take courses online. Students in their first years of high school, not meeting minimum reading-level guidelines, and who were more likely to be repeating a math or language arts course performed more poorly in online instruction. These findings are consistent with the experimental results of Heppen et al.’s (2017) study of online credit recovery in Chicago Public Schools, which found that students who failed algebra in their first year of high school and were assigned to retake the course online attained significantly lower end-of-course posttest scores and lower credit recovery rates compared with those in face-to-face courses. In fact, the district we studied came to recognize that these underclassmen tended to be less motivated and unprepared academically for online course-taking and subsequently discouraged their use of the online instructional system. In contrast, a relatively small group of students who took courses online in 4 years of high school (6% of our sample of online course-takers) appeared to be set back the most by these experiences, with larger negative associations between online course-taking and their math and reading achievement that paralleled those found for students taking all of their courses online (Ahn & McEachin, 2017). One student (18 years old) who was graduating from an alternative school explained that she had taken courses online all 4 years of her high school career and regretted that she had missed out on opportunities for “hands-on” learning. Again, through the lens of categorical inequality, this represents within-school segregation that appears to cut off some of the most academically and economically disadvantaged students from access to better quality instruction and learning opportunities.
Our analysis also explored how students were engaging with online course-taking and whether strategies could be implemented to improve its effectiveness. The k-means cluster analysis distinguished two groups of relatively more engaged online course-takers, differentiated by their completion of more activities per day in less session time and more online courses completed in fewer instructional sessions. Among the student user groups, however, there also appeared to be disparate access to course-taking outside the school day, with greater outside use by students who were not identified as economically and academically disadvantaged. One of the potential strengths of online learning is the opportunity for students to access and learn content outside the traditional school day (Enyedy, 2014). Thus, these findings raise additional concerns about unequal access to devices, Internet, and instructional assistance in out-of-school settings that could support students in progressing toward high school graduation outside of school hours. This flexibility could be particularly important for the many online course-takers in our sample who had substantial family and work obligations and often split the traditional school hours (e.g., morning and afternoon) between education and work.
Furthermore, over the 4 years of study data and observations of the implementation of online instruction, we saw few instances where the use of online instructional programming appeared to support student access to personalized, high-quality instruction. There were minimal opportunities to adjust to or supplement core curriculum and instructional delivery in the online course-taking system, with a lack of accommodations for all students and particularly those with special educational needs. Many instructors also struggled to respond to student requests for content assistance in their online courses, a finding that is consistent with that of Stevens et al. (2016) that also refutes a core argument in support of the use of online technology, that is, that it affords opportunities for increased customization of content and individualization of instruction (i.e., Archambault et al., 2010). Not surprisingly, given these findings, we saw many student behaviors that suggested a lack of engagement in the learning process, such as texting on cell phones, searching other websites, and distracting fellow students. We also observed passive engagement, where students continued to progress through the online program but without engaging with the content—for example, disconnecting from the instructional video audio and then guessing quiz or test answers. In general, we found little in the way of tailored instruction, curricular relevance, or other types of individualization that prior research suggests may enhance student engagement (Cavanaugh et al., 2007; Darling-Hammond & Bransford, 2007).
Our findings also showed that limited resources frequently constrained the implementation of district guidance and other instructional supports, such as live teacher interactions, suggesting that more fundamental changes would be needed to see positive effects on student learning and educational outcomes. While some research indicates that these students may be better served by a blended learning model that incorporates access to more live, personalized instruction to supplement online content (Osguthorpe & Graham, 2003; Picciano & Seaman, 2009) or the integration of complementary (rather than duplicated) live and digital instruction (Means et al., 2010), the resources and conditions required for implementing these instructional models were lacking in nearly all educational settings that we observed. The experiences of students in online course-taking that we observed also suggested that they would need greater involvement of special education teachers, considerably lower student-teacher ratios, and ready access to course content assistance outside of the instructional system to support learning in a wide range of course subjects/topics.
Ultimately, the concerns raised in our research about who is targeted for use of online course instruction at the secondary level and the less enriching and engaging instructional resources and environments made available to them suggest that this isn’t merely an issue of a mismatch between student capabilities for engaging with and progressing in these systems. Our findings should prompt educational leaders to consider whether the expectations for conditions and capacities to be in place for success in online course-taking are reasonable for many large, resource-constrained school districts to attain, and perhaps more important, whether any gains in credit accumulation and graduation rates through investing in the technology and its integration (vs. increasing instructional supports in traditional classroom settings) outweigh the potential unintended costs in terms of loss of learning for the historically underserved students disproportionately participating in them.
Last, it is important to reiterate some limitations of this research. Our findings are based on a study of a single, large urban school district, and although it shares characteristics (e.g., poverty rates, resource constraints, and the race and ethnicity of students) typical to other large urban school districts using this same online instructional program, we do not make any claims about the representativeness of our findings for other such school districts in the United States. The k-means cluster analysis was undertaken as an exploratory analysis and is sensitive to the available data and our decisions as researchers about the variables included. In addition, although we have employed strong quasi-experimental methods facilitated by the panel structure of our data and have strong knowledge of selection into online course-taking through our research partnership with the district and qualitative research, we do not argue for a causal interpretation of our analysis of associations between online course-taking and student academic outcomes. More generally, we acknowledge limitations to the validity of inferences in our quantitative and qualitative analyses.
Supplemental Material
Online_Appendix_MS_18-0006 – Supplemental material for A Look Inside Online Educational Settings in High School
Supplemental material, Online_Appendix_MS_18-0006 for A Look Inside Online Educational Settings in High School by Carolyn J. Heinrich, Jennifer Darling-Aduana, Annalee Good and Huiping (Emily) Cheng in American Educational Research Journal
Footnotes
Notes
C
J
A
H
References
Supplementary Material
Please find the following supplemental material available below.
For Open Access articles published under a Creative Commons License, all supplemental material carries the same license as the article it is associated with.
For non-Open Access articles published, all supplemental material carries a non-exclusive license, and permission requests for re-use of supplemental material or any part of supplemental material shall be sent directly to the copyright owner as specified in the copyright notice associated with the article.
