
Abstract
Using nationally representative parent surveys over a 10-year period, this article asks if there were differences in parent engagement and satisfaction at public charter and district schools. It then examines whether any such differences persisted when accounting for observable school and family characteristics, including whether parents conducted a school search prior to selecting their child’s school. It finds that charter parents volunteered more but, in aggregate, were not more engaged in school-related activities, relative to district parents. In contrast, charter parents reported higher levels of satisfaction than district parents throughout the period. These differences persisted even when accounting for observable ways in which these families and schools differed.
Public charter schools (hereafter “charter schools”) are funded with public revenues but primarily function outside the authority and rules of a school district (Finn, Jr., Manno, & Wright, 2016). Perhaps as a result, they have emerged as one of the most controversial public education reforms of the past half-century. Proponents argue that charter schools decentralize decision making, set the stage for innovation, and enable more dynamic, nimble public schools (Osborne, 2017). Critics argue that charter schools are chaotic and unaccountable and that they draw precious resources from public district schools (hereafter “district schools”) (Ravitch, 2013). In response to this controversy, scholars have sought to determine how charter schools perform relative to district schools. Most of this research focuses on standardized achievement tests or graduation rates (Betts & Tang, 2014; Epple, Romano, & Zimmer, 2016; Wohlstetter, Smith, & Farrell, 2013).
In addition, it is important to study how stakeholders experience charter schools. In particular, parents are central to claims that charter schools function differently. Borrowing the language and logic of the market, charter school advocates imagine parents as consumers whom schools must satisfy in order to maintain market share (Bulkley & Fisler, 2003; Miron & Nelson, 2002). Charter school critics portray this experiment in very different terms: Echoing general critiques of privatization and neoliberalism (Schram, 2015), they suggest that these schools have the potential to increase the precarity of historically marginalized people and communities (Buras, 2014; Ravitch, 2013; Wells, 2002).
Despite these conflicting views about what charter schools mean for parents, few works compare the experiences of parents with a child in a charter school with those of parents with a child in a district school. Research that does focus on parents tends to look at limited geographic areas (usually a single state) at a particular time. Because the charter school sector has evolved over the years, and differs significantly from state to state, it is important to look over a wide area and sustained period of time.
This article contributes by using nationally representative data over a 10-year period to compare levels of parent engagement and satisfaction in charter and district schools. The article begins by further elaborating the role of parents in the theory of charter schools and how this fits with the privatization movement and research in public administration. It then reviews empirical works that have examined whether charter schools foster higher levels of parent engagement and satisfaction relative to district schools. The findings from this literature generally show that charter schools have higher levels of parent engagement and satisfaction. However, because students are not randomly assigned to charter or district schools, it is difficult to know what role self-selection plays in any of these observed differences. Thus, this article considers how a novel set of variables, aimed at capturing differences in family characteristics, experiences, and school-selection processes, may account for charter-district differences in parent engagement and satisfaction. It then specifies its method and data and presents its findings.
In summary, the article shows that charter parents reported volunteering more than district parents. However, in aggregate, there was little evidence that charter schools fostered higher levels of parent engagement relative to those found in district schools. Despite approximately equal levels of parent engagement, charter parents did report higher levels of school satisfaction. Further analysis reveals that these differences in volunteering and satisfaction persisted even when controlling for observable differences in parent self-selection. The article closes by considering what these findings mean for our understanding of charter schools and suggesting directions for future research.
Parents and the Argument for Charter Schools
In the latter part of the 20th century, there was a growing sense among American policymakers and the public that the nation’s public schools were failing (National Commission on Excellence in Education, 1983). Many of the reforms that sought to respond to this perceived crisis—like charter schools and school voucher programs—aimed to improve public education by decentralizing decision making and harnessing the forces of the market (Ravitch, 2013). Initially, the idea for charter schools was that they would serve as temporary experiments for the betterment of district schools (Budde, 1988). Rather quickly, however, charter schools became understood as an alternative, semipermanent type of public school that would compete with district schools for resources and students (Kolderie, 1990; Mintrom, 2003; Ravitch, 2013). In doing so, proponents suggested, charter schools would jolt district schools into change, improving the entire public education system.
In turning to markets and decentralization to solve the education crisis, these early charter supporters were tapping into the emerging—and arguably still dominant—effort to use privatization to alter how government operates (Donahue, 1989). From this perspective, government is inefficient and, without competition, has monopolistic tendencies. Thus, public policy can be improved by contracting out core government services to private-sector actors who, in responding to the demands of the market, will deliver better services to citizens (Donahue, 1989; Verkuil, 2007). Put concisely, government should endeavor to “steer rather than row” (Osborne & Gaebler, 1993, p. 28).
Although the rhetoric of the privatization movement flattens some important nuances about how public sector organizations function, public policy and administration scholars agree that public organizations are constrained relative to their private-sector counterparts (Meier & O’Toole, 2011; Rainey & Chun, 2005). For example, because they must answer to elected officials from varied political institutions, and pay close attention to public opinion, public organizations may be less responsive to change, more focused on processes than outcomes, and less efficient (Bozeman, 2004). In addition, public organizations are thought to be constrained because public leaders and managers have a harder time hiring and firing problematic employees, cannot set intermediate goals, and work in environments with higher levels of red tape (Feeney & Bozeman, 2009; Meier & O’Toole, 2011; Rainey & Chun, 2005).
Born during a surge of interest in privatization—and buttressed by the aforementioned scholarly research on public organizations—it is unsurprising that charter schools, like many recent education reforms, seek to use the logic of the market to solve perceived problems. The task in front of scholars now is making sense of how these experiments have played out in practice. Most efforts to reckon with the performance of charter schools have relied on test scores and graduation rates (Betts & Tang, 2014; Epple et al., 2016; Wohlstetter et al., 2013). However, there has also been interest in comparing the experiences of various stakeholders—such as teachers and principals—in charter and district schools (Gawlik & Bickmore, 2017; Oberfield, 2017).
This article contributes by looking at parents, the “consumers” of the charter school marketplace. Since the dawn of the charter sector, parents have been central to charter theorists’ views of why these schools would be different. Kolderie (1990), one early charter proponent, argued that removing the monopoly that districts had on public schools would prevent them from taking their “customers for granted” (p. 54). In other words, by generating competition among schools, the needs and wants of parents—the people in the best position to assess their child’s well-being (Hill, Lake, & Celio, 2002)—would be elevated. Similar to Kolderie, Shanker (1988) envisioned a system in which, “Parents could choose which charter school to send their children to, thus fostering competition,” driving system-wide school improvement and bottom-up accountability. Nathan (1996), another early proponent, also expected that charter schools would foster tight connections between families and schools based on frequent meetings between teachers and parents. In this way, they would improve student well-being and learning.
Today, parents remain central to arguments in favor of charter schools. For instance, the National Alliance for Public Charter Schools (2018), one of the most prominent charter school advocacy organizations, argues that charter schools “provide families with options in public education, allowing parents to take a more active role in their child’s education.” Also, various states have written their state charter laws with the express intent of fostering higher levels of parent involvement. For example, the Tennessee charter law is intended to “afford parents substantial meaningful opportunities to participate in the education of their children” (as quoted by Smith, Wohlstetter, Kuzin, & De Pedro, 2011, p. 75).
This article is devoted to exploring whether gains in parent engagement and satisfaction have been realized, even when accounting for the possibility that charter school parents may differ from district school parents in particular ways. The next section advances toward this goal by asking why parent engagement and satisfaction are important educational outcomes. Following that, it reviews prior works that assess levels of parent engagement and satisfaction in charter and district schools and articulates two of the hypotheses that this article will test.
Parent Engagement and Satisfaction
Among scholars and policymakers, there is a consensus that parent engagement—the working together of parents and school staff to support and improve student learning, development, and health (Centers for Disease Control and Prevention, 2018)—is strongly related to a host of educational and social outcomes (Epstein, 2010; Henderson & Mapp, 2002; Jeynes, 2012; U.S. Department of Education, 1994; Zimmer & Buddin, 2007). Parent involvement is thought to benefit students by enabling more sophisticated coordination between parents and teachers—drawing parents into the life of the school—and giving parents and teachers more power to monitor student well-being and learning.
Looking across the United States in the 2011-2-12 school year, over 80% of parents attended a general school meeting, over 70% attended a parent-teacher meeting, and around 40% volunteered or served on a committee at their child’s school (Child Trends, 2013). However, parent engagement is not distributed equally across demographic groups: Wealth, Whiteness, and parent education are positively associated with parent engagement (Child Trends, 2013). One explanation for these findings is that parent engagement, like civic engagement more generally, is enabled by resources and their attendant privileges (Verba, Schlozman, & Brady, 1995).
Although it has not received as much attention, parent satisfaction, the level of contentment that parents have with their child’s school, has recently become a more prominent interest for scholars and policymakers (Chambers & Michelson, 2016). This increased attention is coincident with the rise of the school choice movement and growing interest in understanding how parents choose and experience their children’s schools (Buckley & Schneider, 2007). As researchers have begun to explore parent satisfaction, they have found that it is strongly linked to school performance (Gibbons & Silva, 2011). Put simply, parents’ perceptions of schools are a useful indicator of academic quality.
Research also shows that satisfaction is associated with family and student characteristics. For example, Black and Hispanic parents appear to be less satisfied with their children’s schools relative to White and Asian parents (Friedman, Bobrowski, & Geraci, 2006); similarly, married parents are more satisfied than single parents (Fantuzzo, Perry, & Childs, 2006). Parent satisfaction also appears to be linked to student characteristics. For example, the parents of special education students (those with an individualized education plan or IEP) typically report being less satisfied with their child’s school relative to the parents of students without an IEP (Beck, Maranto, & Lo, 2014). Though family and child characteristics are correlated with parent satisfaction, the programs and policies that schools implement also appear to affect parent satisfaction (Bailey, Scarborough, & Hebbeler, 2003).
As noted in the prior section, parent engagement and satisfaction are central to arguments in support of charter schools. With higher levels of autonomy and accountability, charter schools are expected to, among other things, involve parents more, improve educational quality, and generate higher levels of parent satisfaction (Bulkley & Fisler, 2003; Smith et al., 2011). Next, the article evaluates this expectation by reviewing empirical research investigating parent engagement and satisfaction in charter and district schools.
Parent Engagement in Charter and District Schools
Nathan (1996), in an early tour of the charter sector, notes that charter schools are achieving the goal of enhanced parent involvement. Citing research in California charter schools, he finds that charter teachers are discussing strategies for engaging hard-to-reach parents, giving parents ideas about what they can do at home to engage students, and assigning homework that involves parents. In addition, Nathan notes that charter schools are actively getting parents involved in the upkeep and advancement of schools. Another early view on this aspect of the charter experiment, provided by Finn, Manno, and Vanourek (2000), also suggests important gains in parent engagement. In fact, they argue, “If charter schools can declare any clear-cut victory today, it is in the battle against adult disengagement. One of the secrets of these schools’ success is their knack for tapping vast resources of parental involvement” (p. 93).
Becker, Nakagawa, and Corwin (1997) contribute by comparing parent engagement in charter and district schools in California in the mid-1990s. Using a survey of principals, they document higher levels of parent involvement in charter schools. For instance, charter parents were more likely to help or teach in their child’s classroom and work on a school committee or governance board. Mintrom (2003) takes a similar approach by comparing parent engagement in district and charter schools in Michigan in the late 1990s. Using a survey of principals, he finds higher levels of parent volunteering and meeting attendance in charter schools; however, he shows no differences in parent-teacher conference attendance. Zimmer and Buddin (2007) also use principal surveys to assess levels of parent engagement in charter and district schools. Focusing on California, they find that charter principals in elementary, middle, and high schools report higher levels of parental engagement than comparable principals in district schools.
The Becker et al., Mintrom, and Zimmer and Buddin studies focus on only one state; because state charter laws may affect parent engagement (Wohlstetter et al., 2013) and, subsequently, principals’ experiences, Bifulco and Ladd (2006) make a helpful contribution by examining a nationwide survey of principals in charter and district schools. Their findings match with these other studies and suggest that charter schools foster a higher level of parent engagement, especially in primary and middle schools.
Differences in parent engagement have also been studied by looking at the experiences of teachers and parents. Oberfield (2017) uses nationally representative teacher survey data from four times between the 1999–2000 and 2011–2012 school years. The study shows that teachers in charter schools report significantly higher levels of parent support and involvement than teachers in district schools. A working paper from Buckley (2007) focuses on parents’ experiences in charter and district schools. Drawing from a nationally representative survey of parents, fielded in the 2003–2004 school year, the paper compares levels of engagement in public schools that were assigned and chosen; this latter category included charter schools, magnet schools, and other schools of choice. It measures engagement in terms of the number of activities parents engaged in and the hours they spent in their child’s school. When the study controls for location, school, and family characteristics, it finds that parents in public schools of choice reported volunteering more hours than parents in assigned schools; however, these two groups were indistinguishable in terms of the number of activities that they reported.
On balance, this review suggests support for the expectation that charter schools foster higher levels of parent engagement. However, it also reveals some important limitations in the literature: Most of the studies look at one moment in time, focus on a particular state, and look at principals and teachers rather than parents. The Buckley paper, with its focus on parents, is helpful; however, it cannot separate charter schools from other public schools of choice and uses data from over 15 years ago. Another limitation, raised often by charter school critics and observers (Miron & Nelson, 2002; Ravitch, 2013), is that any differences in parent engagement result from the types of parents who select into charter schools. Most obviously, perhaps parents who seek out information on a number of schools, and end up choosing a charter school, are the types of parents who would be more likely to get involved in school life. This possibility, and how the article tries to deal with it, is discussed further below. However, based on the above literature review, and theoretical accounts suggesting that charter schools will engage with parents more, this article tests the following hypothesis:
Hypothesis 1: Parents with a child in a charter school will report higher levels of engagement relative to parents with a child in a district school.
Parent Satisfaction in Charter and District Schools
In addition to getting parents more involved in school life, early theorists expected that charter schools would foster higher levels of parent satisfaction: By building an education marketplace, and empowering parents to make choices in it, parents would be happier with their chosen public schools (Kolderie, 1990; Shanker, 1988). To examine whether this expectation has been realized, this section reviews empirical studies that have examined parent satisfaction in charter and district schools.
To begin, a number of studies have sought to understand the charter experiment by studying parent satisfaction in charter schools. Miron and Nelson (2002) and Miron, Nelson, and Risley (2002) find that charter school parents in Michigan and Pennsylvania reported high levels of satisfaction in curriculum and instruction. Specifically, charter parents were likely to agree that their school had high expectations, accountable teachers and leaders, and, generally speaking, a bright future. Another study, by Finn et al. (2000), notes that two thirds of charter school parents in a multistate sample indicate that their child’s charter school is better than their previous school with regard to class size, school size, attention from teachers, and curriculum. Wohlstetter, Nayfack, and Mora-Flores (2008) examine surveys of charter school parents in California and find high levels of satisfaction with, among other aspects of school life, academic programs, support services, and teachers. These studies are helpful in describing charter parent satisfaction, but they provide little sense of how it compares with district parent satisfaction.
Thus, Buckley and Schneider (2006) contribute by examining charter and district parent satisfaction in Washington, D.C. They find that charter parents grade their schools higher relative to district parents. In response to concerns that this result is driven by self-selection into charter schools, they conduct a propensity score–matching analysis using a model that includes family background characteristics and other potentially relevant control variables. The results of their analysis suggest that self-selection is not driving differences in parent satisfaction. Complicating the picture, they also look at how parent satisfaction evolves over time. Although charter parents are more satisfied initially, they show that these gains recede over a number of years such that, at the end of a 4-year period, there were no differences in satisfaction.
Jochim, DeArmond, Gross, and Lake (2014) examine parent satisfaction in eight cities with high levels of school choice. In general, they find no statistically significant difference in satisfaction between parents with children in a neighborhood district school (i.e., assigned) and those with children in a nonneighborhood school (i.e., a school of choice). Barrows, Cheng, Peterson, and West (2017) examine satisfaction among charter and district parents using two nationally representative surveys. Controlling for various background and demographic characteristics, they find that parents with a student in a charter school are more satisfied than parents with a child in an assigned-district school and around equally satisfied as parents with a child in a chosen-district school.
Gleason, Clark, Tuttle, and Dwoyer (2010) look at oversubscribed charter middle schools that held admission lotteries to allot student seats in 36 schools across 15 states. They find that charter schools positively affected lottery winners’ parent satisfaction. Specifically, winners were 33 percentage points more likely to rate their child’s school as excellent relative to lottery losers. Finally, Tuttle et al. (2013) examine parent satisfaction using admission lotteries into KIPP (Knowledge Is Power Program) schools, a network of charter schools that has achieved impressive levels of student achievement. They find that lottery winners were 6 percentage points more satisfied.
Although it is by no means unanimous, the empirical literature generally supports the claim that parents with a child in a charter school report higher levels of satisfaction relative to parents with a child in a district school. However, there are a number of ways in which the literature is incomplete. Many of the early studies provide information on parents in charter schools but lack a counterfactual or comparison case (i.e., parents in district school). Those that came later satisfy this need, but they tend to focus on a small geographic area or a limited number of cities. The Gleason et al. (2010) and Tuttle et al. (2013) pieces make a major contribution, by zeroing in on the causal effect of particular charter schools, but may not be externally generalizable to the full set of charter schools due to focusing only on schools that were oversubscribed (i.e., popular). Finally, Barrows et al. (2017) use national data to look at parent satisfaction and control for a variety of potential covariates of parent satisfaction—such as parent race, educational attainment, household income, and homeowner status. However, they do not control for differences in parent behavior that might be linked to self-selection (like considering other schools), school-level covariates, and the state in which parents live. This article contributes by remedying some of these deficiencies in the literature while testing the following hypothesis:
Hypothesis 2: Parents with a child in a charter school will report higher levels of satisfaction relative to parents with a child in a district school.
Are Differences in Parent Engagement and Satisfaction Driven by Self-Selection?
The prior section suggests that it is reasonable to expect charter schools to foster higher levels of parent engagement and satisfaction relative to district schools. This article’s first goal is assessing whether there is evidence to support these expectations. If there is, its second goal is explaining why such differences may exist. The most prominent explanation in the literature is that higher levels of parent engagement and satisfaction are artifacts of self-selection or the process of choosing a school, rather than any actions taken by the schools (Buckley & Schneider, 2006). This section fleshes out that argument and concludes with a related hypothesis.
Many observers have argued that enhanced parent engagement in charter schools results from self-selection (Finn et al., 2000; Hamlin, 2017; Miron & Nelson, 2002; Ravitch, 2013). Because parents with children in a charter school made a choice to send them there, the argument goes, they are more likely to be the type of parents who want to be involved in their children’s schooling. For example, Kahlenberg and Potter (2014) argue, Charter schools generally have a leg up in parent involvement. As opposed to district schools that enroll all students within their boundaries, charter schools have only families where someone—a parent, grandparent, aunt, social worker, or friend—was involved enough in a child’s education to apply for the school. (p. 143)
If this argument is right, different levels of parent engagement are driven less by school or teacher practices and more by which families choose charter schools.
Similarly, scholars have suggested that differences in satisfaction between charter and district school parents may derive from the mere fact that charter parents made an affirmative choice (Bosetti, 2004; Buckley & Schneider, 2006). For example, Rothstein (1998) argues, “Because charter school parents and students have chosen to be there, we should also expect surveys to show a predisposition in favor of the charter school, even with no difference in quality.” More specifically, scholars have argued that in choosing a charter school, parents associate themselves with an oppositional identity (Wells, 2002). By defining themselves against district schools, which are old and static, charter parents see their chosen schools as unique, innovative, and special. Another possible reason why self-selection could lead to higher levels of satisfaction in charter schools is an ex post rationalization made by parents (Teske & Schneider, 2001). Since charter parents invested time and energy in the decision-making process, they feel compelled to report high levels of school satisfaction as a way to justify this expenditure.
Finally, there is evidence that in choosing among schools, parents seek student populations that they favor (Buckley & Schneider, 2007). Specifically, parents care intensely about the racial dynamics of the students in the schools that they consider and work to find environments that they think are suitable for their children. By exercising some agency over who their children attend school with, charter parents may have higher levels of satisfaction. However, this satisfaction gain would not be caused by, for example, the practices of teachers and principals.
If accounts like this are true, differences in parent engagement and satisfaction between charter and district schools result from the process of choosing a school, or parent and student self-selection, rather than any programs or policies that the schools are implementing. Without an experiment, it is difficult to know for sure how self-selection affects parent engagement and satisfaction. Nonetheless, this article advances our understanding of the role played by self-selection by controlling for various family characteristics— such as parent-school selection processes—that may distinguish district and charter families. As such, the article tests the following hypothesis:
Hypothesis 3: Higher levels of parent engagement and satisfaction in charter schools are attributable to the characteristics of the students and families who select into them.
Data and Method
To study parent engagement and satisfaction in district and charter schools, this article uses data from the Parent and Family Involvement (PFI) surveys, conducted by the U.S. Department of Education’s National Center for Education Statistics (NCES). 1 Because aspects of charter school life may have changed over time—as schools matured and standard operating procedures were implemented (Buckley & Schneider, 2007; Rothstein, 1998)—it is important to look at parent engagement and satisfaction over a number of years. As such, the article examines PFI survey data from 2007, 2012, and 2016. These cross-sectional (i.e., not panel) surveys, conducted as part of the National Household Education Survey, randomly chose thousands of respondents in each cycle.
In 2007, the NCES administered the survey using computer-assisted telephonic interviewing; in 2012 and 2016, a self-administered questionnaire was sent to respondents via the U.S. mail. The response rates and sample sizes for the survey were 39.1% and 14,080, respectively, in 2007; 57.6% and 17,560, respectively, in 2012; and 49.3% and 10,680, respectively, in 2016. 2 Since the PFI randomly selects respondents—and weights the data to account for sample nonresponse—the surveys provide a nationally representative view of parents’ experiences. More specifically, the PFI can be used to make inferences about U.S. families with a child 20 years of age or younger who is enrolled in kindergarten through 12th grade. This article focuses on families with a child in a public school (i.e., it excludes families that homeschool or have a child in a private school).
Throughout this time period, charter schools were a relatively small, but growing, portion of the national public school universe. Using the NCES’s Common Core of Data, which yearly captures data on all public schools, in the 2007–2008 school year charter schools accounted for less than 5% of all public schools; by 2015–2016 school year, this had risen to around 8%. In 2007–2008, around 3% of the public school population attended charter schools; by 2015, this figure had risen to around 6%. Mirroring this reality, the PFI includes mostly district student parents; however, over the years (as seen in Table 1), a growing proportion of respondents had children in a charter school.
Survey Means
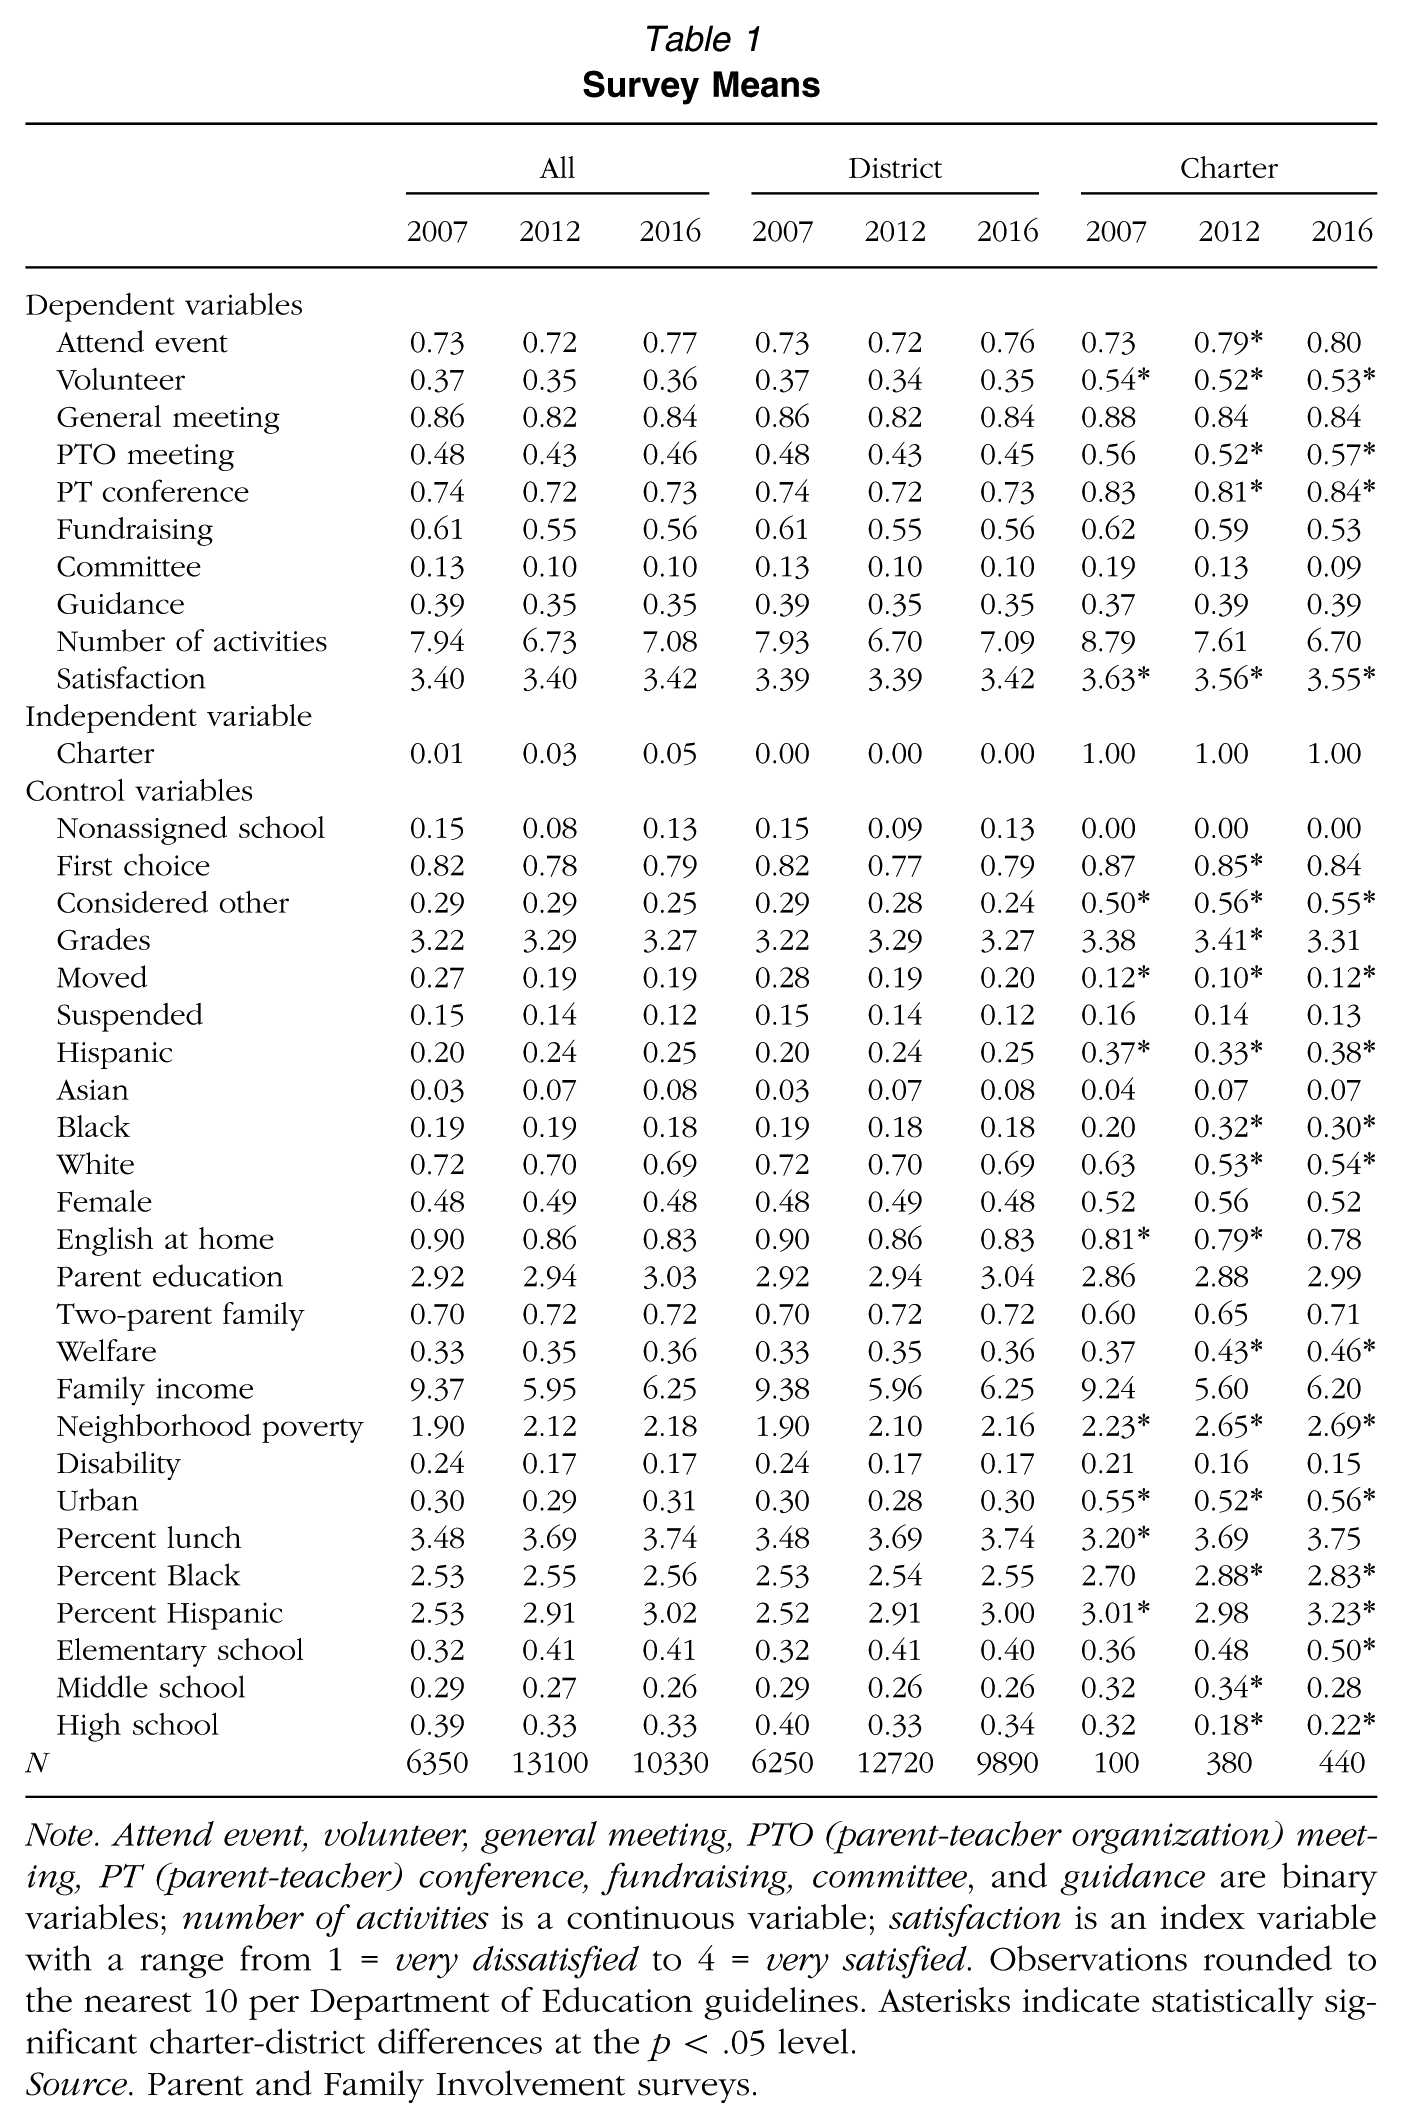
Note. Attend event, volunteer, general meeting, PTO (parent-teacher organization) meeting, PT (parent-teacher) conference, fundraising, committee, and guidance are binary variables; number of activities is a continuous variable; satisfaction is an index variable with a range from 1 = very dissatisfied to 4 = very satisfied. Observations rounded to the nearest 10 per Department of Education guidelines. Asterisks indicate statistically significant charter-district differences at the p < .05 level.
Source. Parent and Family Involvement surveys.
Dependent Variables
Parent Engagement
The first outcome examined in this article is parent engagement, the working together of parents and school staff to support and improve student learning, development, and health (Centers for Disease Control and Prevention, 2018). To study parent engagement, this article examines eight types of parent-school interactions drawn from a set of questions that asked parents: Since the beginning of this school year, has any adult in this child’s household done any of the following things at this child’s school? (1) attended a school or class event, such as a play, dance, sports event, or science fair; (2) served as a volunteer in this child’s classroom or elsewhere in the school; (3) attended a general school meeting, for example, an open house, or back-to-school night; (4) attended a meeting of the parent-teacher organization or association; (5) gone to a regularly scheduled parent-teacher conference with this child’s teacher; (6) participated in fundraising for the school; (7) served on a school committee; and (8) met with a guidance counselor in person.
3
Using responses to these questions, the article examines the dichotomous variables—attend event, volunteer, attend meeting, attend PTO (parent-teacher organization), PT (parent-teacher) conference, fundraising, committee, and guidance—coded 0 if the response was “No” and 1 if the response was “Yes.”
The second way in which it studies parent engagement is by examining the total number of activities reported by parents over a school year. Specifically, it draws from a question in which parents were asked, “During this school year, how many times has any adult in the household gone to meetings or participated in activities at this child’s school?” In response, they could indicate a number from 0 to 99. Responses to this question were coded as indicated by parents and used to create the number of activities variable.
Parent Satisfaction
The article’s second outcome of interest is parent satisfaction, the level of contentment that parents have with their child’s education. Satisfaction is measured with a latent variable, satisfaction, drawn from five questions on the PFI. Specifically, parents were asked, How satisfied or dissatisfied are you with each of the following?: (1) the school this child attends this year; (2) the teachers this child has this year; (3) the academic standards of the school; (4) the order and discipline at the school; and (5) the way that school staff interacts with parents.
4
For each question, parents could respond, very dissatisfied, coded 1; somewhat dissatisfied, coded 2; somewhat satisfied, coded 3; or very satisfied, coded 4. The latent variable adds these responses and divides them by five (to maintain the 4-point scale) such that 1 is the minimum and 4 is the maximum. Across these years, the latent variable had an average scale reliability coefficient (Cronbach’s alpha) of .88.
Estimation and Models
The article’s first goal is to isolate the relationship between school type (charter vs. district) and parent engagement and satisfaction. To do so, the article uses survey-weighted ordinary least squares (OLS) for the dependent variables number of activities and satisfaction, which are continuous, and survey-weighted logistic regression for the attend event, volunteer, general meeting, PTO meeting, PT conference, fundraising, committee, and guidance variables, which are dichotomous. 5 To test Hypotheses 1 and 2, the article estimates the following equation:

where i refers to an individual parent and Y refers to the parent’s reported engagement or satisfaction. Charter, the independent variable, is dichotomous and indicates whether the child’s school is identified by the NCES as a charter school. Z refers to a set of dummy variables indicating the state in which each parent lived (state fixed effects).
X refers to a vector of school-level controls that prior research suggests have a meaningful relationship with the educational experiences of children and their parents (Epple et al., 2016; Wohlstetter et al., 2013). As such, including them in Equation 1 helps show how charter is related to the article’s dependent variables. Urban indicates whether a school is located in an urban area; pct. lunch indicates the percentage of students in the school who qualified for free or reduced school lunch (coded such that 1 = less than 1%, 2 = 1% to 5%, 3 = 5% to 25%, and 4 = 25% or more); pct. Black indicates the percentage of students in the school identified as Black or African American (coded such that 1 = less than 1%, 2 = 1% to 5%, 3 = 5% to 25%, and 4 = 25% or more); pct. Hispanic indicates the percentage of students in the school identified as Hispanic (coded such that 1 = less than 1%, 2 = 1% to 5%, 3 = 5% to 25%, and 4 = 25% or more); elementary school and middle school measure the grades taught at the school according to the following scheme: Schools offering grades K–5 were coded as an elementary school, schools offering grades 6–8 were coded as a middle school. The variable high school, which denotes a school in which grades 9–12 were offered, serves as the reference category for these last two variables. Finally, this vector includes nonassigned, which is coded 1 if a district school is a magnet, vocational, continuing, alternative, special education, or other unassigned school, and 0 if it is a geographically assigned district school (or charter school). Because nonassigned schools often involve an admissions process of some sort, it is important to include this variable to distinguish geographically and nongeographically assigned district-operated schools.
After establishing whether there are differences in parent engagement and satisfaction, while controlling for school and state characteristics, the article then explores whether differences in parent engagement and satisfaction result from parent self-selection (Hypothesis 3). To examine this explanation, the article adds variables that measure family characteristics to its existing model and reports whether any associations between charter and parent engagement and satisfaction remain significant. More specifically, it examines the charter variable using Equation 2:

This equation is the same as Equation 1 except that it adds W, a vector of family and student-level variables that help account for parent demographic and behavioral characteristics. First, it includes the variable first choice, created based on parent responses to the following question: “Is the school this child attends your first choice, that is, the school you wanted most for him/her to attend?” 6 This variable, coded 0 if parents answered “No” and 1 if parents answered “Yes,” is useful as it identifies (1) district parents who have a child in a first-choice school, even if it is a geographically assigned school and (2) parents who selected a charter school that was not their most preferred school. Second, it includes the variable considered other, which captures parents’ responses to the question: “Did you consider other schools for this child?” This variable—coded 0 if parents answered “No” and 1 if parents answered “Yes”—is helpful as it captures a parent behavior that is thought to distinguish some parents: education market savvy or a willingness to explore a variety of different educational options.
In addition, W includes a host of other variables that measure student and family differences and are thought to be associated with parents’ school experiences (Child Trends, 2013; Smith et al., 2011; Wohlstetter et al., 2008, 2013). As with the school-level controls, the inclusion of these variables helps focus our understanding on how charter is related to the article’s dependent variables. Grades indicates the parent’s response when asked what grades the student received during the school year (coded from 1 = mostly Ds and lower to 4 = mostly As); moved indicates whether the family changed residences to attend the child’s school; suspended captures whether the student had ever received an in- or out-of-school suspension; Hispanic, Asian, Black, and White indicate the race and ethnicity of the child; female indicates the child’s sex; English at home indicates whether the child predominantly speaks English at home; parent education indicates the level of education (1 = less than high school, 2 = high school or GED, 3 = some college or technical training, 4 = college graduate, and 5 = graduate or professional degree); two parent indicates whether the child lived in a two-parent household; welfare indicates whether the family received assistance from the following programs in the past year (TANF, state welfare program, WIC, food stamps, Medicaid, CHIP, and Section 8); family income indicates the household’s total income in the past year; neighborhood poverty indicates the percentage of families with children under the poverty line in the family’s zip code (coded such that 1 = 4% or less, 2 is 5% to 9%, 3 is 10% to 19%, and 4 is 20% and above); and disability indicates whether the child currently has a disability. 7
Findings
Table 1 presents the survey-weighted means for the article’s dependent, independent, and control variables broken down by all respondents, district respondents, and charter respondents. 8
The table shows that more charter parents indicated volunteering at their child’s school and, in 2 of the 3 years, attending a parent-teacher conference and a PTO meeting. In addition, in 1 of the 3 years, more charter parents attended a school event. However, there were no statistically significant charter-district differences (at the p < .05 level) in general meeting, fundraising, committee, guidance, or number of activities in any of the years examined here.
The satisfaction means tell a different story: In each year, charter parents reported higher levels of satisfaction than district parents. However, we also see that, as the charter sector expanded from 2007 to 2016, there was an uptick in district parent satisfaction and a downtick in charter parent satisfaction. If these trends continue, we may see a convergence in district and charter parent satisfaction in the near future.
A look at the control variables in Table 1 reveals important differences between the families that attend charter and district schools. For example, in each year examined here, over half of the charter parents sampled indicated that they had considered other schools before choosing their child’s current school; in contrast, the percentage of district parents who shopped around never went above 29%. This suggests an important way that district and charter parents differ, outside the standard socioeconomic characteristics that scholars attempt to control for. Nonetheless, the control data also highlight the importance of these more traditional control variables. For example, more charter families lived in neighborhoods with higher levels of poverty, received welfare, and identified as Hispanic or Black. We also see some differences in school characteristics. In particular, charter schools were more likely to be located in urban areas and have higher percentages of Black and Hispanic students.
To dig deeper into these descriptive statistics, we now turn to a subgroup analysis of parent engagement and satisfaction. Specifically, Table 2 presents findings from an analysis that pooled all respondents over these 3 years and then calculated the number of activities and satisfaction for subgroups within and between these schools. 9
Parent Engagement and Satisfaction: Subgroup Analysis (Pooled)

Note. Number of activities is a continuous variable; satisfaction is an index variable with a range from 1 = very dissatisfied to 4 = very satisfied. Asterisks indicate statistically significant charter-district differences at the p < .05 level (within a column). See the text for information about statistically significant differences between subgroups within a school type (i.e., across rows).
Source. Parent and Family Involvement surveys.
The top row focuses on parent engagement in district schools. Starting on the left we see that White district parents reported engaging in approximately two-and-a-half more school activities per year than non-White district parents. We also see that nonurban district parents reported around one more school activity per year (relative to urban district parents), and college-educated district parents reported over two more school activities per year (relative to non–college-educated district parents). All of these differences were statistically significant at the p < .05 level. The second row, which looks among charter school parents, reveals different point estimates but similar trends. As with the district school point estimates, all of these differences were statistically significant at the p < .05 level.
The third row examines satisfaction in district schools. It shows that White, nonurban, and college-educated district parents were, respectively, 0.07, 0.03, and 0.09 of a point more satisfied with their child’s school relative to non-White, urban, and non–college-educated district parents. All of these differences were statistically significant at the p < .05 level but were not large enough to shift respondents one category on the 4-point satisfaction scale. The fourth row looks at satisfaction among subgroups within charter schools. The difference in satisfaction between White and non-White charter parents was statistically significant; however, there were no statistically significant differences in satisfaction between urban and nonurban charter parents and college-educated and non–college-educated charter parents.
Next, we look within subgroups across different school settings; statistically significant charter-district differences (at the p < .05 level) are denoted with an asterisk. The first column from the left shows higher levels of engagement among White parents with a child in a charter school relative to White parents with a child in a district school. The fourth column from the left shows higher levels of engagement among nonurban charter parents. However, in the other categories (non-White, urban, non-college educated, and college educated), there were no statistically significant differences in engagement between parents in charter and district schools.
Finally, the table shows that charter parents reported higher levels of satisfaction within all subgroups. For example, White charter parents were 0.20 of a point more satisfied than White district parents, and non-White charter parents were 0.12 of a point more satisfied than non-White district parents. Though it is difficult to know how to think of these differences substantively, it is worth pointing out that none were large enough to shift a respondent from one category to another on the 4-point satisfaction scale. At the same time, it is noteworthy that the average non-White charter school parent was more satisfied than the average White district school parent; similarly, the average noncollege charter parent was more satisfied with their child’s school than the average college district parent.
The examination of parent engagement and satisfaction in Tables 1 and 2 is helpful, but it is important to recall that it does not account for school-level differences, including the racial and class demographics of students attending the school. Thus, we now turn to a multivariate analysis (Equation 1) that examines whether parents with a child in a charter school reported higher levels of engagement and satisfaction, relative to parents with a child in a district school, when controlling for school-level differences. One important point as readers seek to interpret these findings: Equation 1 includes a variable (nonassigned), which distinguishes between children who were in a geographically assigned school and those that were not. Therefore, when the below text alludes to charter-district differences, it is referring to differences between parents with a child in a charter school and parents with a child in an assigned district school.
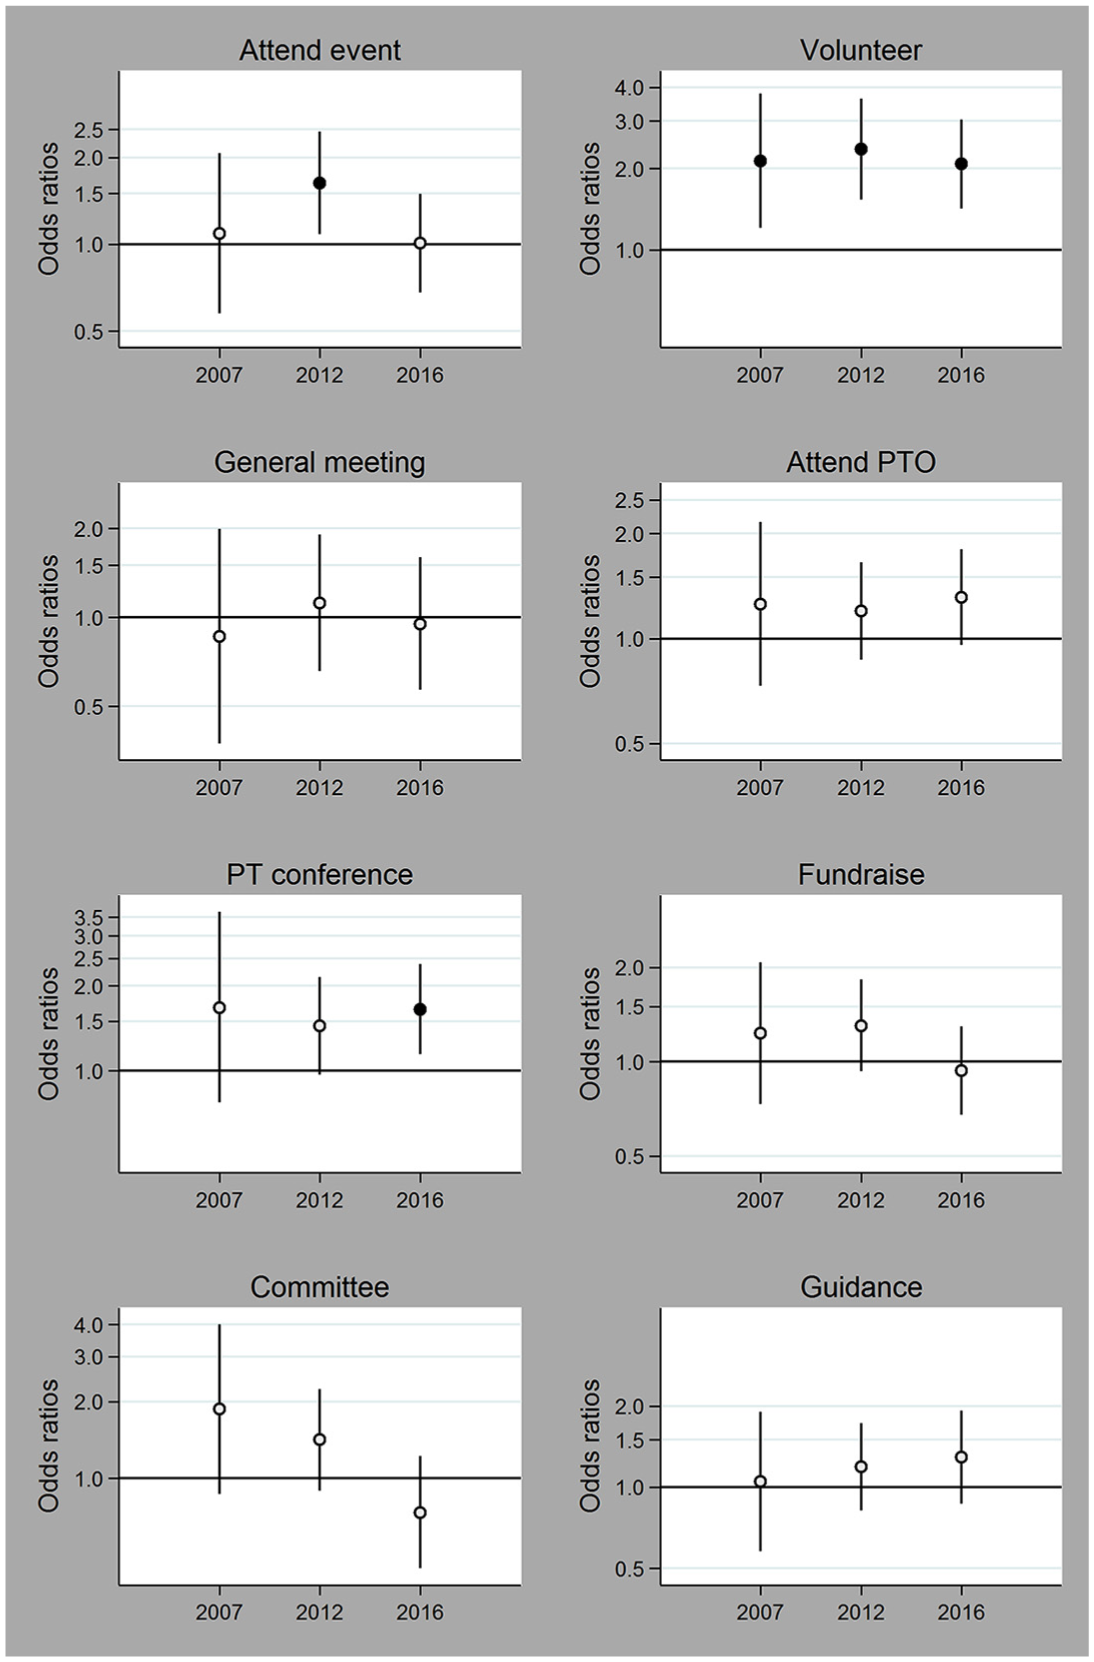
Figure 1 displays the findings from the analysis of the eight types of parent engagement measured on the PFI (for full results, see Appendix Table A.1). Because logistic regression coefficients are difficult to interpret, the figure presents odds ratios; these ratios can be interpreted as gauging the likelihood of an engagement difference between charter and district parents, controlling for all other model variables. The lines extending from the markers indicate the 95% confidence intervals, and darkened markers indicate that a difference was statistically significant at the p < .05 level.

Comparing charter parents with district parents: Differences in types of parent engagement (without self-selection controls).
Figure 1 reveals that in all three years, charter parents were more likely to volunteer in their child’s school. It also shows that in two of the three years, charter parents were more likely to attend a parent-teacher conference. In one year, charter parents were more likely to attend a school event (2012) and attend a meeting of the PTO (2016). However, in half of the areas of engagement (general meeting, fundraising, committee, and guidance), there was no evidence of charter-district differences.
Figure 2 shows charter-district differences in the aggregate number of school activities engaged in by parents (top panel) and differences in satisfaction (bottom panel). Because the variables number of activities and satisfaction are continuous, the figure presents regression coefficients (for full results see Appendix Table A.1). As with Figure 1, darkened markers indicate that a charter-district difference was statistically significant at the p < .05 level.
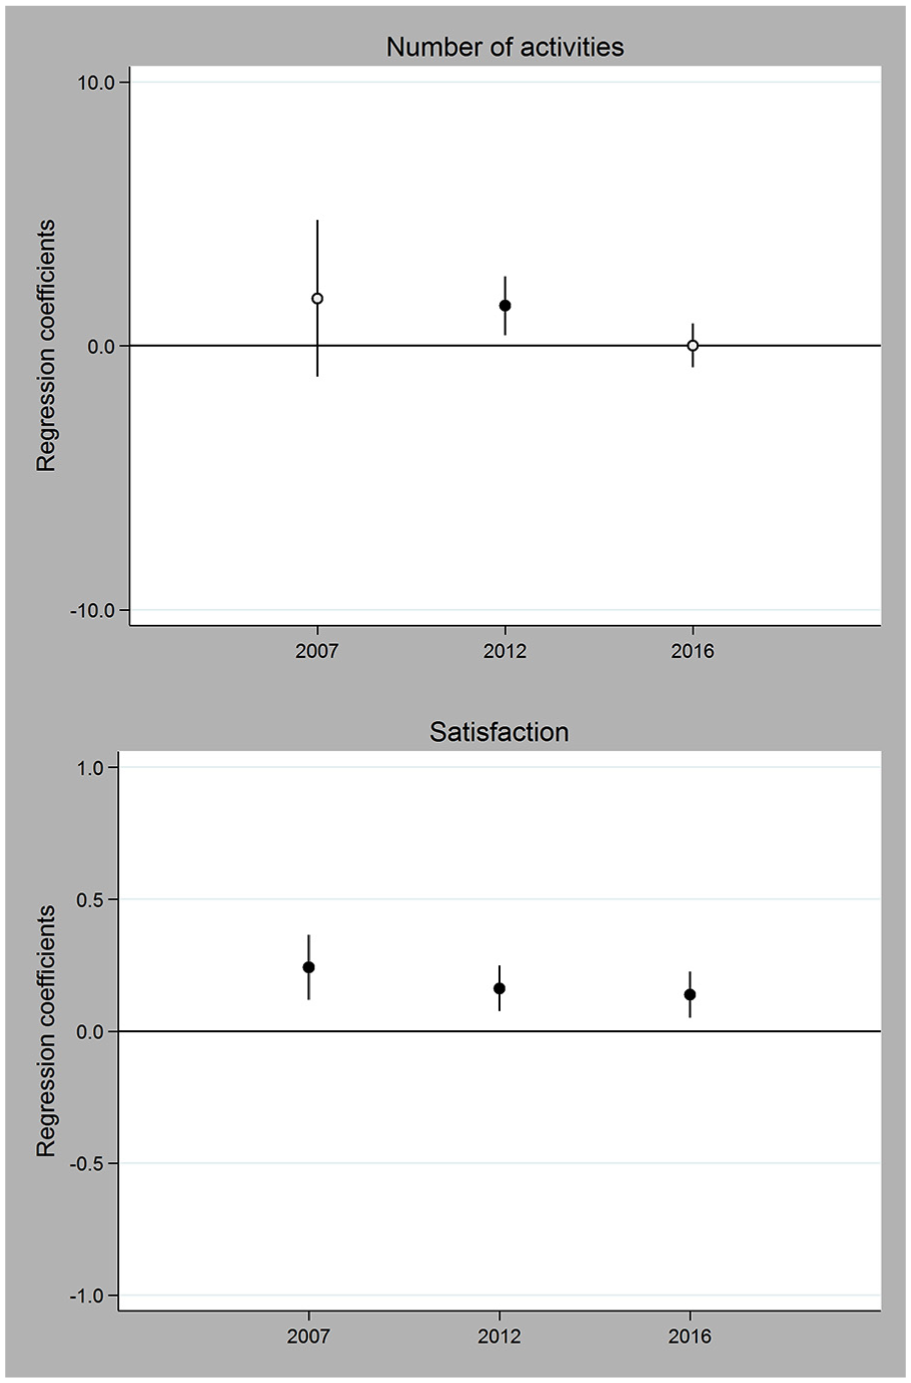
Comparing charter parents with district parents: Differences in the number of parent engagement activities and satisfaction (without self-selection controls).
The top panel shows that in 2012 charter parents reported engaging in approximately one-and-a-half more school activities relative to district parents. To put this in context, this difference is around half of the engagement gap between college and noncollege district parents and White and non-White district parents (seen in Table 2). In the other 2 years examined in Figure 2, there were no differences in the number of activities reported by district and charter parents. 10 The bottom panel reveals that, in each year examined here, charter parents reported higher levels of satisfaction relative to district parents. Specifically, charter parents were, on average, 0.18 of a point more satisfied.
How meaningful is this satisfaction difference? On the one hand, this difference is not enough to shift a respondent from one category to another on the 4-point satisfaction scale. However, in Table 2 we saw that non-White district parents reported 0.07 of a point less satisfaction than White parents and that non-college-educated district school parents reported 0.09 of a point less satisfaction than college-educated district school parents. Thus, the average charter-district satisfaction difference in Figure 2 is around twice as large as the average White-non-White and college–non–college-educated district satisfaction gaps.
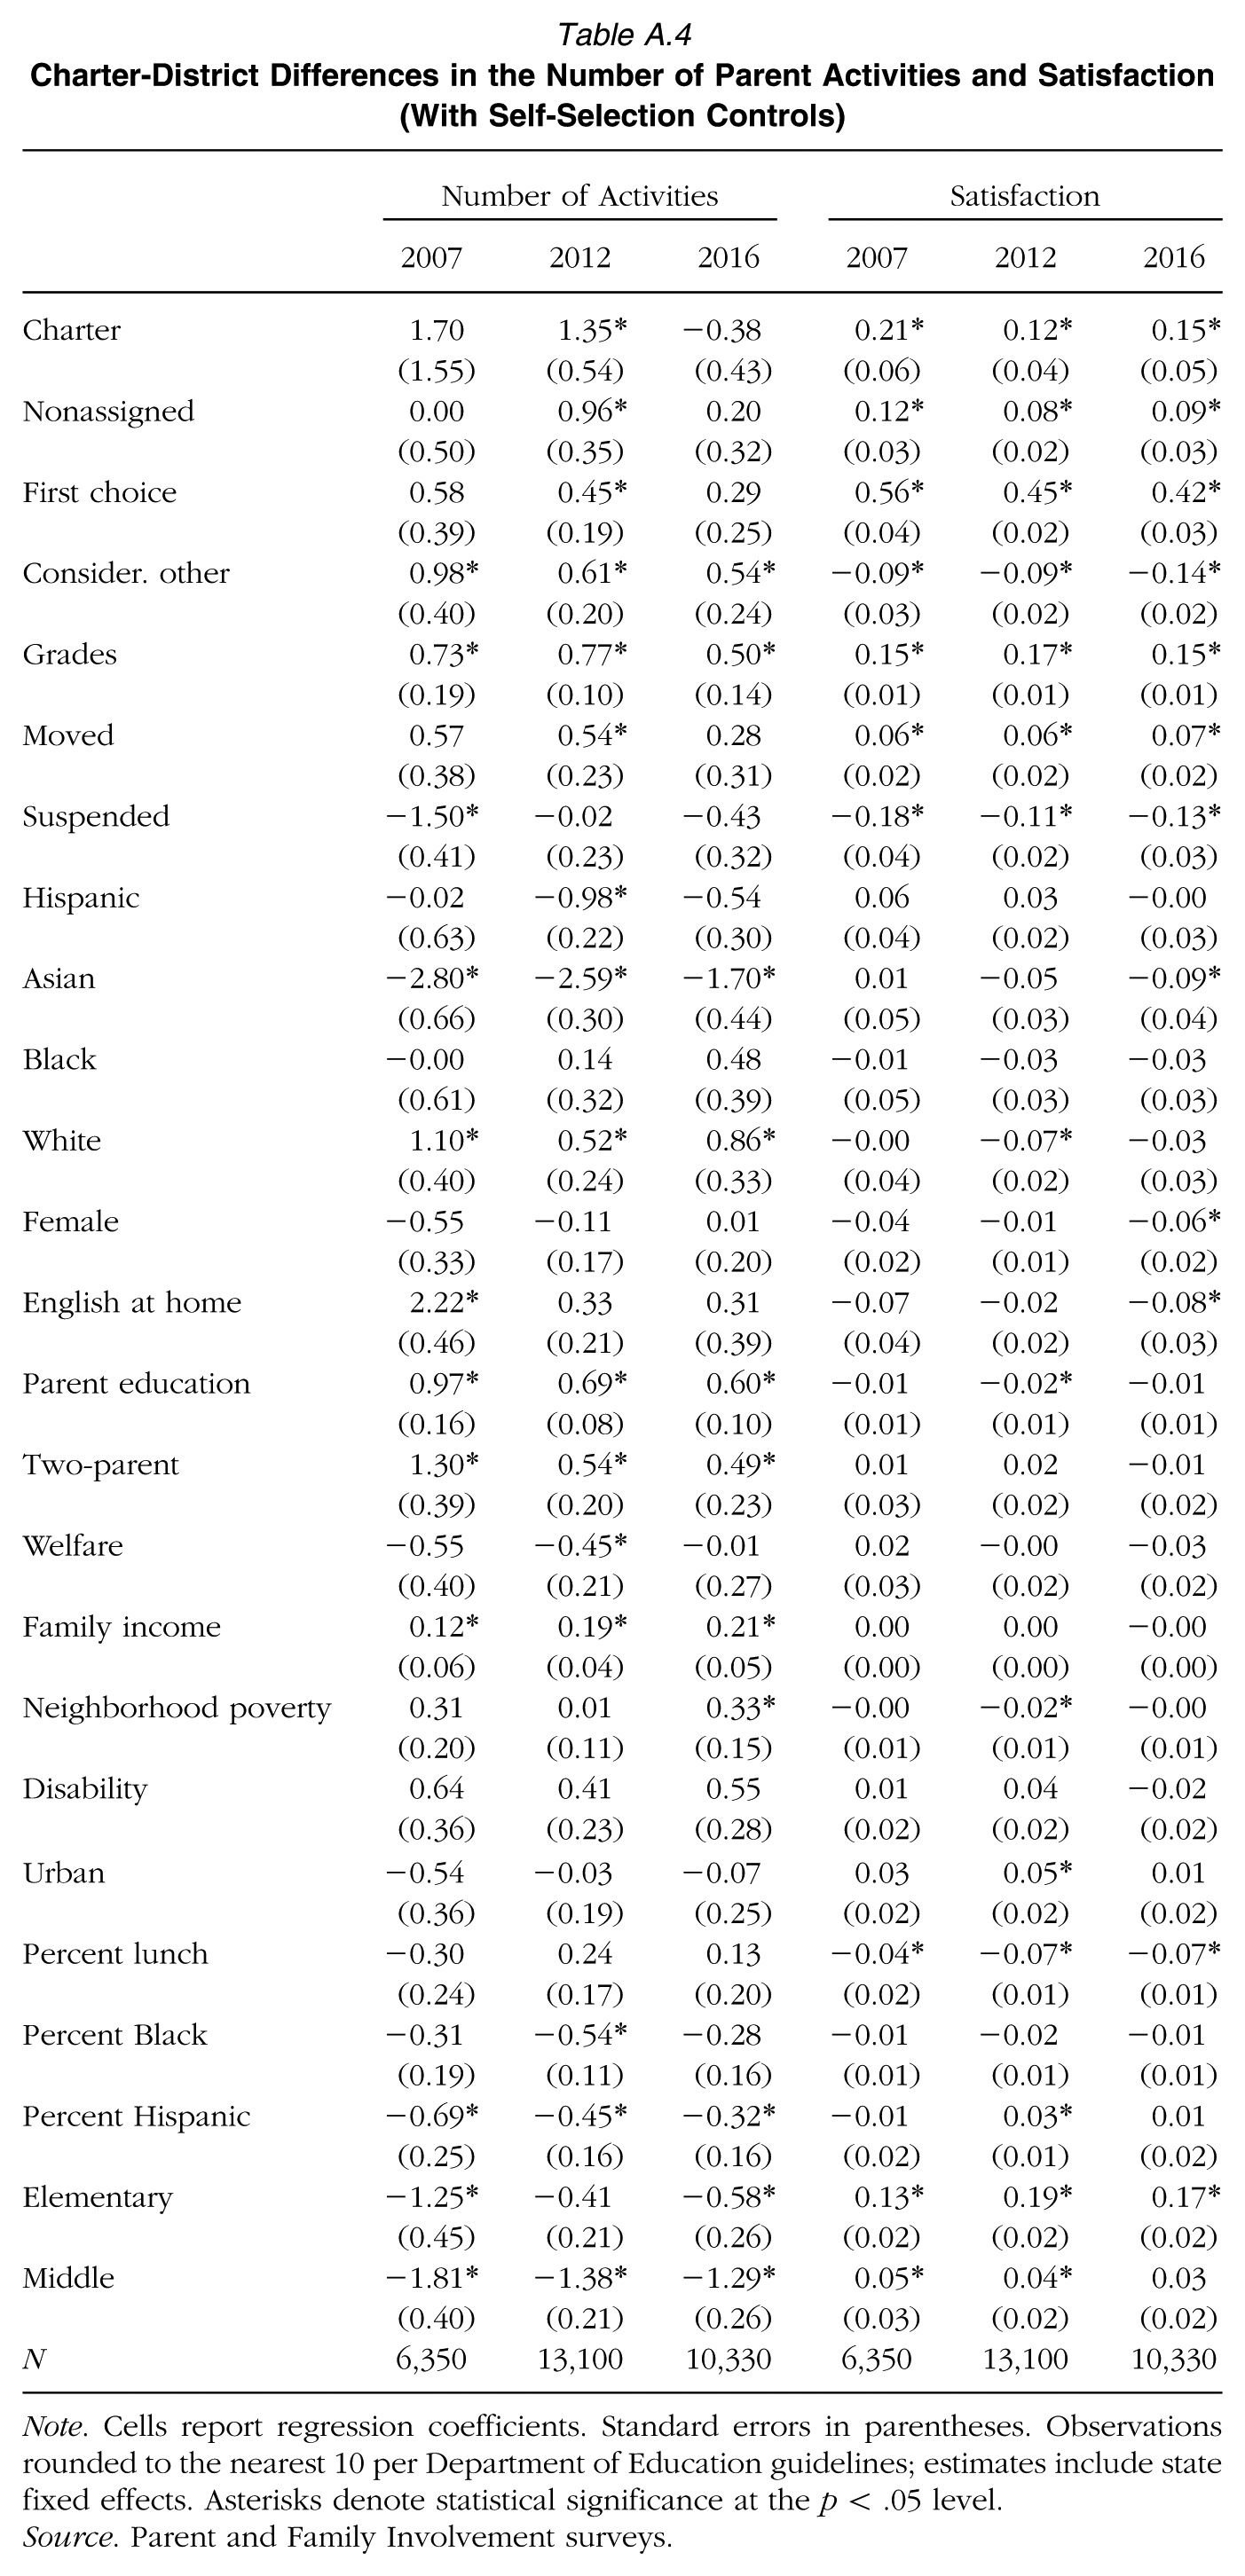
These gains are impressive, but it is important to recall that they do not account for any of the family-level differences, identified in Table 1, between charter and district school parents. Thus, we now shift to consider how the inclusion of these variables alters our view of any charter-district parent engagement and satisfaction differences. To do so, Figures 3 and 4 were generated using the model shown in Equation 2. The analytic strategy here was to (1) add the variables measuring family-level differences to the prior model (Equation 1) and (2) determine if charter-district differences in Figures 1 and 2 persist. Full results from these analyses can be found in Appendix Tables A.2-A.4.
Comparing charter parents with district parents: Differences in types of parent engagement (with self-selection controls).

Comparing charter parents with district parents: Differences in the number of parent engagement activities and satisfaction (with self-selection controls).
Figure 3 shows that even when controlling for the observable ways in which these two populations differed, charter school parents were more likely to report volunteering. Adding these family-level controls did not change the finding that charter parents were more likely to attend a school event, in 2012, or a parent-teacher conference, in 2016. However, the inclusion of these controls did render the difference in PTO meeting attendance, in 2016, and a parent-teacher conference, in 2012, statistically insignificant. As in Figure 1, there were no significant differences between charter and district parents regarding meeting attendance, fundraising, committee work, or guidance counselor meeting.
Turning to the examination of number of activities and satisfaction, we see that the findings in Figure 4 largely match those of Figure 2. Nevertheless, the inclusion of the family-level variables reduced the size of the number of activities coefficient from 1.5 to 1.4; similarly, the inclusion of these variables reduced the size of the average satisfaction coefficient from 0.18 to 0.16. As such, this analysis suggests that family characteristics did not play a large role in driving the findings in Figure 2. In other words, the self-selection characteristics measured here did not appear to be the sole reason for the charter-district gap in parent engagement and satisfaction.
Discussion
As readers reckon with these findings, it is important to consider a few of the article’s limitations. First, its engagement measures rely on self-reported behaviors, which, due to various survey response biases (Podsakoff, MacKenzie, Lee, & Podsakoff, 2003), may not reflect reality. Second, although the article tries to account for self-selection, its independent variable was not randomly assigned. Therefore, it cannot say for sure whether any associations between charter and parent engagement and satisfaction result from self-selection, what schools are doing, or other unobserved but nonrandom factors. Third, although the surveys in each year include thousands of respondents, the response rate in 2007 was quite a bit lower relative to other years. This may be responsible for some of the year-to-year volatility in the article’s engagement findings. Finally, although it looks over a 10-year period, the article relies on cross-sectional data. As such, it cannot track individual-level changes over time.
These are important limitations. However, by using nationally representative parent survey data over a 10-year period, this article makes an important contribution to the literature: It provides a temporal comparison of the experiences of parents with a child in charter school with the experiences of parents with a child in a geographically assigned district school. This section discusses the findings here and considers their implications.
To begin, the article showed that parent volunteering occurred more frequently at charter schools. This difference persisted even controlling for observed self-selection characteristics. On its face, this is a positive finding for charter schools: Parent volunteering saves money and builds a stronger school community. However, it is possible that differences in volunteering stemmed from higher rates of mandated parent volunteering in charter schools (Mommandi & Welner, 2018; Nathan, 1996; Smith et al., 2011; Weiler & Vogel, 2015; Wells, 2002). Because wealthier families have more time to spend on volunteering, parent volunteering contracts may discourage applications from—or push out—families with lower means (Hammel, 2014; Kahlenberg & Potter, 2014). Put differently, parent-volunteering contracts, if they are more common in charter schools, could generate selection differences between charter and district school parents. Unfortunately, there was no recent data about the existence of parent volunteering contracts in charter and district schools, 11 and the PFI did not ask parents about whether they had entered into a parent-volunteering contract with their child’s school. As a result, it is not clear whether this gain in volunteering indicates selection differences or something that charter schools are doing to encourage parents to get more involved in their children’s schools.
Aside from volunteering, the article found that—in most ways and in most years—charter and district parents were equally engaged in their children’s schools. Though it is impossible to fully explain a nonfinding, it is worth asking why there were not higher levels of parent engagement in charter schools. One explanation is that there is significant state-to-state variation in parent engagement, related to what state charter laws say about parent involvement (Wohlstetter et al., 2013). As noted earlier, some states have gone to greater lengths to make parent engagement a core part of their approach to charter schools. If this leads to national variation—wherein some states foster charter schools with greater emphasis on parent engagement than others—nationally there may be no uniform trend. Put differently, this null finding could be driven by charter policy differences across the states.
Alternatively, perhaps this nonfinding results from the vast diversity of the charter sector and the mission-driven nature of these schools (Carpenter, 2006). In other words, because there are so many different kinds of charter schools, and some are driven to pursue missions that do not place parent engagement at their center, there would be no meaningful national difference with district schools. If this is true, it means that the charter label, on its own, tells us little about how parents are likely to engage with their child’s school.
The article’s analysis of parent satisfaction revealed a clearer picture. Across all 3 years, charter parents reported higher levels of satisfaction with their child’s school relative to district parents. These differences persisted even when controlling for variables that measured observable differences in family demographics and behavior, such as the consideration by parents of other schools prior to enrollment. To put the size of these gains in context, they were much larger than the non-White–White and college–non-college district school parent satisfaction gaps. It is notable that these satisfaction findings align with Gleason et al. (2010) and Tuttle et al. (2013), which compared the satisfaction of charter school lottery winners and losers, and Barrows et al. (2017), which examined two nationally representative parent surveys. As such, the evidence is accumulating that charter schools are associated with higher levels of parent satisfaction.
Although we cannot know for sure why these differences are manifest, it is worth revisiting some of the theories considered in the early parts of this article. Drawing inspiration from the larger privatization movement, charter school theorists and advocates suggested that these schools would have a greater incentive to treat parents as “customers” and ensure that they are satisfied (Kolderie, 1990). As such, perhaps these gains in satisfaction result from steps that charter schools are taking to ensure that parents and children are having positive schooling experiences. In fact, some in-depth, qualitative work suggests that charter schools are devising innovative strategies to connect with parents and create the conditions for student success (Kahlenberg & Potter, 2014; Wohlstetter et al., 2013).
However, it is also possible that these satisfaction differences are artifacts of some unmeasured aspects of self-selection or that they are inherent to the process of school selection—perhaps winning a lottery or choosing a school, outside a parent’s and student’s experiences with the school, conditions a positive feeling. Supporting this possibility, the appendix tables reveal that parents with a child in a nonassigned district school also had higher levels of satisfaction relative to parents in a geographically assigned district school. Because the variable includes a diverse set of schools (see the Data and Method section for a list of possible schools captured by this variable), it is difficult to know what is driving these relationships. Still, it is important to note that parents with a child in a charter or nonassigned school—both of which indicate departures from the traditional, geographically assigned school—reported higher levels of satisfaction.
Conclusion
Advocates and critics have opined about what effects charter schools have on parents. However, relatively little is known about parent-reported differences in engagement and satisfaction in charter and district schools. This article contributes by examining these claims empirically over a number of years in the first two decades of the 21st century. In short, its findings suggest that charter schools may be making real gains in satisfaction even if parents are not more engaged in their children’s schools.
These findings raise a number of questions and topics for future study. To start, prior research suggests that teachers and principals in charter schools report higher levels of parent engagement. However, this article was unable to produce much evidence that parents in charter schools report a more diverse array, or higher levels, of engagement. Thus, further research is needed to understand the discrepancy between charter teachers’, principals’, and parents’ experiences with parent engagement.
Another area for future inquiry relates to the contours of the charter sector: Although educational management organizations have centralized operations in a variety of cities, the charter sector remains incredibly diverse. Thus, it will be important for future work to look at parent engagement and satisfaction within the charter sector. Do educational management organizations foster higher or lower levels of parent engagement and satisfaction? What about nonprofit versus for-profit charter schools? There has been some compelling, geographically-limited work in this area (Hamlin, 2017); however, moving forward, we will need nationally representative research examining what explains differential levels of engagement and satisfaction inside the charter sector. To spur this research along, it would be helpful if the NCES collected, maintained, and reported information about the profit and franchise status of the nation’s charter schools in its Common Core of Data. It would also be helpful if the NCES included a question about the existence of parent volunteering contracts on the PFI.
In addition, we need further research on why we are observing higher levels of parent satisfaction in charter schools. In particular, it would be helpful to better explore parents’ experiences with school leaders and teachers. School leaders are thought to have one of the largest impacts on school success (Kelley, Thornton, & Daugherty, 2005), and teachers are thought to have a major effect on student learning (Hanushek & Rivkin, 2006). Although charter proponents suggest that school leaders and teachers operate in a significantly different environment relative to their district counterparts, differences with district schools are contingent and mixed (Oberfield, 2017). Future work could contribute by comparing how district and charter parents experience the teachers and leaders who run their child’s school and how this is connected to their engagement and satisfaction.
More specifically, there are signs that charter schools are pioneering advances in school communication (Barrows et al., 2017; Mintrom, 2003; Oberfield, 2017; Smith et al., 2011). In particular, some charter schools are finding innovative approaches to contacting hard-to-reach parents and increasing the frequency of school-parent communication. These advances are important because school communication is theorized to affect parent engagement, parent-student interactions, and student achievement (Kraft & Rogers, 2015; Peterson, 2009). Specifically, Epstein (1995) argues that when schools conduct high-quality communications, they get communities, schools, and parents to interact and collaborate more closely. As this process plays out, student learning is enhanced, and parents have easier, more rewarding interactions with their child’s schools. As such, future research may advance our understanding of the charter-district satisfaction gap by looking at the role played by school communication.
Finally, aside from suggesting new avenues for research, this article’s results have implications for the tenor of the nationwide charter school debate, which often devolves into caricature and hardline position taking. Despite the heated rhetoric and the polarized nature of the debate, whether we look at in-school processes or student outcomes, the evidence suggesting that charter schools are different or better than district schools is mixed. This article’s findings mirror and contribute to this larger literature. As these results accumulate, perhaps they can encourage policymakers and stakeholders to ratchet down the rhetoric and engage in more generative conversations. In doing so, we can deepen our understanding of how charter and district schools compare and what they can learn from one another.
Footnotes
Appendix
Charter-District Differences in the Number of Parent Activities and Satisfaction (With Self-Selection Controls)
| Number of Activities | Satisfaction | |||||
|---|---|---|---|---|---|---|
| 2007 | 2012 | 2016 | 2007 | 2012 | 2016 | |
| Charter | 1.70 | 1.35* | −0.38 | 0.21* | 0.12* | 0.15* |
| (1.55) | (0.54) | (0.43) | (0.06) | (0.04) | (0.05) | |
| Nonassigned | 0.00 | 0.96* | 0.20 | 0.12* | 0.08* | 0.09* |
| (0.50) | (0.35) | (0.32) | (0.03) | (0.02) | (0.03) | |
| First choice | 0.58 | 0.45* | 0.29 | 0.56* | 0.45* | 0.42* |
| (0.39) | (0.19) | (0.25) | (0.04) | (0.02) | (0.03) | |
| Consider. other | 0.98* | 0.61* | 0.54* | −0.09* | −0.09* | −0.14* |
| (0.40) | (0.20) | (0.24) | (0.03) | (0.02) | (0.02) | |
| Grades | 0.73* | 0.77* | 0.50* | 0.15* | 0.17* | 0.15* |
| (0.19) | (0.10) | (0.14) | (0.01) | (0.01) | (0.01) | |
| Moved | 0.57 | 0.54* | 0.28 | 0.06* | 0.06* | 0.07* |
| (0.38) | (0.23) | (0.31) | (0.02) | (0.02) | (0.02) | |
| Suspended | −1.50* | −0.02 | −0.43 | −0.18* | −0.11* | −0.13* |
| (0.41) | (0.23) | (0.32) | (0.04) | (0.02) | (0.03) | |
| Hispanic | −0.02 | −0.98* | −0.54 | 0.06 | 0.03 | −0.00 |
| (0.63) | (0.22) | (0.30) | (0.04) | (0.02) | (0.03) | |
| Asian | −2.80* | −2.59* | −1.70* | 0.01 | −0.05 | −0.09* |
| (0.66) | (0.30) | (0.44) | (0.05) | (0.03) | (0.04) | |
| Black | −0.00 | 0.14 | 0.48 | −0.01 | −0.03 | −0.03 |
| (0.61) | (0.32) | (0.39) | (0.05) | (0.03) | (0.03) | |
| White | 1.10* | 0.52* | 0.86* | −0.00 | −0.07* | −0.03 |
| (0.40) | (0.24) | (0.33) | (0.04) | (0.02) | (0.03) | |
| Female | −0.55 | −0.11 | 0.01 | −0.04 | −0.01 | −0.06* |
| (0.33) | (0.17) | (0.20) | (0.02) | (0.01) | (0.02) | |
| English at home | 2.22* | 0.33 | 0.31 | −0.07 | −0.02 | −0.08* |
| (0.46) | (0.21) | (0.39) | (0.04) | (0.02) | (0.03) | |
| Parent education | 0.97* | 0.69* | 0.60* | −0.01 | −0.02* | −0.01 |
| (0.16) | (0.08) | (0.10) | (0.01) | (0.01) | (0.01) | |
| Two-parent | 1.30* | 0.54* | 0.49* | 0.01 | 0.02 | −0.01 |
| (0.39) | (0.20) | (0.23) | (0.03) | (0.02) | (0.02) | |
| Welfare | −0.55 | −0.45* | −0.01 | 0.02 | −0.00 | −0.03 |
| (0.40) | (0.21) | (0.27) | (0.03) | (0.02) | (0.02) | |
| Family income | 0.12* | 0.19* | 0.21* | 0.00 | 0.00 | −0.00 |
| (0.06) | (0.04) | (0.05) | (0.00) | (0.00) | (0.00) | |
| Neighborhood poverty | 0.31 | 0.01 | 0.33* | −0.00 | −0.02* | −0.00 |
| (0.20) | (0.11) | (0.15) | (0.01) | (0.01) | (0.01) | |
| Disability | 0.64 | 0.41 | 0.55 | 0.01 | 0.04 | −0.02 |
| (0.36) | (0.23) | (0.28) | (0.02) | (0.02) | (0.02) | |
| Urban | −0.54 | −0.03 | −0.07 | 0.03 | 0.05* | 0.01 |
| (0.36) | (0.19) | (0.25) | (0.02) | (0.02) | (0.02) | |
| Percent lunch | −0.30 | 0.24 | 0.13 | −0.04* | −0.07* | −0.07* |
| (0.24) | (0.17) | (0.20) | (0.02) | (0.01) | (0.01) | |
| Percent Black | −0.31 | −0.54* | −0.28 | −0.01 | −0.02 | −0.01 |
| (0.19) | (0.11) | (0.16) | (0.01) | (0.01) | (0.01) | |
| Percent Hispanic | −0.69* | −0.45* | −0.32* | −0.01 | 0.03* | 0.01 |
| (0.25) | (0.16) | (0.16) | (0.02) | (0.01) | (0.02) | |
| Elementary | −1.25* | −0.41 | −0.58* | 0.13* | 0.19* | 0.17* |
| (0.45) | (0.21) | (0.26) | (0.02) | (0.02) | (0.02) | |
| Middle | −1.81* | −1.38* | −1.29* | 0.05* | 0.04* | 0.03 |
| (0.40) | (0.21) | (0.26) | (0.03) | (0.02) | (0.02) | |
| N | 6,350 | 13,100 | 10,330 | 6,350 | 13,100 | 10,330 |
Note. Cells report regression coefficients. Standard errors in parentheses. Observations rounded to the nearest 10 per Department of Education guidelines; estimates include state fixed effects. Asterisks denote statistical significance at the p < .05 level.
Source. Parent and Family Involvement surveys.
Notes
Z