



Abstract
The Educative Teacher Performance Assessment (edTPA) is a system of standardized portfolio assessments of teaching performance mandated for use by educator preparation programs in 18 states, and approved in 21 others, as part of initial certification for preservice teachers. Because of the high stakes involved for examinees, it is critical that the scores produced and resulting decisions are meaningful and meet robust standards of validity and technical quality for educational measurements. We examined the technical documentation of edTPA and raise serious concerns about scoring design, the reliability of the assessments, and the consequential impact on decisions about edTPA candidates. In light of these findings, we argue that the proposed and actual uses of the edTPA are currently unwarranted on technical grounds.
Keywords
Educative Teacher Performance Assessment (edTPA) is a system of subject-specific standardized assessments of teaching performance used by hundreds of educator preparation programs (EPPs) across the United States for preservice teacher (PST) development and initial teaching licensure (Stanford Center for Assessment, Learning, and Equity [SCALE], 2018c). The assessments were initially conceptualized and used as formative assessment tools to support the development of better and more consistent teaching practices in teacher education programs. They were also intended to support the development of common teaching practices and a shared language within and across teacher education institutions and, more generally, to inform efforts to improve teacher education programs. More recently, edTPA assessments have been recast as high-stakes measures of readiness to teach and adopted widely by state departments of education for two purposes. First, individual scores inform decisions about program completion or initial teaching certification in 27 subject areas aligned to increasingly stringent licensure requirements. Second, aggregate scores are being used to evaluate the effectiveness of EPPs in the context of Council of Accreditation of Educator Preparation (CAEP) accreditation. These mounting policy pressures have extended the reach of edTPA assessments from 18,000 test takers in 2014 to almost 40,000 in 2017 (SCALE, 2018a). It is currently a mandated approach in 18 states, being considered by two additional states, and used as performance measures by EPPs in another 21 states (see http://edtpa.aacte.org/state-policy).
In this article, we examine the technical properties of edTPA scores as they relate to the validity of inferences and high-stakes decisions about individual teachers and teacher candidates. There are, of course, strong debates about the merits of high-stakes assessment in teacher education, and some critics (Choppin & Meuwissen, 2017; Greenblatt & O’Hara, 2015; Hutt, Gottlieb, & Cohen, 2018; Tuck & Gorlewski, 2016) argue that standardized assessments such as edTPA are inherently limited, counterproductive, or inappropriate (see also Cochran-Smith et al. [2016] for a critique of edTPA). However, the critical analysis we undertake here is not philosophical in nature; nor does it represent a wholesale critique of the idea of high-stakes assessment of teaching or teachers. Instead, we examine key technical properties of edTPA assessments through the narrower lens of psychometrics and validity theory (Kane, 2006, 2013) as well as professional standards for measurement and assessment (American Educational Research Association [AERA], American Psychological Association, & National Council of Measurement in Education, 2014). We focus here on the interpretations and uses of individual edTPA scores only, as any interpretations that rely on aggregate scores (e.g., to evaluate the effectiveness of EPPs) also inherently rely on the quality of these individual scores.
edTPA assessments are examples of criterion-referenced mastery tests. Teacher candidates who obtain a score that meets or exceeds a particular passing criterion or standard are deemed to satisfy a licensing requirement. The most critical question about this type of assessment concerns the validity of the inference: Is there sufficient justification for making this certification decision based on the observed score (Popham & Husek, 1969)? Evaluating validity (i.e., the warrant or justification for the intended uses) in this context involves three fundamental questions: The first is whether the knowledge, skills, and abilities being assessed are representative of the most important features of the domain of interest; the second is whether the scores produced by the assessment are sufficiently reliable and precise to support the intended inferences and decisions, particularly when these are consequential for individuals; and the third is the appropriateness of the cut score in differentiating those who do and do not pass the assessment (Kane, 2006).
With respect to the first question, the literature and available edTPA documentation provide considerable support for the claim that the assessments capture important aspects of quality teaching that should be considered in teacher certification from early childhood to secondary education across subject areas (see Sato, 2014). Regarding the second and third questions, however, the evidence is less robust, and significant questions remain about the reliability and precision of edTPA scores and whether they warrant high-stakes certification or licensing decisions about individual teachers in all subjects. This article draws on the existing literature and documentation of edTPA as well as analysis of scores from an administration in one of our home institutions to investigate two central issues related to the reliability and validity of edTPA scores:
The reliability and precision of edTPA scores and their appropriateness for supporting the intended high-stakes uses of the assessments
The consequences of the technical properties of the scores for certification decisions about individuals and groups of teacher candidates
The article is structured as follows: We first provide a brief overview of the history of edTPA and the contents and structure of the current operational version of the assessments. We then discuss the key concepts of validity for high-stakes assessments that inform our analysis, particularly those associated with score reliability, precision, and reporting. The bulk of the article then reviews the available documentation, as well as research studies and other materials, for evidence of validity related to the scoring design, the psychometric properties of the scores, and the consequences of decisions based on edTPA assessments. Our review is organized around widely adopted technical standards for educational and psychological testing (AERA et al., 2014). We finally present an analysis based on edTPA scores from teacher candidates in one of our home institutions to illustrate the limitations of the evidence available and the consequences for certification decisions. The final section considers the implications of our findings within a broader discussion about the assessment of teacher education candidates.
Overview of the Educative Teacher Performance Assessment
edTPA is a system of performance assessments designed to evaluate teaching practices and pedagogical strategies necessary for effective teaching in 27 subjects in preschool through secondary education. It has been used in different ways and for different purposes throughout its history, from its inception as a formative tool for careful reflection around teaching practice within EPPs to more recent uses as a high-stakes measure of teaching performance for individual licensure and EPP evaluation. The design of the assessments builds on a large body of research over several decades focused on defining effective teaching and designing performance assessments to measure it (SCALE, 2015b). Most prominent among edTPA predecessors was the work of the National Board for Professional Teaching Standards (NBPTS), which administered its first assessments in 1994 and has been the subject of extensive research (National Research Council, 2008). The NBPTS portfolio assessment included a variety of performance measures such as video, written analysis of teaching and assessment practices (including student work samples), outside evaluation of teachers’ professional performance, and a written exam.
Given the high regard for NBPTS, teacher educators began to consider how they might adopt this model to formalize existing approaches to the less formal portfolio assessment of teaching candidates, which had become popular among EPPs in the 1990s (Sato, Wei, & Darling-Hammond, 2008). Some EPPs began to develop NBPTS-like assessments for PSTs, and these efforts seeded a shift in state requirements for teaching certification. In 1998, the state of California adopted legislation requiring a summative assessment of teaching performance as a condition for initial teaching licensure. Some institutions adopted the California Teaching Performance Assessment (California Commission on Teacher Credentialing & Educational Testing Service, 2019). Other institutions adopted the Performance Assessment for California Teachers (PACT) developed in the early 2000s at Stanford University (Pecheone & Chung, 2006). The PACT was developed to replicate the positive effects on teaching practice reported in the literature when teachers participated in reflective and analytical processes linked to the NBPTS assessment. PACT closely resembled the NBPTS assessment’s structure and focus on classroom practice and student learning through the submission of a portfolio of instructional artifacts (including video and student work samples) along with detailed teacher analysis and reflection and was widely used by teacher education programs throughout the state as a formative tool to develop teacher candidates (Pecheone & Chung, 2006).
The conceptual and assessment work related to the PACT laid the groundwork for the development of edTPA. The developers sought to create broad-based PST assessments grounded in practice, with widespread input and support from the teacher education community (Darling-Hammond, 2010; Wei & Pecheone, 2010). The documentation lists a number of complementary goals and intended uses, all ultimately leading to improvements in student achievement. The intended uses include, on the one hand, curricular development and formative support for aspiring teachers and, on the other, impartial assessment of teaching practice for certification of individual candidates and evaluation and improvement of EPPs. edTPA assessments were initially administered in 2013 and have greatly expanded their reach in response to increasing demand for standardized tools to assess PSTs for purposes of CAEP accreditation and state licensure. The assessments are now managed by Pearson Assessment with endorsement and support from the American Association of Colleges for Teacher Education, and by 2018, they were the most widely used tools for evaluating teacher candidates and EPPs in the United States, reaching tens of thousands of candidates in hundreds of programs across the country.
edTPA Contents and Structure
Substantial work has been carried out and robust conceptual arguments offered to establish the linkage between the job requirements of teaching and edTPA as a measure of professional teaching practice (Sato, 2014). In addition to conducting an in-depth review of the relevant literature and previous experiences and research with predecessors (e.g., PACT, NBPTS), the developers engaged teams of educators and subject matter experts in extensive, in-depth job analysis that identified 15 distinct types of knowledge, skills, and abilities anchored on the InTASC (Interstate Teacher Assessment and Support Consortium) standards (SCALE, 2017, p. 17). Taken together, this work provides evidence supporting the content validity of edTPA—that is, the assessments appropriately represent the teaching practices and pedagogical strategies of effective teachers across the range of subjects. Nevertheless, it is important to note that some studies (Lim & Lischka, 2016; Meuwissen & Choppin, 2015) have raised concerns about the test content rationale, specifically related to how well edTPA aligns with disciplinary content standards and how high-stakes assessment can change how candidates engage in the instructional tasks that edTPA is designed to assess.
One of the issues we raise, and expand on subsequently in this critical analysis, is that the system consists of 27 unique assessments. Even though much of the structure is similar across subject areas, the instructions contained in assessment handbooks, scoring rubrics, raters, score distributions, and, of course, population samples all are specific to each of the 27 assessments. Consequently, separate analyses, reporting, and validation claims for each of the assessments are appropriate. However, there is no information available indicating that specific and detailed content analyses for each of the 27 assessments have been conducted (e.g., for developing content standards for each NBPTS certificate see https://www.nbpts.org/standards-five-core-propositions). Instead, the domain definition and analyses of edTPA are conducted at the aggregate level across subjects. Throughout this article, we characterize edTPA as a system with 27 unique assessments. However, some of the analyses in the article are treated at the aggregate level because that is the only information available in the technical reporting.
All edTPA assessments require candidates to compile a portfolio to provide extensive documentation and written reflection demonstrating their teaching ability in a particular content area and grade band (e.g., middle school math, high school social studies, early childhood) and are structured across three main teaching tasks: the planning task, the instructional task, and the assessment task. The response to the planning task involves documenting and commenting on related standards, learning objectives, classroom tasks, language demands, and assessments of student learning as well as describing the preK–12 classroom context. For the instructional task, candidates select video clips and transcripts of classroom dialogue for reflective analysis. The assessment task requires candidates to collect assessment records (e.g., feedback provided, evaluation criteria, summary of students’ performance, video-recorded clips) and assessment samples for three focus students, including one student with a significant learning need, that illustrate identified patterns from a whole-class analysis of learning. Performance on each task requires extensive reflective commentary and is evaluated based on three to five associated 5-point rubrics (most assessments have five rubrics per task). Each content-specific edTPA assessment has between 13 and 18 rubrics (most have 15).
During their clinical student teaching or internship placement, PSTs must first select an authentic learning cycle or segment of three to five consecutive lessons, planned around what edTPA defines as a central focus: an understanding that you want your students to develop in the learning segment. It is a description of the important identifiable theme, essential question, or topic within the curriculum that is the purpose of the instruction of the learning segment. (SCALE, 2018b, p. 10)
Candidates video record themselves teaching the entire learning segment and collect a variety of classroom artifacts (e.g., instructional materials, assessments, etc.) as evidence of their planning, instruction, and assessment practices for that segment. Candidates must write commentaries that describe and justify their practice with relevant educational theory, as well as reflect on questions about their instructional choices (SCALE, 2018b). Each artifact and commentary has a limit for length, but overall, PSTs can write up to 50 pages of single-spaced text for 15 rubric assessments. Video submissions for the main instructional task range from 15 to 20 minutes depending on the content area, and candidates can also submit up to 5 minutes of video focused on students highlighted in the assessment task. Some assessments (e.g., elementary) require an additional assessment task with focus students in a second content area. Total video submission limits range from 35 to 50 minutes. To complete and submit an edTPA assessment for scoring, candidates are required to follow the guidelines outlined in a 65–75-page handbook specific to the content area and grade they are completing (there are 27 unique edTPA handbooks).
Validity Framework for Examining edTPA
Validity refers to the degree to which evidence and theory support the proposed interpretations and uses of test scores. The consensus view holds that validity entails developing a coherent argument supporting specific uses from a variety of distinct but complementary types or sources of evidence. The central principle is described in Standard 1.0 of the Standards for Educational and Psychological Testing, the most widely referenced source of professional and technical guidance in the field: “Clear articulation of each intended test score interpretation for a specified use should be set forth, and appropriate validity evidence in support of each intended interpretation should be provided” (AERA et al., 2014, p. 23). Kane (2006, 2013) further articulates this model of validity in terms of justifications provided for scoring inferences (from observed performance to observed score), generalization inferences (from the observed sample of performances to expected performance in a universe of possible observations), and decision inferences (from implied performance to particular actions based on scores).
The idea of generalization is closely related to the concepts of consistency, reliability, and precision. According to the Standards for Educational and Psychological Testing (AERA et al., 2014), [r]eliability/precision of data ultimately bears on the generalizability or dependability of scores and/or the consistency of classifications of individuals derived from the scores. To the extent that scores are not consistent across replications of the testing procedure (i.e., to the extent that they reflect random errors of measurement), their potential for accurate prediction of criteria, for beneficial examinee diagnosis, and for wise decision making is limited. (pp. 34–35)
In the case of complex, large-scale performance assessments that involve human judgment, a host of factors—including the complexity of the scoring rubrics, the background and training of raters, and the specific processes and conditions of scoring, among others—can influence reliability and precision. Understanding these factors and how they influence the degree of confidence we can place in the observed scores and resulting classifications or decisions is particularly critical when high-stakes consequences are involved for test takers.
We refer to the framework outlined above to examine the adequacy of edTPA design and processes for producing reliable and precise scores consistent with the purpose and design of the assessments. Specifically, we address two critical issues for the validity of high-stakes inferences in this context: first, the reliability and precision of the operational scores produced by edTPA assessments; and second, the consequences of these psychometric properties for the consistency of classification decisions for particular examinees and groups of examinees.
We also adhere to the general tenet of validity theory that evidence does not automatically generalize beyond the kinds of contexts and conditions within which the validating evidence was collected (AERA et al., 2014). Specifically, Standard 1.10 states, When validity evidence includes statistical analyses of test results, either alone or together with data on other variables, the conditions under which the data were collected should be described in enough detail that users can judge the relevance of the statistical findings to local conditions. Attention should be drawn to any features of a validation data collection that are likely to differ from typical operational testing conditions and that could plausibly influence test performance. (p. 26)
This is particularly relevant to edTPA in two ways. First, many of the validity claims of edTPA are based on early pilot efforts in which validity evidence was initially collected under controlled research conditions (e.g., Pecheone & Chung, 2006) that differ substantially from operational conditions that currently exist in the field. Second, as noted previously, any claims based on evidence from 1 of the 27 assessments do not necessarily generalize to all 27 assessments. Thus, the present analysis of validity claims attends to recent operational data only but is necessarily limited by the fact that much of the relevant validity evidence reported by edTPA is aggregated across all 27 assessments.
Critical Analysis of edTPA
Approach
As previously mentioned, edTPA makes a strong case for content validity, but this is insufficient evidence to support valid score interpretations for high-stakes uses. The validity of high-stakes inferences about whether a teacher candidate meets a passing standard rests crucially on the psychometric properties of the scores assigned to the portfolio. In this section, we analyze the available evidence that reflects the reliability, precision, and dimensionality of edTPA scores and the consistency of the resulting scores and classifications.
Our critical analysis largely relies on publicly reported information contained in the annual edTPA administrative reports, which aim to document the evidence of validity of the assessments, as is commonly required of high-stakes tests (see Standards 4.0 and 7.0 below). These reports are the only technical documentation of edTPA publicly available.
Standard 4.0 Test developers and publishers should document steps taken during the design and development process to provide evidence of fairness, reliability, and validity for intended uses for individuals in the intended examinee population. (AERA et al., 2014, p. 85) Standard 7.0 Information relating to tests should be clearly documented so that those who use tests can make informed decisions regarding which test to use for a specific purpose, how to administer the chosen test, and how to interpret test scores. (AERA et al., 2014, p. 125)
During the period 2013–2018, these annual reports have presented essentially the same empirical psychometric evidence. In fact, reporting of technical properties of the assessment has been condensed over the years so that the latest reports refer readers to consult reports of previous years for additional detail on particular analyses or technical aspects (e.g., details about the standard error of measurement are available only in the 2015 administrative report [SCALE, 2016]; the 2017 report refers to the 2014 report for details on standard setting).
The information in the five administrative reports was condensed as needed and interpreted and referenced against the relevant standards (AERA et al., 2014) and against the psychometric literature more broadly. We specifically address issues of reliability, precision, and decision consistency. For parsimony, we focus here on those assessments that constitute the same 15 scales—all but three subjects.
Finally, in addition to using these publicly available reports, we used actual edTPA scores from one recent administration at one of our home institutions to illustrate technical issues with the rater reliability evidence presented in the edTPA documentation. The use of these data is elaborated later in the article.
Evidence Related to Score Reliability, Dimensionality, and Precision
Scores of a single instance of teaching are highly imperfect indicators of teaching performance, broadly conceived. The literature offers ample evidence that performance and scores can be expected to vary substantially across raters, lessons, and teaching occasions or units, among others (Bell et al., 2012; Bill and Melinda Gates Foundation, 2012). Because single judgments of complex performance tend to result in a high degree of error or uncertainty, standard practice involves collecting multiple independent measures or instances of practice (e.g., from different raters, tasks, or units of instruction) to determine the degree of (in)consistency or error in the scores, the key factors (or sources) that explain this error, and the consequences for specific intended inferences under operational conditions. For example, the design of the original NBPTS assessments included 10 separate tasks, each scored by two raters (Gitomer, 2008). 1 Similarly, assessment of teaching practice based on classroom observation or video typically involves multiple raters and observation occasions (Ho & Kane, 2013).
We argue that the edTPA scoring design does not adequately address this well-documented inconsistency among raters. As will be explained, the absolute agreement levels of ratings by scorers for edTPA are similar to other teacher performance assessments such as those previously referenced. Yet, in contrast with other high-stakes assessments, such as NBPTS and Advanced Placement (AP) Art portfolios (Mislevy, 1996), or other studies of teacher quality using observation measures (e.g., Kane, Kerr, & Pianta, 2014), one rater scores all edTPA rubrics for a given teacher candidate, except for the small proportion of cases that are double-scored.
For these other systems, not only have multiple raters been used but also different raters score different pieces of evidence in the assessment. When one rater scores all parts of an assessment, then the scores are not independent and associated error will covary across all scores (Webb, Shavelson, & Haertel, 2006). The implication is that the addition of more scales, absent adding more raters to the process, will not necessarily increase the reliability of the assessment. The edTPA scoring design issues lead to an expectation that, based on everything that is known about the measurement of complex teacher assessments, the reliability and precision of scores will be quite limited. Yet edTPA reports indices of reliability that are quite high. In the sections that follow, we review the information about edTPA score reliability that is presented in SCALE’s technical reporting from 2014 to 2018.
A reliability coefficient is defined as the proportion of variance in a measure that reflects true differences across subjects in the construct measured— that is, the variance that is not measurement error (AERA et al., 2014). If a performance assessment were perfectly reliable, candidates would be expected to receive identical scores no matter who scored the assessment or when and/or under what conditions the assessment evidence was collected. edTPA documentation offers three types of evidence of score reliability: proportion of interrater agreement, adjusted agreement (kappa) indices, and internal consistency (alpha) coefficients.
The Standards for Educational and Psychological Testing (AERA et al., 2014) includes the following standards that are particularly relevant to considerations of how the reliability of edTPA assessments is evaluated: Standard 2.1 The range of replications over which reliability/precision is being evaluated should be clearly stated, along with a rationale for the choice of this definition, given the testing situation. (p. 42) Standard 2.2 The evidence provided for the reliability/precision of the scores should be consistent with the domain of replications associated with the testing procedures, and with the intended interpretations for use of the test scores. (p. 42) Standard 2.6 A reliability or generalizability coefficient (or standard error) that addresses one kind of variability should not be interpreted as interchangeable with indices that address other kinds of variability, unless their definitions of measurement error can be considered equivalent. (p. 44) Standard 2.7 When subjective judgment enters into test scoring, evidence should be provided on both interrater consistency in scoring and within-examinee consistency over repeated measurements. (p. 44) Standard 2.19 Each method of quantifying the reliability/precision of scores should be described clearly and expressed in terms of statistics appropriate to the method. (p. 47)
Rater Agreement
The main source of error influencing score reliability in a performance assessment of teaching is typically the rater; because human judgment is involved, it is critical to assess how different an individual’s score might be if a different rater scored the portfolio. Exact agreement indices (the proportion of times two raters assign identical scores to the same tasks completed by a teacher) reported for edTPA range from a low of 0.48 to a high of 0.75 across tasks and rubrics (SCALE, 2018a, p. 9). Columns 3 and 4 of Table 1 show exact and adjacent agreement indices reported in edTPA documentation, which are on par with those reported for similar measures of teaching performance in the literature (e.g., Bell et al., 2014; Ho & Kane, 2013).
2017 edTPA Reported Data and Revised κ Estimates

Exact or adjacent agreement indices (the proportion of times raters assign scores that are identical or differ by only one point) range from 0.93 to 0.98 (SCALE, 2018a, p. 9). In interpreting these indices, it is important to note, first, that they are only descriptive summaries of rater behavior, not reliability coefficients reflecting true variance; indeed high reliability does not automatically follow from high interrater agreement (AERA et al., 2014, p. 44; Shrout, 1998). Second, when only a few scale points are actually used, these indices offer limited evidence of rater behavior. For example, consider two raters assigning scores at random across the 5-point scale (i.e., 20% for each score point); in this scenario, exact agreement of around 20% is expected by mere chance. However, if, say, only two score points were used by raters and scores were evenly distributed across those two scores, then agreement rates of 50% would be expected just by chance.
Chance-Adjusted Agreement
Kappa coefficients are often proposed as alternatives that consider agreement expected by chance (Cohen, 1960). edTPA documentation refers to a classic formulation of kappa by Brennan and Prediger (1981):

where Ao is the observed agreement, and Ac is the proportion expected by chance. Thus, kappa is higher to the extent that observed agreement exceeds the expected level of chance agreement. A number of limitations of kappa are noted in the literature (Brennan & Prediger, 1981), but the statistic remains widely used for performance assessments involving rater judgment.
Importantly, uses of kappa in the literature are invariably based on exact agreement: two or more raters that assign the exact same score to a performance. However, edTPA uses its own version of kappa that is based on the sum of exact and adjacent agreement. This is a nonstandard formulation that is not found in the psychometric literature and does not appear in the source cited in the documentation (Brennan & Prediger, 1981). More generally, this formulation seems counter to the very reason why kappa statistics were developed in the first place (i.e., to take into account the possibility of high exact agreement by chance). 2
Using this approach, edTPA reports implausibly high kappa coefficients of 0.85 to 0.97 across scales. The implied interpretation of these kappa reliabilities is that the key source of error (raters) is negligible and, thus, who scores a candidate’s submission is a matter of indifference—very similar scores will be achieved in all cases. This interpretation is potentially highly misleading. In fact, we can ask what the highest possible kappa value is, given the mean reported agreement rate of 0.56 (see Table 1). The largest value of kappa would be found if scores were evenly distributed across the five scale points, which would result in the lowest rate of agreement by chance (0.20). Using the standard definition of kappa, an exact agreement rate of 0.56, and a chance agreement rate of 0.20, the theoretically maximum kappa coefficient for the data reported in Table 1 would be,

Of course, a more realistic assumption is that there is a narrower score distribution that would result in higher chance agreement and, therefore, substantially lower kappa estimates. These score distributions are not available in the technical reports; therefore, it is not possible to estimate kappa based on the full set of operational data. However, we can provide a more reasonable approximation using the observed agreement rates (Ao) for each scale in the latest edTPA report and expected chance agreement (Ac) estimated on the basis of the distribution of scores obtained by PSTs in one of our own home institutions. Table 2 presents the distribution of total scores in the 2017–2018 institutional sample of 184 examinees aggregated across subject areas. This distribution is similar to that implied by the edTPA documentation (SCALE, 2018a, pp. 14–15), with more than 95% of all scores clustered in the middle (scores of 2, 3, or 4) for most rubrics and for most scales, over half of the scores assigned a value of 3. 3 Thus, chance agreements are substantially higher than if scores were distributed evenly across the scale points and, therefore, will be substantially lower than 0.45.
University Distribution of Scores Across edTPA Assessments, 2017–2018 (n = 184)
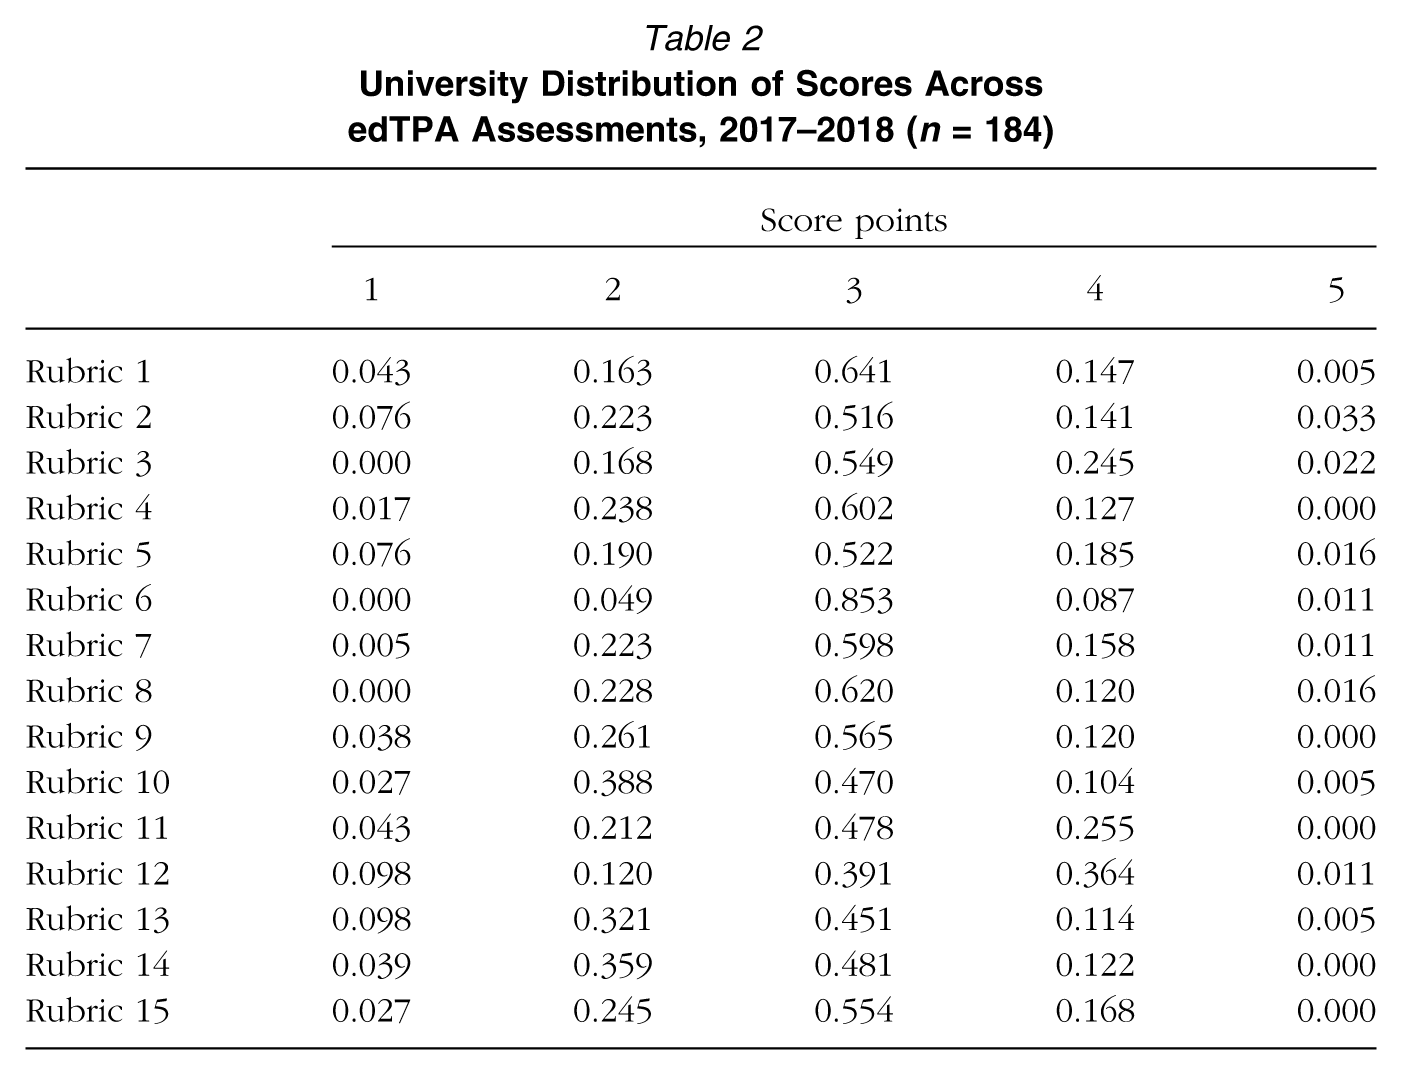
The last two columns of Table 1 present kappa indices reported for the 2017 administration of edTPA (SCALE, 2018a) alongside kappa estimates based on the authors’ institutional data for the same year. These revised kappas, calculated in accordance with the standard formulation of this statistic, range from 0.055 to 0.318, quite different from those reported by edTPA (0.853 to 0.967). Averaging across all 15 scales, the average kappa reliability would be 0.231, in contrast with the 0.906 reported by edTPA. Of course, it would be more appropriate to report kappas by each subject area, but these data are not available in the technical report.
Internal Consistency and Dimensionality
The third index of reliability reported in the documentation is Cronbach’s alpha: . . . a measure of internal consistency of raw test scores, an important characteristic of test scores that indicates the extent to which the items of the assessment measure the intended common construct (Cronbach, 1951). . . . Reliability coefficients ranged from 0.849 (Early Childhood) to 0.951 (Family and Consumer Sciences Education), with an overall alpha of 0.894, indicating a high level of consistency across the rubrics, meaning that the rubrics as a group are measuring a common construct of teacher readiness. (SCALE, 2018a, p. 10)
As with kappa, there are fundamental flaws in the use of the alpha statistic in edTPA. First, the coefficient is offered as evidence of both unidimensionality and reliability. 4 This is a common misinterpretation widely discussed in the literature (Cortina, 1993; Gardner, 1995; Sijtsma, 2009). Indeed, evidence from factor analyses in the same report suggests at least three strong factors or dimensions, corresponding to planning, instruction, and assessment, which complicates the notion that all 15 scores measure a single underlying construct. Moreover, alpha is predicated on examining the relationship of independently measured variables—in conventional tests, this means that answering one item correctly is not dependent on the performance on another item, conditional on a person’s ability. This is not the case with edTPA because the same rater assigns scores to every scale. Thus, as a measure of dimensionality, alpha is further inflated by rater halo effects across distinct dimensions of behavior (Bernardin & Pences, 1980).
Second, as estimates of reliability, the alpha coefficients reported are essentially uninformative because they omit the main source of error in edTPA scores, namely, the rater. This is an inappropriate procedure in this context, in direct violation of widely agreed protocols explicitly detailed in Standards 2.2, 2.6, and 2.19 (listed previously) of Standards for Educational and Psychological Testing (AERA et al., 2014). In practice, ignoring the main source of error in the scoring design can be expected to grossly overestimate the actual reliability of the operational scores. Assessing reliability in this context would normally entail estimation of a generalizability design, which requires defining the relevant components of error variance, and ultimately produces multifaceted reliability (i.e., generalizability) coefficients that appropriately reflect the various types of error affecting the scores (Brennan, 2001). A standard G-study design for this purpose would involve a group of raters scoring a selected set of portfolios on all scales—a crossed design isolating true score variance attributable to teacher candidates from error variance due to raters, occasions, rubrics, and the interactions between these. This framework is important because it enables developers to estimate reliability coefficients and standard errors that are specifically relevant for the operational scoring scenarios under consideration (e.g., one rater scoring 15 rubrics, three raters scoring 5 rubrics each, and so forth [Webb et al., 2006]).
Score Precision
Indices of precision are particularly informative in the context of criterion-referenced performance assessments, as they allow for the construction of confidence intervals that directly reflect the degree of uncertainty involved in interpreting and using individual examinee scores. The standard error of measurement (SEM) is defined as the standard deviation of the expected distribution of observed scores around the hypothetical true score over relevant replications (e.g., raters, occasions, tasks). In basic form,
Surprisingly, the approach followed in edTPA defines the SEM only in terms of the maximum number of score points (75 for most edTPA assessments) and the passing standard (SCALE, 2015a, p. 41):

As with kappa and alpha before, this is a highly nonstandard formulation, and it raises a number of questions and concerns in this context. First, this is notably a data-free SEM estimate not related to the distribution of the scores, or their reliability, as would be standard in the measurement literature. Because this SEM omits the main source of error (raters) in edTPA scores, it can be expected to offer an overly optimistic picture of precision. Second, the specific formulation offered is notably absent from both the Lord (1959) and Gardner (1970) references cited in the technical reports as the basis for this calculation. These sources, in fact, refer to an entirely different type of application: unidimensional tests composed of varying numbers of multiple-choice items of moderate difficulty. We are not aware of any other reported instances of use of this type of coefficient in contexts similar to edTPA, and no rationale is provided for using a formulation so different from standard practice—and one that ultimately is not tied in any meaningful way to empirical evidence of the precision of operational edTPA scores. 5 Finally, every edTPA assessment is assigned the same SEM, reported simply as comprising “about five points” (SCALE, 2015a, p. 44), independent of subject, grade, score distribution, or reliability.
Evidence Related to Decision Consequences
There are two major areas of concern regarding decisions made about individuals based on the edTPA: first, the consistency of decisions that would be made for a candidate given the reliability of the assessment; and, second, the use of the same cut score for the assessment across subjects and for different examinee subgroups. The most salient standards (AERA et al., 2014) regarding edTPA-based decisions are the following: Standard 2.16 When a test or combination of measures is used to make classification decisions, estimates should be provided of the percentage of test takers who would be classified in the same way on two replications of the procedure. (p. 46) Standard 5.23 When feasible and appropriate, cut scores defining categories with distinct substantive interpretations should be informed by sound empirical data concerning the relation of test performance to the relevant criteria. (p. 108) Standard 11.14 Estimates of the consistency of test-based credentialing decisions should be provided in addition to other sources of reliability evidence. (p. 182)
Decision Consistency
The most critical reliability issue with criterion-referenced mastery tests is whether the same decision would be made about an individual if the test were given or scored under different conditions. In the traditional formulation, the key question is whether the same decision would be reached if individuals took two parallel forms of a given test (see Livingston, 1972). As noted in the Standards for Educational and Psychological Testing (AERA et al., 2014), this notion relates directly to the precision of the scores: “When a test score or composite score is used to make classification decisions (e.g., pass/fail, achievement levels), the standard error of measurement at or near the cut scores has important implications for the trustworthiness of these decisions” (p. 46). There is an extensive literature on statistical methods to estimate decision consistency (e.g., Huynh, 1976; Livingston & Wingersky, 1979; Subkoviak, 1976, 1988; Traub & Rowley, 1980). Across methods, decision consistency is a function of three factors and follows a straightforward logic: Consistency is greatest when the standard deviation of the scores is large, reliability is high, and the cut score is more distant from the mean of the distribution. Conversely, decisions are less consistent where the scores cluster in a narrow range, the test is unreliable, and the cut score is close to the mean of the distribution (Traub & Rowley, 1980).
Subkoviak (1988) illustrates the impact of these factors on decision consistency, as shown in Table 3. The first column, z, represents the standardized difference between the cut score and the mean score, with reliability deciles across the top row. When reliability is high (0.90), consistent decisions are observed in 91% of times when the cut score is one standard deviation from the mean and in 86% of times when the cut score is right at the mean of the distribution, which meets Subkoviak’s suggested minimum consistency of 85% for high-stakes inferences. With less reliable tests, however, decision consistency declines substantially.
Approximate Values of the Agreement Coefficient (Subkoviak, 1988)
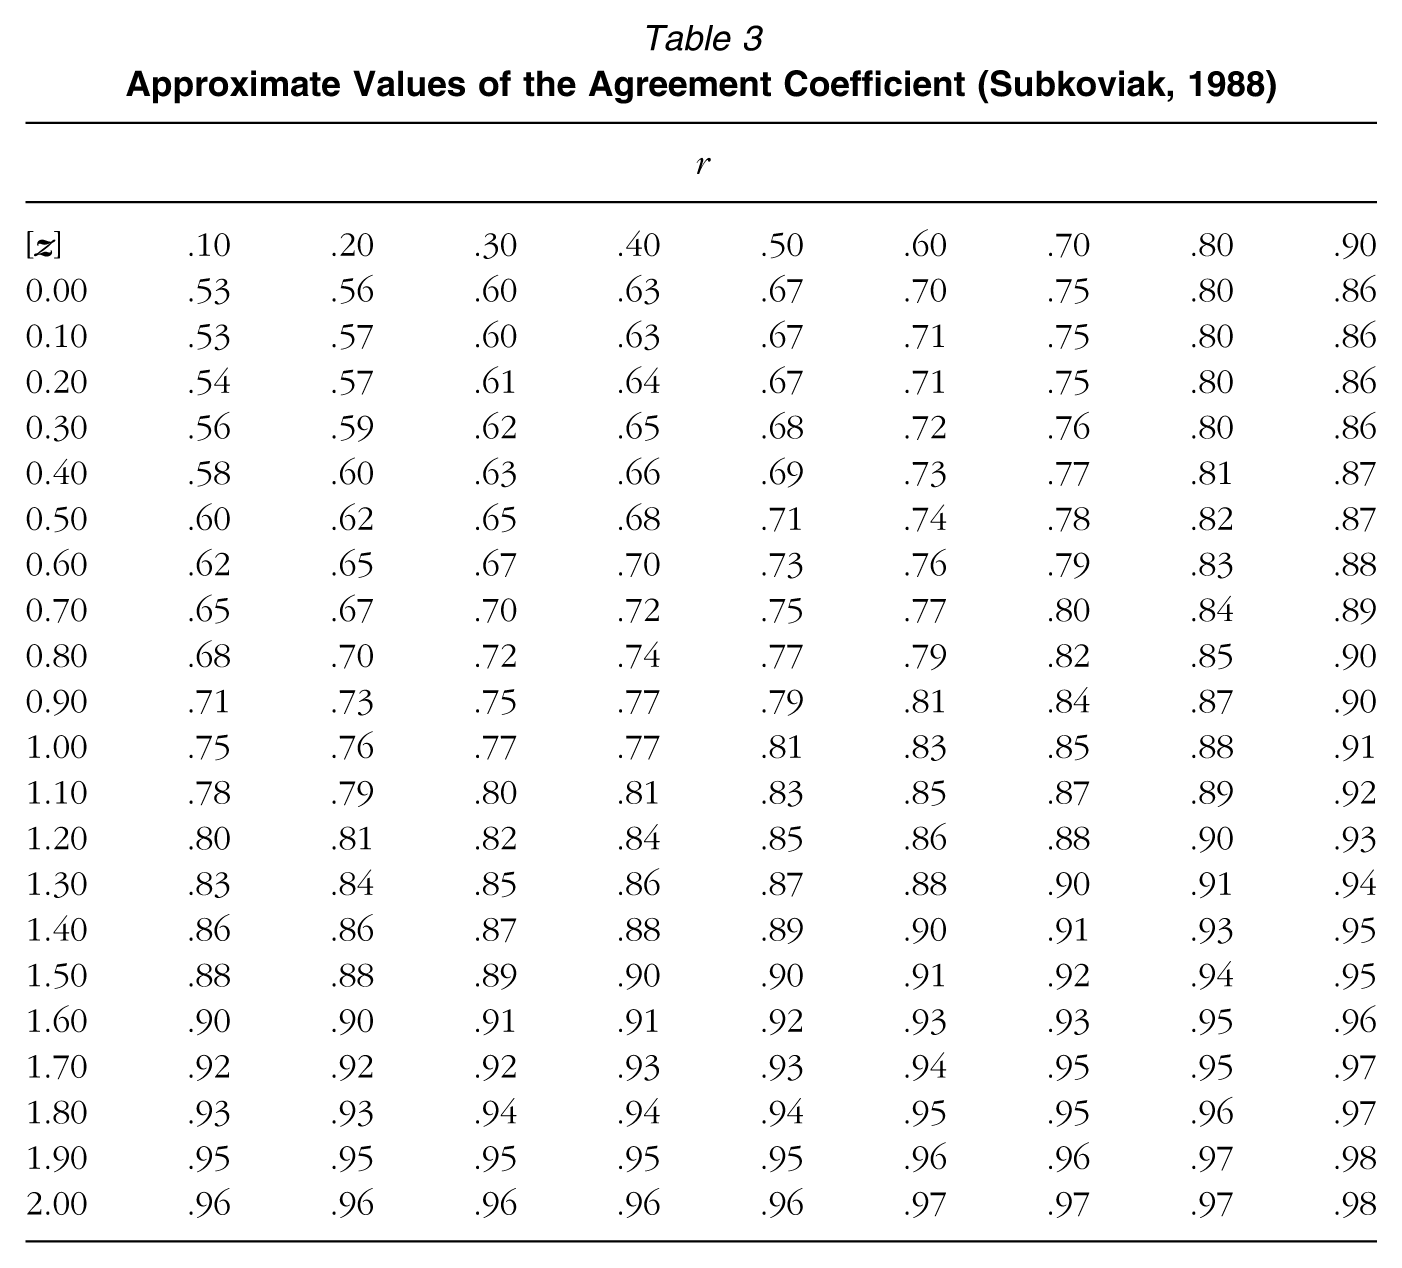
Table 3 shows the profound implications of misreporting the reliability of edTPA scores. If the reliability is around 0.90, as reported in the documentation, classification consistency will be appropriate across the board. But if the actual reliability of the scores is lower, classification consistency will be substantially reduced. For example, reliabilities of 0.60 or lower are common using four classroom observations of teaching that involve human judgment (e.g., Bill and Melinda Gates Foundation, 2012). Such reliabilities imply consistency of only 71% if a cut score were placed at the mean and 83% if the cut score were one standard deviation different from the mean.
However, decisions would be consistent only around 60% of the time (slightly better than chance) with reliabilities closer to those estimated using the institutional data (i.e., 0.20–0.30) and cut scores at the mean score (see Table 3). If reliabilities were in this range, it is only when the cut score is well over a standard deviation above or below the mean scores of the distribution that decision consistency would approach Subkoviak’s (1988) threshold of 85%.
A more fundamental issue, for purposes of this review, is that the true reliability of edTPA scores is effectively unknown; therefore, we lack information about the expected consistency of certification decisions about individual candidates across relevant administrations or scorings of the assessments. And further, because the estimates provided omit rater error, we see reason to suspect that the true reliability of the scores is lower than the coefficients reported.
Consistency across subjects and groups
For any assessment, it is critical that all candidates be treated in the same manner. Table 4 presents mean scores across subjects for the 2017 edTPA administration (SCALE, 2018a) and makes apparent that decision consistency and the likelihood of passing the assessment will vary significantly across subjects. Assuming a cut score of 41, for some subjects (e.g., middle childhood English language arts [ELA], English as an additional language) the mean score is at least one standard deviation above the cut score. Therefore, for a large proportion of candidates, high decision consistency can be expected. Even for reliabilities of 0.30 to 0.60, decisions will be consistent 77% to 83% of the time. However, for other subjects, particularly those with cut scores close to the mean (e.g., early childhood, secondary mathematics), different decisions could be made at very high rates, between 30% and 40% of the time given the same reliabilities.
Means and Standard Deviations by Field, 2017 Administration (SCALE, 2018a)

15-rubric handbook. b13-rubric handbook. c18-rubric handbook.
These mean score differences across subjects are substantial—average scores in 2017 ranged from ~40 (health education, secondary mathematics) to ~50 (English as an additional language, library specialist)—and raise another issue about treating all 27 assessments similarly across subjects. Given that most states set the same cut score across all subjects, evidence that this reflects true differences in performance across subjects rather than in portfolio demands or features of the rubrics, rater training and characteristics, among others, is needed. For example, several states (Illinois, California, Washington) set a cut score of 41 for assessments with 15 scales. If performance in these states reflected national data performance patterns in 2017, passing rates for middle childhood ELA, secondary ELA, middle childhood mathematics, and secondary mathematics candidates would be 92%, 84%, 79%, and 53%, respectively (SCALE, 2018a, Appendix C). If scores mean the same thing across assessments, then presumably this means that PSTs are substantially stronger in some subjects and weaker in others (e.g., middle childhood mathematics candidates are much stronger, as a cohort, than secondary school mathematics teachers). Standard 5.23 (AERA et al., 2014, p. 108) implies that there should be empirical evidence to justify these patterns, but no such evidence is provided in any of the edTPA reports. While the justification for using the same cut score is based on a judgment of how scores reflect expectations described in the rubrics, the reasons for differential performance across subjects are not clear.
Finally, decision consistency not only varies by subject but also by demographic group. For example, the average score of African American candidates is closer to the cut score than that of White candidates (42.6 vs. 45.2). The edTPA report is relatively dismissive of this performance difference between groups, as only 0.39 of a standard deviation (SCALE, 2018a, p. 21), but this is a significant shift toward the mean, and with a larger proportion of African American candidates’ scores near the cut score, it can be expected to affect decision consistency. Group differences within specific subjects are not reported, but differences in the consistency of decisions will vary with between-group score differences. The net result is that inferences about the readiness to teach could be less trustworthy for candidates in some groups than for candidates in other groups with higher scores.
Discussion and Implications
edTPA is a relatively new system of assessments that is having a substantial impact on teacher education with significant consequences for individuals who aspire to become teachers (while not discussed here, these are meaningful consequences also for teacher education programs). In many states, edTPA scores are used to determine whether an individual can obtain a teaching license. Thus, these scores need to be thoroughly vetted and defensible and must meet stringent professional and technical standards for validity in high-stakes assessment.
This article raises a number of significant questions about the technical properties of edTPA scores. The implied interpretation of the reliabilities presented in the SCALE reports is that the key sources of error are negligible and, thus, who scores a candidate’s submission, or what sample of performance is considered, is a matter of indifference, as these would result in very similar scores in all cases. Instead our analyses suggest that, for most relevant intents and purposes, the reliability and precision of edTPA scores remain unknown (see also Lalley, 2017) and, further, that there is reason to worry that edTPA scores contain substantially more measurement error than indicated in the annual reports.
The concerns we raise here are important because many nontechnical readers and users will extrapolate the high reliabilities reported to indicate that a single score from one rater on one portfolio (the typical operational configuration of the assessment) is sufficient for dependable measurement and inferences about teacher candidates, while the documentation offers no evidence that this is the case. The highly unusual SEM reported is not derived on the basis of operational estimates of reliability or precision and, therefore, is not an indicator of the degree of uncertainty of inferences based on operational scores—the key criteria for determining their use for high-stakes decisions.
Our analyses additionally suggest that a high number of misclassifications is possible in absolute terms and, proportionally, that teacher candidates from certain groups could be adversely affected. There will be higher proportions of errors for candidates in subject areas that have score distributions that are nearer to the statewide passing scores and for candidates in states that have passing scores closer to the mean of the score distribution. This will also be the case, for example, for African American candidates who, on average, score closer to the passing scores than candidates from other demographic groups.
We also raise concerns about aggregating analysis and reporting of psychometric properties across subjects and populations of test takers. The Standards for Educational and Psychological Testing (AERA et al., 2014) focuses on the validity of specific assessments, but it is not clear how to apply standards for validity to evidence that is aggregated across 27 different assessments. While the basic assessment structure may be the same, each subject within the edTPA program constitutes a unique test: Not only are the examinee populations different but also the portfolio requirements, handbooks, rubrics, raters, and, consequently, the score distributions and psychometric properties all likely differ across subject tests. Given the very large performance differences across subjects, assigning a common cut score without supporting evidence can also be cause for concern. Subject-specific measures of performance, reliability, and precision should be used to establish passing scores as part of each subject’s edTPA validity argument. The Standards for Educational and Psychological Testing (AERA et al., 2014) calls for separate analyses to be conducted and reported when assessments are administered under different conditions (i.e., test adaptations), across different grade levels, or using different norms (Standards 2.9, 2.10, and 2.12, respectively). There is no support in the standards for the practice of summarizing results across assessments of 27 different content areas, as is done here, nor is a rationale offered in the edTPA documentation. Importantly, this is also not standard practice in other complex teacher assessments or large-scale, high-stakes assessments of teaching. Similar programs such as NBPTS and Praxis have long reported separate information for assessments in different subjects (Educational Testing Service, 2018; National Research Council, 2008).
Despite the concerns raised by this article, there are several arguments that might plausibly be made to defend the edTPA as it currently exists. The first involves evidence from studies that investigate the relationship of edTPA scores to outcomes of interest. Goldhaber, Cowan, and Theobald (2017) provide some limited evidence of predictive validity from one state for decisions involving reading scores but not for decisions involving mathematics (interestingly, predictive validity was not observed when using the continuous score for reading). This study found that Latinx students were three times as likely as their White counterparts to fail the assessment, highlighting the issue of consequential validity and equity noted previously. Bastian, Lys, and Pan (2018) found that two edTPA factors (instruction and assessment) significantly predicted first-year value-added scores, but not state teacher evaluation scores, for elementary and middle school teachers in one EPP. Both studies examined edTPA scores from 2011–2014, before the significant growth in test takers, the increased need for raters, and the shift to the assessment being high stakes. These studies also only look at a fraction of the subject areas and relevant learning outcomes of edTPA. But even if these mixed patterns were to generalize to all subjects, modest positive correlations in the aggregate do not obviate the need to defend the validity of the pass-fail decisions about individuals on the basis of scores that have a great deal of unquantified error. While all assessment systems produce imperfect decisions, thoughtful consideration of whether a certain level of reliability or error is acceptable for a certain intended use requires an accurate sense of the magnitude of these errors.
This leads to a second, and related, defense of using an assessment like edTPA. Conaway and Goldhaber (2018) argue that, in developing accountability systems and evaluating measurement errors, it is important to consider the counterfactual, the fact that alternative and status quo methods can be even more problematic from a measurement perspective. We reject this argument for two reasons. The first is that the premise that traditional teacher education evaluation processes have not been satisfactory (Levine, 2006) does not lead to a conclusion that “anything is better.” In fact, alternatives like edTPA need to be justified and stand on their own, with sufficient validity evidence to justify their use and claim to improving the status quo. Furthermore, considering the additional cost to teacher candidates and the questions about score trustworthiness across subjects and groups, the case that this assessment is hurting candidates more than it serves the field should also be considered. Dissatisfaction with in-service teacher evaluation practices was used to justify a host of new teacher evaluation approaches, most particularly, value-added methods. The recent large-scale evaluation of the Measures of Effective Teaching project suggests that, in fact, new approaches are not always better nor do they necessarily yield the promised results and improvements (Stecher et al., 2018). We believe strongly that portfolio-based approaches like edTPA constitute a highly promising tool that can offer value for informing teacher evaluation and professional development. But validity is not conferred because of dissatisfaction with other methods. Precisely because of their significant promise and appeal, it is important to provide a robust body of evidence in order to establish the validity of scores derived from tools like the edTPA for particular uses and contexts.
A third potential argument is that, even if the assessment has technical limitations, when scores are close to the cutoff, they are presumably assigned a second rater, which would improve precision for those subjects most at risk of misclassification. However, as Bradlow and Wainer (1998) have shown, when scoring reliability is low, a second rater can bring little improvement to the precision and validity of scores. Moreover, as discussed earlier, the standard error used to determine whether an examinee is indeed close to the cut is entirely inappropriate, and, as a result, the precision of edTPA scores (either single- or double-scored) currently remains largely unknown.
A fourth argument might be that candidates who do not pass have an opportunity to retake parts of the assessment. It is true that, as the policy is currently constituted, this will result in a larger proportion of individuals passing the assessment. While this reduces the number of individuals denied licensure, there are a number of limitations to this argument. First, retaking the assessment creates a number of pressures on candidates, in terms of both finances and career decisions. Such burdens should be justified in terms of the technical properties of scores and overall adequacy of the assessment. Second, retakes typically involve candidates rewriting their narratives rather than actually teaching a new learning segment. Thus, the retake may be measuring something quite different (writing skill) than what was measured in the initial attempt. Finally, given considerations of sources of error and score reliability, retake policy can have direct implications for much more tangible issues like the proportion of teacher candidates from different groups that pass the assessment.
Conclusion
We argue that, in light of the evidence available, the current proposed and actual uses of edTPA in evaluating PSTs and programs are not sufficiently supported on technical and empirical grounds. We recommend that serious consideration be given to a moratorium on using edTPA scores for consequential decisions at the individual level, pending provision of appropriate evidence of the reliability, precision, and validity of the scores produced by the assessments and, given the stakes involved, an independent technical review of this evidence by an expert panel. Critical stakeholders such as state agencies, American Association of Colleges for Teacher Education, and CAEP should be informed about the incomplete and potentially misleading information regarding the precision of edTPA scores that has been conveyed in the existing documentation.
Any such review will require more thorough documentation than is available in the published technical materials. The Standards for Educational and Psychological Testing (AERA et al., 2014) goes into great detail about the kinds of documentation that ought to be provided as part of the work of providing validity evidence for an assessment. We have discussed the need to provide information at the individual subject assessment level, but other types of information are also missing or inappropriate, such as details about training, operational scoring, and quality control processes. Such information is commonplace in technical reports for both student and teacher assessments, particularly for assessments that have some type of performance measures scored by human raters.
We fully recognize that these final suggestions are quite unusual for a scholarly publication, and we do not make them lightly. They are only made in light of highly unusual practices and reporting of key information about the measurement properties of the edTPA. The assessment and associated policies are placing substantial demands on PSTs and teacher preparation programs. The conceptual structure of the assessment has many strengths, but its intended high-stakes uses fundamentally require a robust body of evidence that the scores produced, and the decisions based on those scores, are technically defensible. From the available documentation, we believe that there is basis for concern that this may not currently be the case in the operational edTPA. Real accountability, meaningful improvements to teaching practice, and other important educational outcomes require rigor and transparency in developing robust measures of appropriate technical quality.
Footnotes

Notes
D
J
D
N