



Abstract
This brief examined the patterns of reading achievement using statewide data from all students (Grades 3–10) in multiple years to examine gaps based on student, school, and district characteristics. Results indicate reading achievement varied most between students within schools and that students’ prior achievement was the strongest predictor of current achievement. Achievement gaps were identified for males, Black students, students receiving meal subsidies, and schools with higher proportions of students receiving meal subsidies. A “clientele effect” was also found. Policy implications are discussed.
Literacy is a key building block of educational progress and achievement. Unfortunately, nationally only 36% of fourth graders are performing at or above Proficient in reading (National Center for Education Statistics [NCES], 2015). Moreover, there are significant achievement gaps based on student, school, and district characteristics. Research has shown that differences in literacy skills exist between gender, race/ethnicity, and socioeconomic groups (Konstantopoulos, 2006). Furthermore, the 2015 National Assessment for Educational Progress (NAEP) results indicate there has been little to no change in these achievement gaps the past several years (NCES, 2015), with the 2011 NAEP results indicating little change since 1992 (NCES, 2011). Though data have substantiated the relationship between school- and district-level characteristics and achievement, there are differing conclusions regarding whether achievement differences vary more within or between schools (Chiu & McBride-Chang, 2006; Snow, Burns, & Griffin, 1998). Additionally, not many researchers have examined such variation in reading achievement at the school or district level across an entire state. Thus, further examination at these levels is timely and salient. To help policymakers, practitioners, and researchers improve literacy among all students, the field must better understand the patterns of reading achievement.
With the collection of statewide data linking students, schools, and districts, it is possible now, more than ever before, to examine patterns of reading achievement. For this study, we examined patterns of literacy in Kentucky, taking into account student background, school, and district characteristics. To determine patterns, we analyzed the data across all assessed grades and across multiple years. With statewide data at each of these levels (student, school, and district) along with identifiers connecting students with their schools and schools with their districts, we were able to examine these cross-level relationships with individual students’ literacy achievement and examine patterns at each level and across years. Furthermore, we examined the proportion of variability at each of those levels.
We analyzed data from all students in public, non-alternative schools who took the reading Kentucky Core Content Test (KCCT), which was administered in Grades 3–8 and 10. 1 To identify trends or cohort effects, data from 2007–2010 were analyzed. 2 Sample sizes ranged from 37,503 to 46,297 students, 203 to 660 schools, and 139 to 168 districts. The outcome was KCCT reading scale scores (range = 0–80). The methods are available in supporting material available in the online journal.
The unconditional model revealed that across all grade levels, the majority of variance in student reading achievement was between students within schools (88%–92%), while an average of 7% to 9% of variance was between schools within districts and between 1% and 2% was between districts. These intraclass correlations (ICCs) were consistent across all three waves of data, with standard deviations around the average grade level ICC being between 0.001 and 0.011.
Table 1 provides the Level 1 hierarchical linear modeling (HLM) regression coefficients across grades and 2008–2010 cohorts. A student’s prior achievement in reading had a positive and statistically significant relationship with current year reading achievement; each 1-unit increase in prior year reading score is associated with a 0.61- to 0.71-unit increase in current year reading score, across grade levels and years. Other student-level effects that were statistically significant across grades and years were whether or not a student was female (effects ranging from 1.44 to 5.24), Black (−0.56 to −7.30), or Asian (1.17 to 5.22) and whether the student received free or reduced-price lunch (−2.08 to −7.67). Other student variables were not consistently statistically significant. In general, effects of identifying as American Indian or as an unlisted racial/ethnic group (i.e., “other”) were not statistically significant, likely a reflection of their small proportion of the student population in Kentucky. Though not significant in some instances, the effects of English Language Learner (ELL) status as well as the effects of IEP (Individualized Education Program) status were consistently negative. The effect of classification as Hispanic was inconsistent in both statistical significance and direction across grades and years but was more often positive. This could be a reflection of controlling for ELL status; once language proficiency was accounted for, classification as Hispanic often had a positive relationship with reading achievement. With the exception of schools’ proportion of students receiving free or reduced-price lunch, school- and district-level fixed effects tended to be nonsignificant, though none of the higher level fixed effects were consistent across grades and years in terms of direction and statistical significance.
Student-Level Results Predicting Reading Achievement Across All Grades and Cohorts
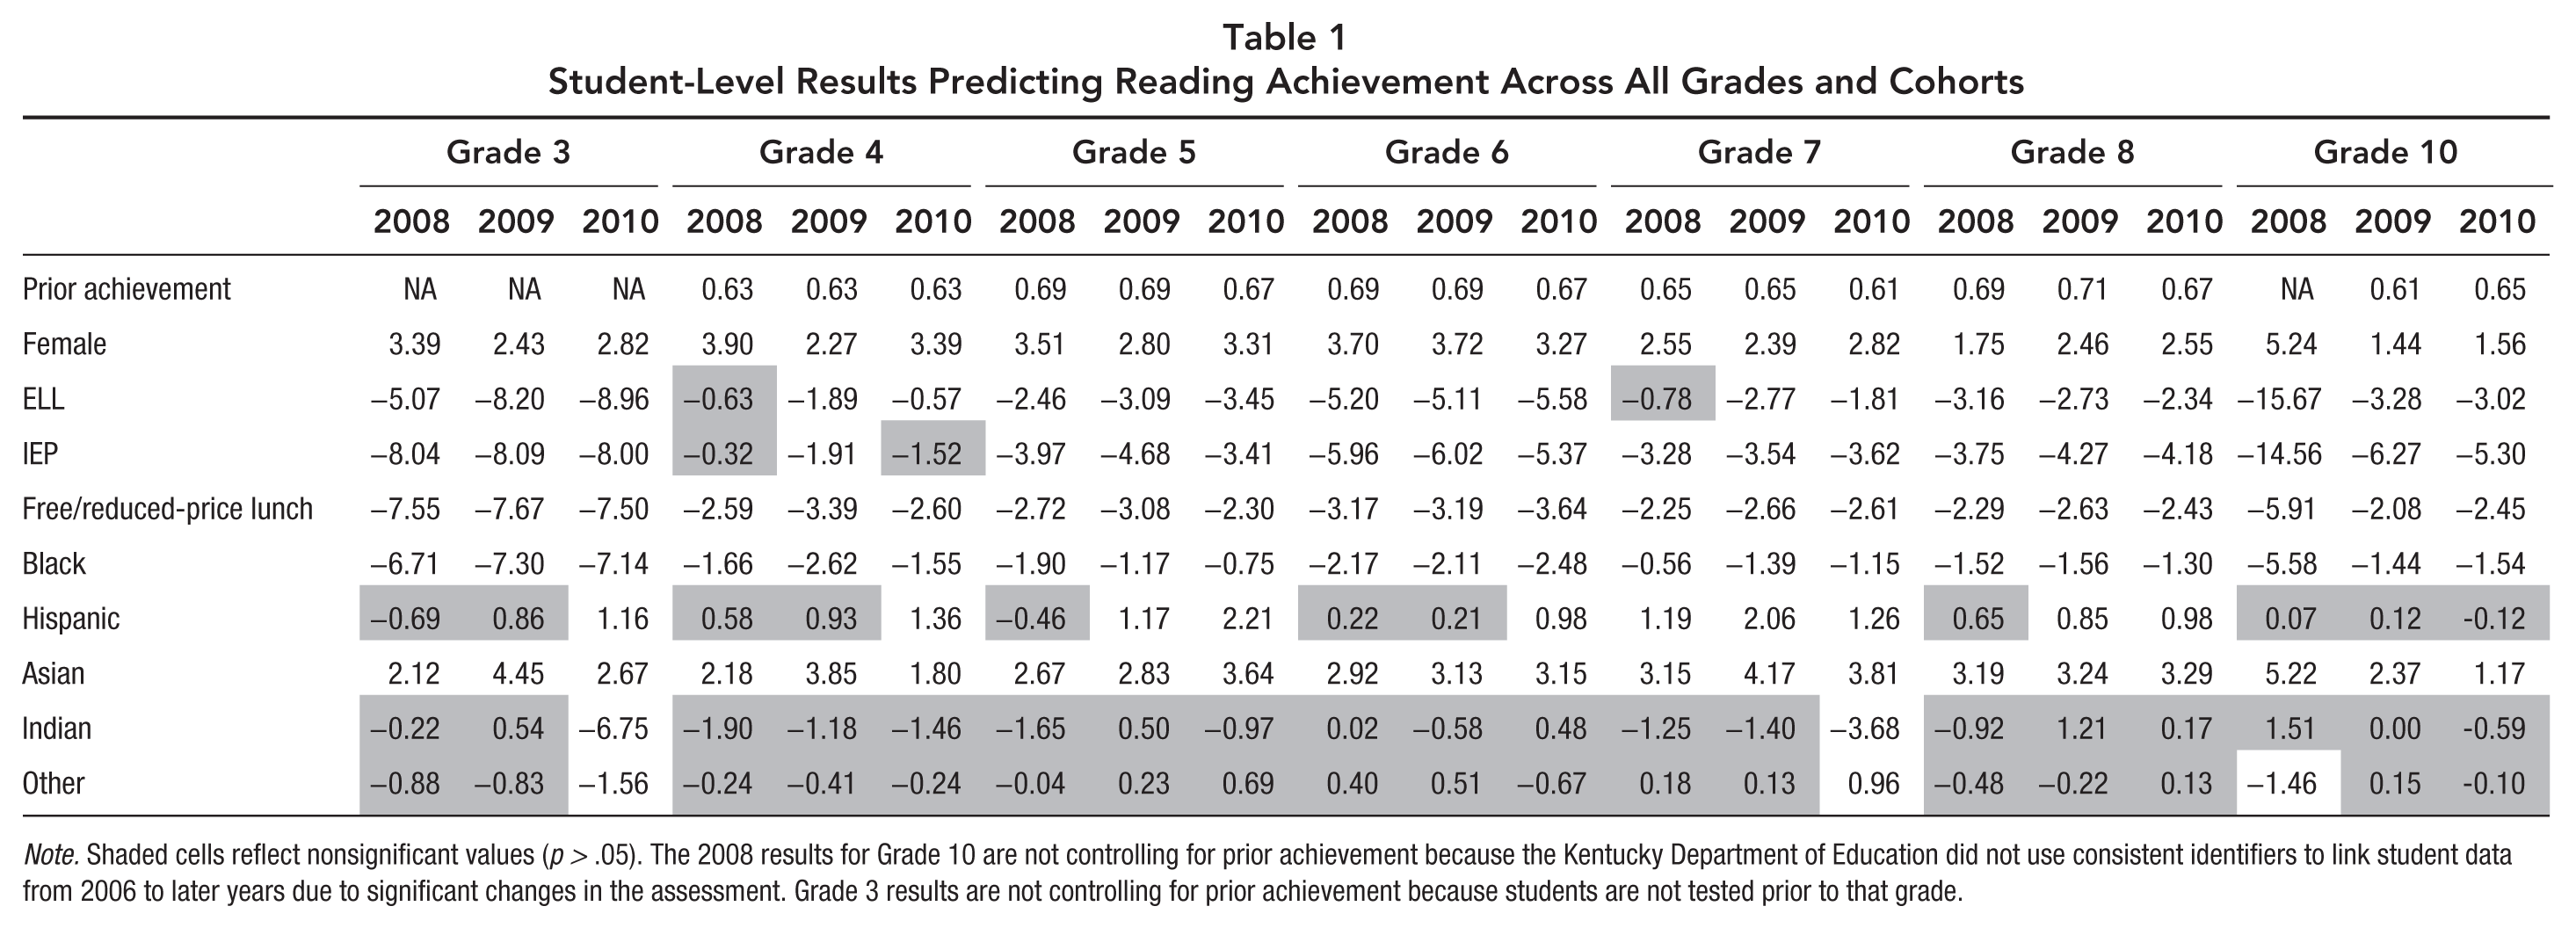
Note. Shaded cells reflect nonsignificant values (p > .05). The 2008 results for Grade 10 are not controlling for prior achievement because the Kentucky Department of Education did not use consistent identifiers to link student data from 2006 to later years due to significant changes in the assessment. Grade 3 results are not controlling for prior achievement because students are not tested prior to that grade.
Table 2 presents the proportion of variance explained at all three levels. Notably, students’ prior reading achievement explained the largest proportion of variance in reading achievement, ranging from 44% to 53% between students on average, 48% to 72% between schools on average, and 55% to 60% between districts on average. Student demographics explained very little additional between-student and between-school variance, 3% to 6% and 2% to 6%, on average. Student characteristics explained a higher proportion of between-district variance, ranging from an average of 0% to 14%. School characteristics explained, on average across years, 2% to 11% of between-school variance and 0% to 12% of between-district variance beyond what was explained by student characteristics. Finally, the district-level variables explained 7% to 48% of the between-district variance, on average.
Average Proportion of Variance in Reading Achievement Explained by Student, School, and District Characteristics From 2008–2010 Data

Because several districts had only one high school, Grade 10 was modeled as a two-level model.
Years 2009 and 2010 in Grade 10 were averaged because prior year achievement not available for 2008 because the Kentucky Department of Education significantly changed the assessment and did not use consistent identifiers to link student data from 2006 to later years.
Many accountability policies and resulting interventions focus on schools rather than on students; for example, the No Child Left Behind (NCLB) policy model assumes that the identified school “improvement efforts” (i.e., consequences, sanctions, resources, and supports) lead to increases in student achievement. These policies focus on school-level efforts rather than focusing on the strategies for individual learners. An example of this is that one of the sanctions applied to schools designated as “in improvement status” is school choice, in which students are offered the option of choosing a different public school. Those students choosing to change schools take with them their prior achievement, yet they may not receive the additional supports or programs to improve their achievement, at least not under the NCLB model (Forte, 2010).
Despite many accountability policies and resulting interventions focusing on schools rather than on students and the NCLB policy model assuming that the identified school “improvement efforts” (i.e., consequences, sanctions, resources, and supports) lead to increases in student achievement, the majority of variability in student scores is between students within schools. The results illustrate that students’ prior reading achievement explains the greatest proportion of variability in a given year’s reading achievement and that other student characteristics do correlate with reading achievement. In particular, students who are male, Black, an ELL, or who qualify for free/reduced-price lunch have, on average, lower reading achievement than their counterparts.
The results of this study suggest individual- and classroom-level as opposed to school-level intervention practices are more appropriate in the early grades, particularly in regards to reading. At the classroom level, teachers might be provided tools for diagnostic and formative assessment to identify students’ reading weaknesses and to measure growth throughout the year. Taking prior student achievement into consideration can help teachers develop targeted interventions and use research-based practices such as differentiation to improve reading achievement. This is supported by the work of Connor et al. (2011), which found that students’ initial language and literacy skills and the students’ characteristics interact with instruction, leading to later achievement. Additionally, the study findings support that when students are given opportunities to achieve at high levels in the early grades, these achievements may be carried forward to later grades. Furthermore, the findings highlight the need for continued interventions focused on the needs of students who are Black, ELL, or economically disadvantaged. For example, a more focused approach on subgroups failing to make Annual Yearly Progress (AYP) goals was related to those subgroups achieving at higher levels while a broad “school-wide” failure was related to little average achievement improvement (Hemelt, 2011). There are some research-based literacy interventions that have been tested for increasing achievement of students in specific subgroups, such as the use of emphasizing early language and literacy to improve African American students’ reaching achievement (Craig, Connor, & Washington, 2003). This, in conjunction with preassessment and differentiation, would focus the school resources (human and financial) on specific strategies for individual learners rather than on broad, school-wide reform.
Students’ prior achievement explains a great deal of variance in both school and district achievement, even more so than between students within schools. Similarly, although student demographics explained little variance between students or schools, they explained up to 14% of between-district variance. This speaks to the clientele effect (Garner & Raudenbush, 1991), in which students with similar backgrounds are clustered together in schools and districts, and the need for future research and evaluation to account for school and district cluster effects when examining policy and practice questions regarding student achievement. This has important implications as educators and administrators work toward meeting AYP and proficiency goals, particularly given an increased emphasis on the evaluation of teachers and schools. Although methods of evaluation such as value-added models examine student gains, thus taking into account prior achievement, little is known about the effects of prior achievement on growth, that is, students with higher levels of achievement may also grow more (due to a variety of reasons, e.g., ability, motivation, and parental support).
The current study adds to the research on patterns of reading achievement gaps and has strengths such as examining a comprehensive statewide data set over several years. However, the study is not without its limitations. KCCT scores were not vertically equated, resulting in the inability to model longitudinal growth in reading achievement over time. Additionally, the Kentucky student population is largely White and the state has a large proportion of Title I schools, which may have contributed to the patterns found.
Footnotes
Notes
Authors
References
Supplementary Material
Please find the following supplemental material available below.
For Open Access articles published under a Creative Commons License, all supplemental material carries the same license as the article it is associated with.
For non-Open Access articles published, all supplemental material carries a non-exclusive license, and permission requests for re-use of supplemental material or any part of supplemental material shall be sent directly to the copyright owner as specified in the copyright notice associated with the article.
