



Abstract
Recent shifts in policy and practice have brought an increasingly more academic focus to the early grades, evidenced in rising standards and the now widely accepted notion that kindergarten is the new first grade. These views however are mostly supported by teacher and parent self-reports and not by an analysis of literacy achievement data. We created an up-to-date literacy profile for beginning readers using a multiple cohort database that contained achievement data for students at entry to first grade (n = 364,738) in the same schools (n = 2,358) over a 12-year period starting in 2002. Our finding that overall beginning of first-grade reading achievement for both low achieving and more typically achieving students improved measurably between 2002 and 2013 provides empirical support for the growing academic focus in the early grades. However, our findings about the differential nature of that progress for low achieving students compared to those more typically achieving raise new questions and concerns about a growing literacy achievement gap in the early grades.
Keywords
The transition from kindergarten to first grade has always marked a critical period for young students’ academic and social development (Entwhistle & Alexander, 1998). In recent years, however, shifts in policy and practice have brought an increasingly greater academic focus to the early grades; public schools have become involved in funding programs for 3- to 5-year-olds, there are calls in many states for mandatory full-day kindergarten (Hyson & National Association for the Education of Young Children, 2003), and standards-based reform now reaches all the way down to prekindergarten (Neuman & Roskos, 2003).
The prevailing belief is that today’s students entering first grade are expected to know and be able to do what was covered in the typical first-grade classroom of a decade or so ago (Bassok, Latham, & Rorem, 2016). Given that as of 2014 nearly 95% of 5- and 6-year-olds in the United States were enrolled in school (a proportion that has changed little since 1980), we can reasonably conclude that almost every kindergarten-aged child in this country in recent years has been affected by these rising academic standards (National Center for Education Statistics, 2016a).
Preschool and kindergarten may amount to being the new first grade in terms of increasing curricular demands, but these apparent rising standards come with little information about whether and how literacy achievement has changed over time. While recent reports suggest lower achieving kindergarten students appear to be narrowing the gap with their peers (Lemons, Fuchs, Gilbert, & Fuchs, 2014) and are arriving at school better ready to learn than around the new millennium (Bassok et al., 2016), these reports are not substantiated by any achievement data.
It is not only pertinent to examine the degree to which general literacy achievement has shifted over time but also to understand if trends differ across specific literacy skills so that curriculum and interventions can be adjusted accordingly. We address this void by analyzing trends on six subscales of a literacy measure administered to 12 successive cohorts of incoming first-grade children from 2002–2003 to 2013–2014 enrolled in the same 2,358 schools located throughout the country.
We begin by first providing evidence for our assertion that more is expected now from students in the early grades. We then review the scant literature available that describes how early literacy achievement has changed over the past two decades. The final body of literature that we review describes current and competing views about what young students should be learning to become proficient readers.
Evidence of an Increasingly Greater Academic Focus in Kindergarten
The advent of standards-based reform (SBR) in the latter two decades of the 20th century strengthened efforts to increase the rigor of kindergarten curriculum. States began to adopt academic K–12 standards in the 1990s, which became requirements as part of the Improving America’s Schools Act of 1994 and the No Child Left Behind Act of 2001.
By 2000, every state had adopted standards and assessments to hold schools accountable to student attainment of them (Hamilton, Stecher, & Yuan, 2008). Even though kindergarten standards were not required by federal law, many states either had separate kindergarten standards or included them in primary grade standards bands (e.g., K–3) (Shepard & Smith, 1988); several states even enacted standards to include prekindergarten (Neuman & Roskos, 2003).
The widespread adoption of the Common Core Standards has further raised expectations that academic standards will increase (Gamson, Lu, & Eckert, 2013). Now, kindergarten students are required to read emergent reader texts with purpose and understanding and by first grade to read with sufficient accuracy and fluency to support comprehension while reading grade-level texts (National Governors Association Center for Best Practices, 2010).
Bassok et al. (2016), relying on one of the few data sets that allows for a glimpse into kindergarten classrooms, the Early Childhood Longitudinal Study-Kindergarten (ECLS-K and ECLS-K:2011), found that 80% of kindergarten teachers in 2010–2011 believed that children should learn how to read in kindergarten, whereas just a decade before, only 31% of teachers maintained that belief.
Perhaps an even more telling sign that kindergarten became more academically rigorous between 1998 and 2010 is that it was not until the 2010 survey that teachers were even asked about standardized tests. Moreover, according to Bassok et al. (2016), 73% of the 2010 kindergarten teachers reported that they used standardized tests at least once during the school year.
Further, Bassok et al. (2016) reported an increase in the proportion of teachers who indicated that academic achievement, as opposed to behavior or social skills, mattered when evaluating a student. Specifically, the proportion of teachers who indicated that a student’s achievement relative to standards mattered for assessment (whether local, state, or professional) rose from 57% of the 1998 kindergarten teacher cohort to 79% of the 2010 cohort.
In sum, though very few studies have directly examined the degree to which kindergarten classrooms have become more academically oriented over time, undoubtedly, policy changes over the past 20 years at the state and federal levels have encouraged greater expectations from schooling before first grade. The effectiveness of these policy changes is evidenced in changes reported by Bassok et al. (2016) in teacher responses to the ECLS surveys regarding the use of standardized tests and the growing influence of standards to measure student achievement.
Trends in Literacy Achievement: What We Know and What We Need to Know
The ECLS-K (1998–1999 cohort) and ECLS-K:2011 (2010–2011 cohort) data include kindergarten fall and spring scores on a reading achievement measure, but because the scores are not directly comparable at this time (National Center for Education Statistics, 2016b), it is not possible to examine achievement level trends across the two cohorts (although the data have been used to examine other important questions such as ethnicity and income gap changes; e.g., Reardon & Portilla, 2016). The fall to spring gain scores for each cohort, however, do provide some insight about progress with beginning reading achievement during kindergarten.
Children who were in kindergarten across the country in the 1998–1999 ECLS cohort increased their reading scale scores by 10 points from fall to spring, an effect size difference of about 1.05 (Rock, Pollack, & Germino-Hausken, 2002). Overall, children’s gains were located mostly in the areas of letter recognition and beginning sounds, with smaller gains in more difficult tasks including ending sounds and the least gain in sight words, words in context, and comprehension (Rock et al., 2002; West, Denton, & Reaney, 2000).
In terms of achievement gaps, West, Denton, and Reaney (2000) found that children in the 1998 kindergarten cohort with one or more risk factors started the school year behind their peers on all reading measures. These lower achieving students made gains across the year on the more basic literacy measures of knowing their letters and beginning sounds, but the gap actually widened on the more difficult measures of word reading (knowing words by sight) and ending sounds.
We could not identify any studies that conducted the same type of subarea gains analysis on the ECLS-K:2011 cohort, but Reardon and Portilla (2016) reported fall and spring means and standard deviations on the direct reading assessment for that cohort. Using their parameter estimates, we roughly computed a fall-spring effect size gain of 1.28, which was considerably larger than the effect reported on the ECLS-K cohort (West, Denton, & Germino-Hauskin, 2000). Yet again, the scores across cohorts are not yet comparable, so a myriad of reasons could account for the apparent effect size increase. Though speculative, it is possible that as the kindergarten curriculum became more academically focused, the fall-spring gains grew larger, but until a more in-depth analysis of subarea changes on comparable measures is conducted, the ECLS achievement results tell us little about actual achievement differences over time.
In one of the few studies that targeted younger students and provided data across several years, albeit a short period of time, Gamse, Jacob, Horst, Boulay, and Unlu (2008) investigated the impact of Reading First legislation on reading instruction and student achievement. They found that from 2005 to 2007, students’ grade level equivalent at the end of first grade on a comprehension measure changed very little, scoring 1.7, 1.8, and 1.8, respectively, for each year. In the only year that they collected data on a decoding measure, 2007, Gamse and colleagues found that first-grade students in schools with Reading First funding scored a grade equivalent of 1.7 at the end of the school year. Students in the non-Reading First funded schools scored at similar levels on the comprehension measure but slightly lower (an effect size of 0.17 standard deviations) on the decoding measure.
In sum, it seems reasonable to conclude that kindergarten students have made considerable literacy gains during kindergarten; this was evident in the ECLS-K 1998 and ECLS:2011 cohorts (Reardon & Portilla, 2016; West, Denton, & Reaney, 2000). Notably, however, they made the greatest gains on the more basic skills of letter knowledge and beginning sounds and smaller gains on more advanced skills (word reading and ending sounds). It also seems reasonable to conclude that children with risk factors started the kindergarten year scoring lower than their peers on all reading measures; by the end of the year, they caught up but only on the more basic measure of letter knowledge; they fell further behind on word reading. These findings are similar to Gamse and colleagues (2008) in that they also found students, albeit first graders, in Reading First schools made greater growth than students in non-Reading First schools on a basic measure (decoding) but not on a more advanced one (comprehension).
While these studies appear to converge on the view that early readers are becoming more proficient with basic skills but not advanced ones, the evidence about what beginning readers now know is scant. The ECLS data are limited to two cohorts 12 years apart whose scores are not comparable. Gamse and colleagues’ (2008) analyses of the impact of Reading First funding provided information about multiple cohorts of younger students but only for a three-year timeframe and for students at the end of first grade, just beyond the transition period from kindergarten to first grade that is presently the subject of so much scrutiny.
We turn our attention now away from what we know about trends in early literacy achievement to what we know about essential instruction for these young students. These two reviews, the previous one about learning and the next about teaching, provide a frame to understand how we interpreted our results.
What Do We Know About What Works Before First Grade?
Two national reports were released in the 2000s that identified essential components for early literacy instruction: the report of the National Reading Panel (NRP; National Institute of Child Health and Human Development [NICHD], 2000) and the report of the National Early Literacy Panel ([NELP] 2008). Although the NRP examined instruction across a broader spectrum (preschool to Grade 12) than the NELP (birth to 5 years of age), the panels concurred on the importance of teaching phonics (teaching letter sound relationships) and phonemic awareness to young students. Both reports also stressed the importance of alphabet knowledge.
Specifically, NELP, much like the NRP, concluded that code-focused instruction in the early grades, in other words, interventions that emphasized phonemic awareness, phonics, and alphabet knowledge, consistently demonstrated moderate to large positive effects on what they refer to as “key early literacy and reading indicators” (phonemic awareness, alphabet knowledge, reading, and spelling; NELP, 2008, p. 113). Additional instructional practices, appropriate to the younger age group that was the focus of their review, were identified by NELP, including reading to children and parent and home programs.
What influence have these reports had on kindergarten instruction? Pearson and Hiebert (2010) noted that the instructional emphases supported by NRP and NELP are not new and in fact have been emphasized in previous large-scale U.S. syntheses of reading research going back 50 years. As a result, Pearson and Hiebert surmised, “In many kindergarten contexts (as well as preschool ones), young children are involved with instruction that aims to promote at least two of the code-based predictor variables identified in the NELP report—letter naming and phonological awareness” (p. 291).
Despite the convergence of both NRP and NELP about what should be taught in the early grades, particularly phonemic awareness and alphabet knowledge, and the fact that this view has been repeated in multiple national syntheses of reading research, questions have been raised about the appropriateness of this kind of instructional emphasis in kindergarten.
Pearson and Hiebert (2010) summarize two recent studies (Denton & West, 2002; Invernizzi, Justice, Landrum, & Booker, 2004) that demonstrated that many students are proficient with letter identification at the beginning of kindergarten and that most know the letters by the end of the school year. By contrast, Pearson and Hiebert argued, referencing the Denton and West (2002) report about ECLS-K, kindergarten students performed no better with word recognition, leading Pearson and Hiebert to question whether teaching students letter naming is enough given that a concurrent rise in word recognition or reading is not evident. It may be, Pearson and Hiebert asserted, “what these knowledgeable kindergarteners need is greater attention to word reading and writing than to their prerequisites” (p. 291).
In sum, the present-day emphasis on what works in kindergarten instruction appears to center on learning items of knowledge, specifically letter identification, phonemic awareness, and decoding, skills demonstrated to predict later reading achievement. At the same time, questions are raised as to whether this emphasis is appropriate given that the small body of evidence that exists suggests young students appear to be making gains in specific skills such as alphabet knowledge (see Pearson & Hiebert, 2010) and with decoding (Gamse et al., 2008) but not on measures of word recognition or reading itself (Pearson & Hiebert, 2010).
The overall lack of empirical knowledge about literacy achievement in the early grades, particularly in the face of seemingly contradictory evidence about what young readers know and ought to be able to do, is particularly troublesome given the present climate of rising academic standards for young students, particularly those in kindergarten. Our goal therefore in this article is to create a literacy profile of beginning readers that is informed by 12 years of multiple cohort data and by doing so, fill in the picture about young students’ early reading achievement.
These data come from the same screening tool used over the 12-year period: An Observation Survey of Early Literacy Achievement (OSELA; Clay, 2013). The OSELA, described in more detail later in this article, is the American Institutes for Research’s highest rated screening tool in terms of its classification accuracy, generalizability, reliability, and validity to identify children at risk of literacy failure (National Center on Response to Intervention [NCRTI], 2010).
Study’s Purpose and Research Questions
We investigated the following two research questions:
Research Question 1: What was the overall change in literacy achievement for low achieving students (LA) and a random sample (RS) of all students who entered first grade between 2002 and 2013 on the six OSELA tasks?
Research Question 2: What was the trend in the achievement gap on each OSELA task between LA and RS students from 2002 to 2013, and did the trends differ across OSELA measures?
Method
Study’s Extant Database
We analyzed literacy achievement data obtained from an extant national database for Reading Recovery (RR), a literacy intervention for first-grade students. School and student data have been collected at the same schools since 1984 when Reading Recovery was first implemented in the United States. We started data analysis beginning with the 2002–2003 cohort, the year that the current evaluation protocol was implemented for the first time. The data set consists of demographic information about the students and their fall scores on a literacy measure, OSELA (Clay, 2013).
Note that even though we used an extant database for Reading Recovery, the only achievement data we analyzed were those collected at entry to first grade, prior to any involvement in the intervention. Students were not enrolled in Reading Recovery, nor had they participated in the intervention at the time of the testing.
School characteristics
For the purpose of this study, student data were drawn only from schools that appeared in the database each year for the 12-year period, ensuring that the sample of schools was consistent throughout the study period. This resulted in a sample of 2,358 schools from 44 states in the United States.
Student characteristics
Schools that implement RR follow a standard assessment protocol in the fall of each school year. The first-grade cohort in each school is rank-ordered and the bottom one-third assessed using the OSELA. The lowest achieving students are then identified for the intervention. At the same time, two first-grade students are selected at random from each school and tested with the OSELA. This protocol yields an annual representative sample of low achieving and random sample students from schools with RR.
Selecting schools and students in this manner yielded a total sample of 364,738 students at entry to first grade; 313,488 (26,124 average per year) LA students who were identified for Reading Recovery but had not yet started the intervention and 51,250 (4,271 average per year) RS students from first-grade classrooms in each school. On a total score consisting of all six OSELA tasks, the LA average score was at the 14th percentile in the RS distribution in each of the 12 years, indicating tremendous consistency in the student selection process in the sampled schools over time.
We examined the degree to which the resulting sample represented the national population of first-grade students each year and over the 12 years by drawing on the U.S. Department of Education’s Common Core Data. It was possible to compute the ethnicity breakdown of first graders for all 12 years, but data on the percentages of first-grade students who were eligible for free or reduced-price lunch (FRL) were not available. The Common Core Data, however, yielded estimates on the percentages of elementary grade students who were FRL eligible for all study years except for 2011.
Table 1 provides racial/ethnicity and FRL percentages for the RS sample and population (in parentheses). As can be seen, the ethnicity/racial and breakdown and FRL percentages are rather comparable for any given year and the trend from 2002 to 2013.The sample tends to be slightly more White and slightly less Hispanic than the national estimates, but as was the case in the population, the sampled schools’ first-grade cohorts over time became about 8 percentage points less White and 8 percentage points more Hispanic. The percentage of African American first graders dropped slightly, whereas the percentage of Asian American students increased a percentage point. The successive first-grade cohorts also became more economically disadvantaged—the percentage of FRL students went from 38% to over 50%, which roughly mirrored the national trend.
Profiles of the Sample and Population

Note. Numbers in parentheses represent the national population estimates derived from the Common Core Data. The population estimates for free or reduced lunch represent the percentages of elementary school children who qualified. NA = not available.
Measure
As mentioned in the previous section, the first-grade reading achievement data in the extant data set that we analyzed in this study comes from an early literacy measure, OSELA, consisting of six literacy subtests (Clay, 2013). The six OSELA tasks were individually administered to both the LA and RS groups at entry within the first three weeks of the start of their first-grade school year.
The OSELA total scores for all six tasks meet the NCRTI’s reliability, validity, classification accuracy, generalizability, and technical standards to identify children at risk of literacy failure (Center on Response to Intervention, 2016; D’Agostino, 2012). The six literacy tasks in this assessment tool, like many early literacy assessments, measure skills related to early reading achievement. In Table 2, we provide reliability and validity information; next we describe how each task measures a skill thought to be important to reading achievement.
Observation Survey of Early Literacy Achievement (OSELA; Clay, 2013)
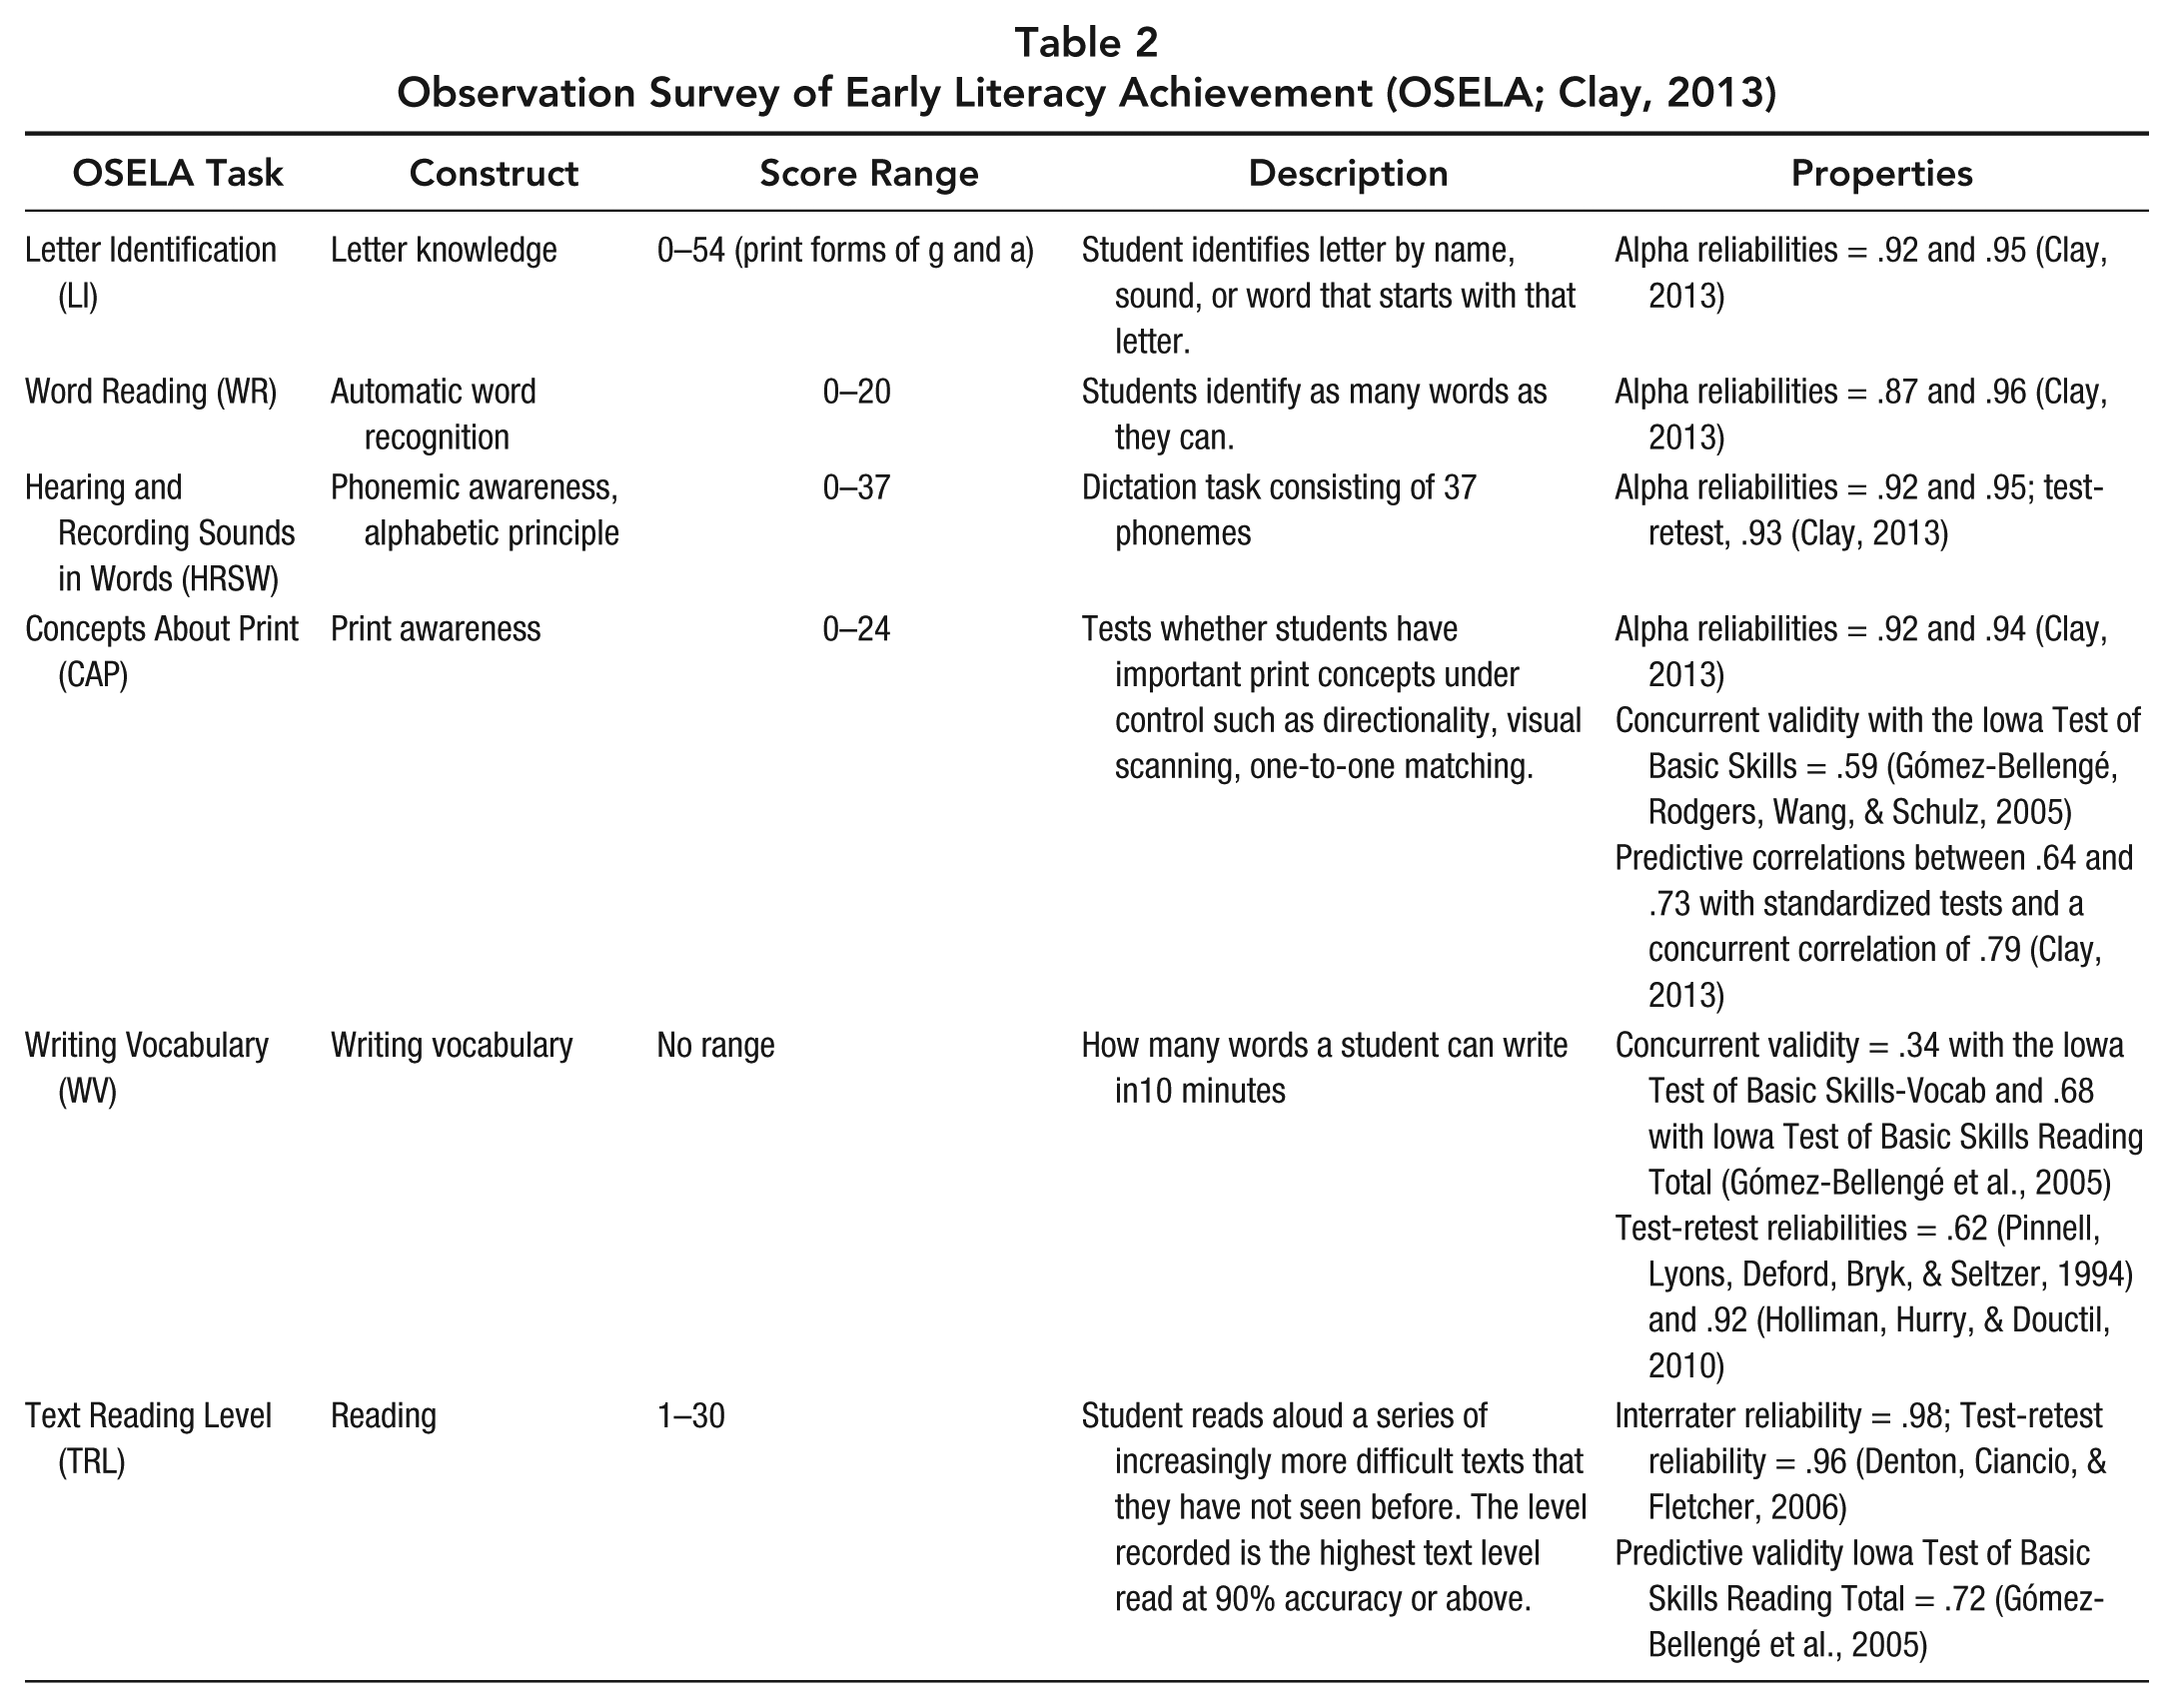
The Letter Identification (LI) task measures letter knowledge, a skill considered a strong predictor of later reading achievement (Piasta & Wagner, 2010) and to have a strong relationship to later decoding and spelling. Letter knowledge also has a moderate relationship with reading comprehension (NELP, 2008).
The Word Reading (WR) task measures automatic word recognition, a skill identified as vital for early reading development (Cunningham, Nathan, & Raher, 2011; Ehri, 1995; Stanovich, 2000). In fact, studies that evaluate the relationship between word recognition and written and oral language comprehension suggest that inadequate facility in word recognition impairs reading comprehension (Vellutino, Fletcher, Snowling, & Scanlon, 2004). Moreover, automatic word recognition is viewed by many as a vital component of early reading instruction (see Roberts, Christo, & Shefelbine, 2011).
The Hearing and Recording Sounds in Words (HRSW) task measures a student’s phonemic awareness, a critical emergent literacy skill that all children must develop (NICHD, 2000). Phonemic awareness is even thought to predict individual differences in reading achievement (Melby-Lervåg, Lyster, & Hulme, 2012).
The Concepts About Print (CAP) task measures print awareness, a closed set of knowledge that children must acquire about their own language (Paris, 2011) thought to represent important precursors to proficient reading (Justice & Piasta, 2011). These skills include such things as knowing that print and not the pictures contains the message to be read, knowing the directional rules of the language, being able to visually scan a word, and being able to differentiate a word from a letter. NELP (2008) identified concepts about print as being moderately correlated with later reading achievement.
The Writing Vocabulary (WV) task measures how many words a child can write independently in 10 minutes. Many curriculum-based measures test the production of written words because it is considered an indicator of general writing performance (Gansle, Noell, VanDerHeyden, Naquin, & Slider, 2002; Ritchey, 2006). A body of evidence and opinion supports the view that the quick, fluent written production of words differentiates expert writers from struggling writers (Graham, Berninger, Abbott, Abbott, & Whitaker, 1997; McCutchen, 1986). (For a review of early writing measures, see Harmey, 2015.)
It may be worth noting that the ECLS reading assessment framework does not include a measure of writing skills but not because writing was considered unimportant. Instead, a National Center for Education Statistics Working Series Paper cited practical constraints associated with scoring and referred to writing as being “notably absent” from the ECLS assessment battery (Rock et al., 2002).
The final OSELA task, Text Reading Level (TRL), is a measure of oral reading level. Unlike the other five tasks, TRL is not a proxy for reading, nor does it measure a reading skill; instead, it is the direct observation of reading, which according to Pearson and Hiebert (2010) is an important component of a reading measure when assessing children who are already reading. The student’s instructional level on the TRL task is considered to be the highest level read with at least 90% accuracy.
As is the case for all literacy batteries, the OSELA’s six tasks do not encompass every important early literacy skill that can be measured. There is no measure of rapid auto naming, for example, a skill that has a strong predictive relationship with later measures of reading development (Kirby, Georgiou, Martinussen, & Parrila, 2010; NELP, 2008). Nor does the OSELA include fluency or comprehension measures. That being said, because the OSELA does measure five important literacy skills and includes a measure of reading itself, it is reasonable to expect that the data obtained from the OSELA can be used to create a fairly robust literacy profile of beginning readers.
Analyses
Our first research question addressed change over time in the average literacy levels for LA and RS students separately. To examine the trends for each subsample and OSELA outcome, we computed Glass’s Δ effect sizes for each study year with the 2002 means and standard deviations of each group and test, respectively, serving as the baseline measures. That is, for each year and by test and subsample, we computed the effect size by subtracting the 2002 mean from each year’s average and dividing the difference by the 2002 standard deviation.
To address the second research question, we computed yearly Glass’s Δ effect sizes on each OSELA task by subtracting the LA mean from the RS average and dividing the difference by the standard deviation of the RS group for each respective year. Thus, an effect size increase over time revealed a widening of the achievement gap; an effect size reduction reflected a closing of the gap.
Besides plotting the Glass’s Δ values between LA and RS students, we examined the second research question further to address (1) if the achievement gap on each task changed significantly over time and (2) if the trends on each task differed significantly from one another by conducting hierarchical linear modeling (HLM) v-known analyses (for an explanation of HLM meta-analytic procedures, see Raudenbush & Bryk, 2002). More specifically, we calculated the average slope for each of the six OSELA tasks by computing a random effects HLM unconditional model (each task was treated as a case) in which the 12 yearly achievement gaps were nested within each of the six tasks.
The error variance of each effect size estimate, computed using methods described by Rosenthal (1994), were used to calculate weighted effect sizes as part of the HLM v-known analysis. The unconditional HLM models were:


where the effect sizes served as the outcome measure in year t on OSELA task i, which were predicted by a Time variable coded 0 (2002 baseline year) to 11 to represent each study year. The achievement gap estimate at each time for each task (Glass’s Δ ti ), therefore, was reflected by a baseline coefficient, π0i; a linear growth rate, π1i; and an error term, eti. We also squared and cubed Time and entered those variables as Level 1 predictors to examine possible quadratic (π2i) or cubic (π3i) polynomial trends.
At Level 2, the baseline estimates for each task were considered a function of the grand mean baseline across all tasks, β00, and the residual from the grand mean for each task, r0i. The most pertinent coefficients for this study were the achievement gap change rates over time per task, π1i, which were a function of the grand mean growth rate across all six tasks, β10, and the unique residual of each specific task, r1i. The achievements gap slopes per task were divided by their respective standard errors to produce t values to test the hypothesis that each slope was no different than zero (no gap change) and compared to one another by computing z tests following methods described by Paternoster, Brame, Mazerolle, and Piquero (1998).
We also conducted an alternative HLM analysis to address the same research question by treating the tests as fixed effect predictors. We conducted that analysis by creating a vector of dummy variables as Level 2 slope predictors and removing the unique residual associated with each test, r1i. The resulting slope coefficients and statistical tests were identical to the random effects procedures, but because the fixed effect approach required multiple dummy code sets in order to make every possible task slope comparison (especially in the polynomial slopes analyses), we decided to present the results from the more efficient random effects model.
Results
Overall Change in Literacy Achievement
We first examined by OSELA task the change in achievement for each successive LA and RS first-grade cohort over the 12 study years. To do so, we converted the mean achievement for each group into an effect size referenced against the group’s 2002 baseline mean and standard deviation. Figures 1a through 1f display the effect sizes on each OSELA measure for the LA and RS cohorts at entry to first grade. Note that on all six OSELA tasks, both groups experienced improved test score averages upon entry into first grade but that the magnitude of change over time depended on the specific task and group. The first two graphs, Word Reading and Text Reading Level, present situations in which the RS outgained the LA over time. RS cohorts displayed the second most amount of gain on word reading, and although the LA also gained considerably on that OSELA task, the gain was not as great as evinced by the widening gap across the years. Both groups gained less on the task measuring level of oral reading accuracy on leveled books (TRL), but again, the RS cohorts produced a greater degree of improvement compared to LA students, especially after 2007 (Figure 1b).
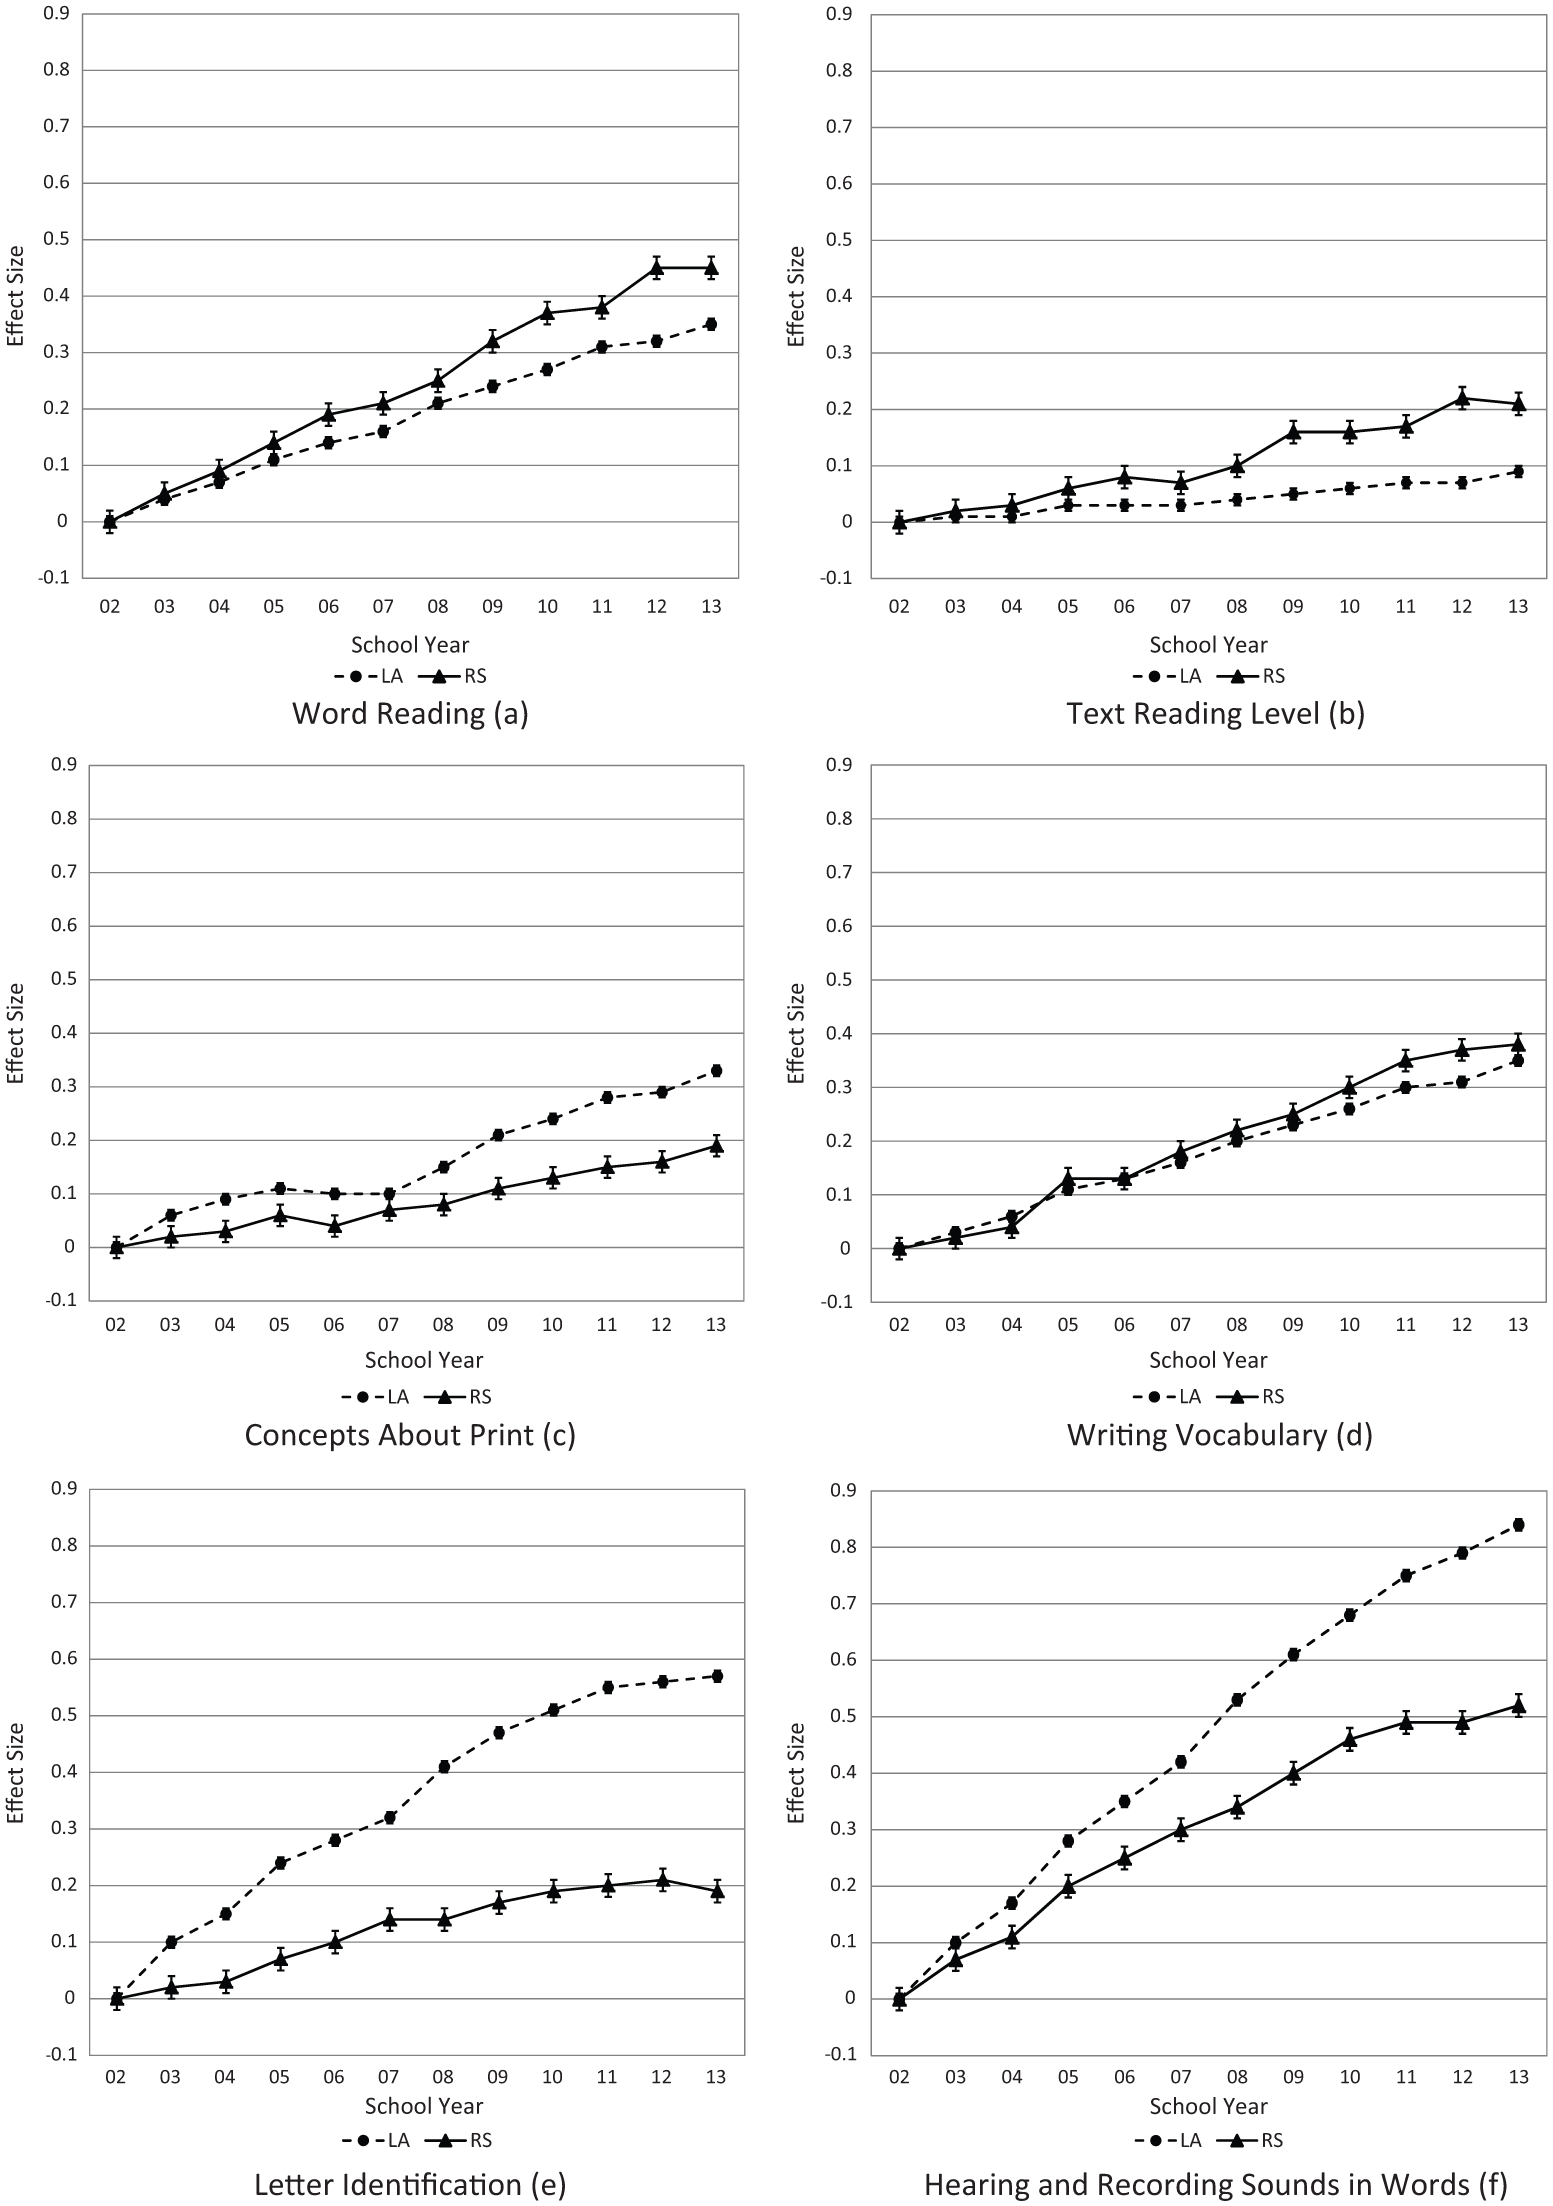
(a) Word Reading (WR) effect sizes (±1 SE) by year for low achieving (LA) and random sample (RS) students at entry to first grade. (b) Text Reading Level (TRL) effect sizes (±1 SE) by year LA and RS students at entry to first grade. (c) Concepts About Print (CAP) effect sizes (±1 SE) by year for LA and RS students at entry to first grade. (d) Writing Vocabulary (WV) effect sizes (±1 SE) by year for LA and RS students at entry to first grade. (e) Letter Identification (LI) effect sizes (±1 SE) by year for LA and RS students at entry to first grade. (f) Hearing and Recording Sounds in Words (HRSW) effect sizes (±1 SE) by year for LA and RS students at entry to first grade
RS students gained the least on CAP, while on that task, LA cohorts experienced considerable gain compared to their 2002 baseline (Figure 1c). Both groups improved reasonably well on WV (Figure 1d), but on LI, the LA group gained substantially while the RS group gained much less (Figure 1e). The greatest amount of improvement for LA and RS was on the phoneme (HRSW) measure, yet as can be seen in Figure 1f, the positive change was less steep for RS students compared to the LA cohorts on that measure.
Trends in Achievement Gaps on the OSELA Tasks
The trends presented in Figure 1 were based on each group’s relative change compared to the group’s baseline year, 2002. In order to produce a more uniform comparison between the groups, we computed effect sizes by subtracting the group means and dividing the difference by the RS standard deviation for each task and study year. We then conducted HLM v-known analyses to examine the LA-RS achievement gaps. The analyses indicated significant variation in the six achievement gap slopes, χ2(5) = 153.51, p < .001. Table 3 presents the estimated linear slopes for each of the six OSELA tasks along with tests of the hypothesis that each slope equals zero (e.g., the achievement gap for the ith task did not change over time). We rejected the null hypothesis in all six cases—each slope coefficient was found to be statistically different from zero, indicating significant gap change on all six tasks. The LI, CAP, WV, and HRSW slopes were negative, revealing that for those tasks, the gap narrowed. Because the WR and TRL slopes were positive, there was a widening of the gaps on those two measures. The slope values indicate the yearly predicted effect size change in the achievement gap for each task. In LI, for example, the achievement gap was reduced by an effect size of 0.008 per year. Over 12 years, the LI effect size gap was reduced by about 0.10. In TRL, the effect size widened by 0.007 yearly, or about 0.08 over 12 years.
Estimated Linear Slopes for Each of the Six Observation Survey of Early Literacy Achievement (OSELA) Tasks

Note. LI = Letter Identification; WR = Word Reading; CAP = Concepts About Print; WV = Writing Vocabulary; HRSW = Hearing and Recording Sounds in Words; TRL = Text Reading Level.
p < .05. **p < .01.
We also statistically compared each slope to the other five slope values. The z test values from those comparisons are presented in Table 4. The WR and TRL slopes were not significantly different from each other, but both slopes were significantly greater than the slopes of the other four measures. Among the four negative slopes, WV and CAP did not differ significantly, but the WV slope was found to be significantly greater (i.e., less gap reduction) than LI and HRSW. The slope for CAP did not differ significantly than the LI and HRSW slopes, and the latter two did not differ from one another. Thus, the gaps on the two more phonics-oriented measures, LI and HRSW, narrowed the most, while the WV gap narrowed the least. The CAP gap was in a gray area between LI and HRSW, and WV.
z Tests of the Between-Slopes Differences
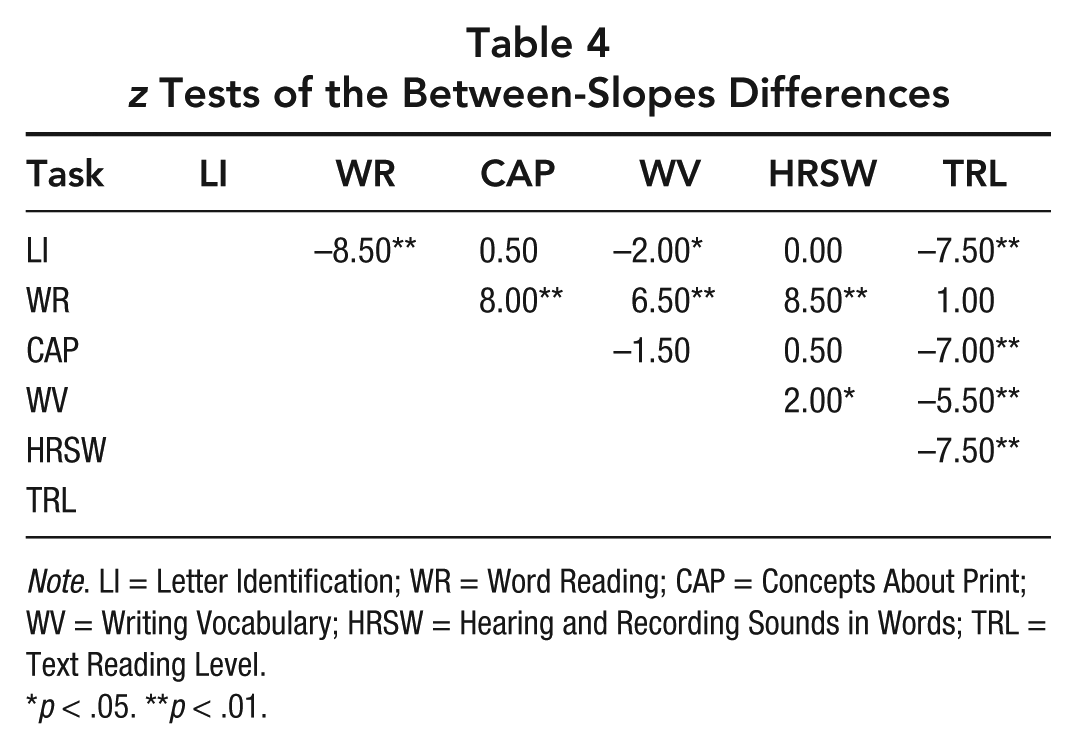
Note. LI = Letter Identification; WR = Word Reading; CAP = Concepts About Print; WV = Writing Vocabulary; HRSW = Hearing and Recording Sounds in Words; TRL = Text Reading Level.
p < .05. **p < .01.
Figures 2a through 2c display the RS-LA effect size differences on each task over time. We arranged the lines for each task by the direction and magnitude of the gaps, with the two gaps that widened (WR and TRL) presented in Figure 2a and the four gaps that diminished over time presented in Figures 2b and 2c. The former figure presents the trends for the two measures (CAP and WV) where the gaps narrowed slightly less over the 12 study years, and the latter graph presents the two measures for which the gap shrunk the most (LI and HRSW).
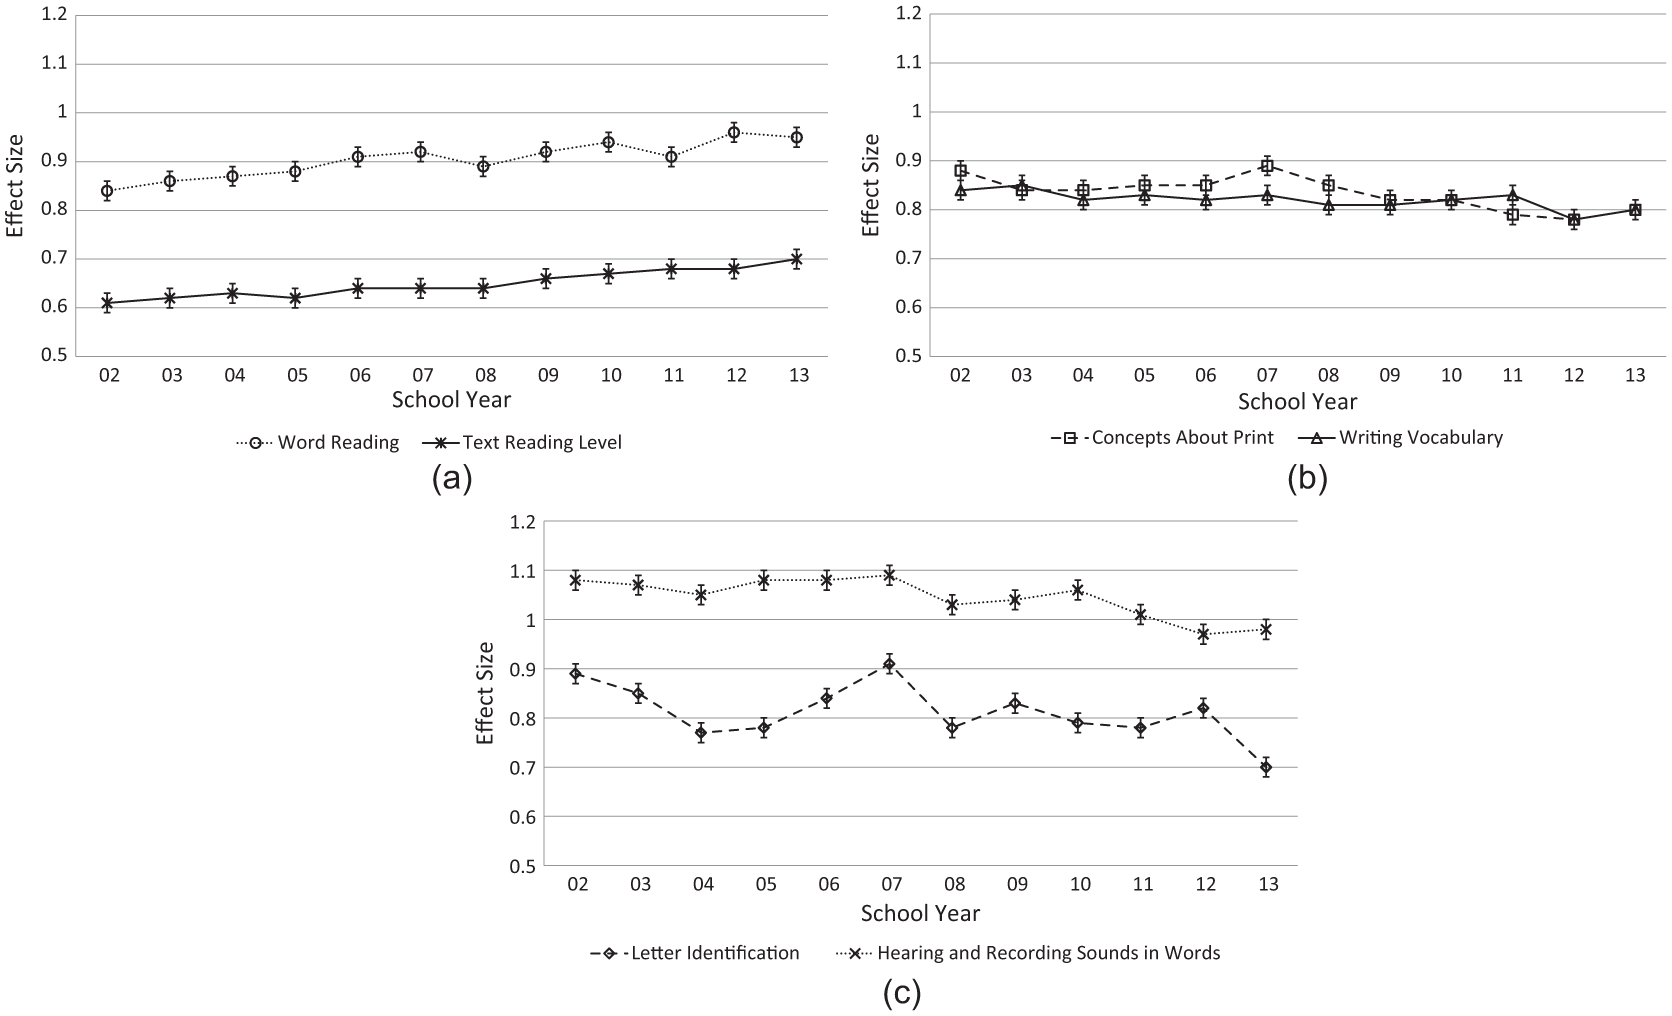
(a) Effect size gap (±1 SE) between low achieving (LA) and random sample students by year on Word Reading and Text Reading Level. The values increased over time on these two measures, indicating a widening of the gaps. (b) Effect size gap (±1 SE) between LA and RS students by year on Concepts About Print and Writing Vocabulary. The values decreased slightly over time on these two measures, indicating a narrowing of the gaps. (c) Effect size gap (±1 SE) between LA and RS students by year on Letter Identification and Hearing and Recording Sounds in Words. The values decreased substantially over time on these two measures, indicating a greater narrowing of the gaps
We also examined if the effect size trends followed nonlinear patterns over the 12 study years. The quadratic and cubic coefficients were not statistically significant for both OSELA tasks for which the gap widened (WR and TRL) and for writing vocabulary (WV). The trends for LI, HRSW, and CAP, however, did have significant polynomial patterns. It can be seen in Figure 2c that the gap for HRSW remained rather constant from 2002–2003 to 2007–2008 and diminished rather precipitously after 2007–2008. Thus, along with the linear trend, HRSW also followed a downward quadratic relationship. Note from Figure 2b that the CAP trend had a somewhat similar shape; although the pattern was less constant from 2002–2003 to 2007–2008, it remained rather steady but then dropped at a greater rate after 2007–2008. The quadratic coefficient also was statistically significant for CAP. The trend for LI followed the most nonlinear and erratic pattern (see Figure 2c). It dropped for the first three years, increased for the next three, and then followed a downward yet not perfectly linear pattern afterward. Both the quadratic and cubic coefficients were statistically significant for LI.
Discussion
Educators’ and policymakers’ expectations about children’s literacy learning before first grade continue to increase despite a lack of empirical knowledge about what these beginning readers know and can do and whether and how their achievement is changing over time. We used an existing database to create a literacy profile of students at entry to first grade over a 12-year period from the 2002–2003 to 2013–2014 school years. This continuing assessment data for a cross-section of children from recent years allowed us to describe what beginning readers in these schools were able to do at a time when substantial changes were just beginning to occur in pre–first grade to more current school years when those changes had ample time to take effect. From our analysis of both low- and average-achieving first-grade students’ OSELA tasks scores across the 12 study years and the gaps on the measures over time between the two groups, two main themes emerge for discussion.
Literacy Scores of Entering First Graders Increased Over Time
We found that each successive cohort of students started first grade with increasingly higher scores on all six tasks of the OSELA, a trend similar to that reported previously for 9-year-olds (National Center for Education Statistics, 2013) and students in Grades 4, 8, and 12 (Center on Education Policy, 2008). This upward trend applied to both the RS and the LA groups even as the cohorts became more diverse and more economically disadvantaged over the 12-year period (see Tables 1 and 2 and Figure 1).
Like the LA, the RS’s greatest gain, although not as great, was in phonemic awareness. The LA group made their next greatest gains on letter identification, a trend similar to that reported by West, Denton, and Reaney (2000), who found that the lower achieving students in their 1998 kindergarten sample made their greatest gains on more basic literacy measures such as knowing their letters. The early cohorts of the RS already knew most of the 54 letters and did not have as far to go over the 12-year period as the LA.
These similar trends for both groups ostensibly support Pearson and Hiebert’s (2010) supposition that letter naming and phonological awareness instruction has intensified in the early grades, perhaps at least partially as a result of the recommendations stipulated in the National Reading Panel’s (NICHD, 2000) and National Early Literacy Panel’s reports (NELP, 2008). We assume that we have the chronology correct, that phonemic awareness and alphabet knowledge improved following the two national reports, given the observation made in the NRP report that “in kindergarten, most children will be nonreaders and will have little phonemic awareness” (NICHD, 2000, p. 2-6) and in the NELP (2008) report that “even in the best of circumstances, most young children develop few conventional literacy skills before starting school” (p. vii).
Our finding that the LA students’ fall effect sizes increased steadily over time lends support to Lemons et al.’s (2014) hypothesis that the counterfactual in literacy intervention research may be changing. It seems reasonable, from our findings at least, to expect to see control groups in early intervention studies achieving higher scores on literacy measures than they were even just a decade ago. As Lemons and colleagues noted, and we agree, literacy interventions may need to reexamine their norms, particularly if they are dated. We likely need to reset the bar on what we expect low achieving students in literacy interventions to be able to know and do to reach the average levels of their peers. Apparently, not only is the counterfactual improving somewhat but so too is the general population of first-grade students.
Achievement Gaps Narrowed on Basic Skills but Widened on Advanced Skills
We found a narrowing of the literacy achievement gap over the 12-year period between the LA and RS groups on four tasks of the OSELA: Letter Identification, phoneme awareness (HRSW), Concepts About Print, and to a lesser extent, Writing Vocabulary. The narrowing of the gap, primarily in LI and HRSW, may indicate that pre–first grade instruction focused on item knowledge (e.g., phonemic awareness and letter identification) and was more beneficial for low achieving students, which supports the findings of prior research based on the ECLS 1998 data that focused on test item difficulty analysis by subject area (West, Denton, & Reaney, 2000) and the analysis of instructional effectiveness by initial achievement level (Xue & Meisels, 2004).
For three tasks, LI, HRSW, and CAP, the gap reduction trend had nonlinear characteristics as well. For both CAP and HRSW, the gap narrowed more dramatically after the 2007–2008 school year, while in LI, the gap narrowed, then widened, but then shrunk again after 2007–2008. It is not entirely clear why the gaps for those three measures diminished to a greater extent after that time point. It could be that expectations and curricular changes in pre–first grade took some time to take effect, but once they did, the effect in closing the gap was quite dramatic.
It was not the case, however, that struggling readers completely closed the gap on the phonemic awareness measure or that by the time they entered first grade they had learned all of their letters. In fact, the achievement gap for HRSW in 2013–2014 was about .98, which was considerably larger than the gap for TRL (.70) and about the same magnitude as for WR (.95). The LI gap was reduced from .90 to .70 over the 12 years, but in 2013–2014, it was still as large as the TRL gap.
Our results therefore do not suggest that early reading instruction should abandon its emphasis on letter identification and letter-sound instruction; these are critical foundational skills, and as evidenced by our findings, some children are still entering first grade not knowing all of their letters and still struggling with letter-sound knowledge. We suggest wide gaps will persist between below average and average students on letter identification and phonics if instruction on those skills is omitted.
It also seems that while the LA group made steady progress on basic but important skills, the RS pulled away from them on two more advanced measures: Word Recognition and Text Reading Level. Given that good readers are better at context-free word recognition than poor readers (Stanovich, 2000), it is not surprising to observe “paired” gains on both tasks.
The widening gap between the two groups, however, on these two key measures, word reading and text reading, does give cause for alarm for students who are struggling with early reading and falling behind their peers. The fact that the low achieving students are falling behind their peers in both skills only serves to underscore our finding that the low achieving students are truly not performing as well as their peers.
The narrowing of the letter identification and phonemic awareness gaps has not translated into struggling readers catching up in word recognition and actual reading; instead, those gaps widened. In a sense, our results partially support Pearson and Hiebert’s (2010) claims that it is critical not to forsake pre–first grade instruction on developing a sight vocabulary and reading connected text.
Instead, our findings speak to the need to offer a more comprehensive early year curriculum than promulgated by the NELP and NRP reports, whose assertions about “most” students’ lack of basic skills in 2000 and 2008 may be quickly becoming out of date. We note for example that scores on the Concepts About Print task, an early literacy skill identified by the NELP as being moderately correlated with later reading achievement, saw the least amount of change over the 12-year period, and unlike letter knowledge, this lack of change cannot be attributed to students already scoring at proficient levels with that measure. Concepts About Print improves with exposure to texts. Children learn about how print works (directionality, differentiating words from letters) by being exposed to print in text.
Limitations
We do not know how representative the sample of 2,358 schools was in terms of instructional emphases because the database did not contain that information; we did, however, have data on the assessments used in these schools over the 12 years. We counted six different assessments in use across our sample of over 2,000 schools: the Developmental Reading Assessment (Beaver, 2006), DIBELS (Good & Kaminski, 2002), OSELA (Clay, 2013), Measures of Academic Progress (MAP) assessment (Wang, McCall, Jiao, & Harris, 2013), AIMSweb (Shinn & Germann, 2006), and PALS (Invernizzi, Meier, & Juel, 2007). The wide variety of assessments in use and the fact that no specific instructional program is required at any grade level to implement RR lead us to conclude that our sample of schools likely represented a range of classroom instructional approaches.
Conclusion
Although our findings document student achievement at entry to first grade and not entry to school, they do lend support to parents’ and teachers’ reports that kindergarten students are now more ready to learn to read than they were (see Bassok et al., 2016). In this regard, rising standards for most beginning readers do seem justified in that across both groups over the 12-year period, we found increasingly higher scores on all six OSLEA tasks.
It seems reasonable to conclude that reports such as those produced by the NELP and NRP, as well as legislation such as the No Child Left Behind, led to an increased emphasis on learning important skills in the early grades that are related to reading achievement. Apparently the reports and legislation may have achieved at least some of their desired effect to impact basic skills in that we found evidence of an upward trend in letter identification and phonemic awareness for all students.
While our findings seem to be in step with rising literacy expectations for kindergarten students, however, concern about a growing literacy achievement gap seems justified given the differential growth pattern for the LA and RS students. Apparently, kindergarten benefitted the lower achievers more on important basic skills, but it did not help them learn how to read relative to students of average proficiency or help them close the gap on word reading. Instead, we see a growing gap over the 12-year period on reading text and word reading.
Taken together, our findings suggest that most students, but certainly not all, have acquired the basic understandings about letter knowledge and phonemic awareness that the authors of the NRP and the NELP asserted 10 to 15 years ago were so important for early readers to acquire. Lower achieving students continue to need attention to these skills, and it appears more focus needs to be paid to reading whole texts. At the same time, careful attention must be paid to low achieving students; their improvement on basic skills is noteworthy, but their falling further behind on word reading and text reading is alarming.