




Abstract
We use data from 2015–2016 to document faculty representation and wage gaps by race-ethnicity and gender in six fields at selective public universities. Consistent with widely available information, Black, Hispanic, and female professors are underrepresented and White and Asian professors are overrepresented in our data. Disadvantaged minority and female underrepresentation is driven predominantly by underrepresentation in science and math intensive fields. A comparison of senior and junior faculty suggests a trend toward greater diversity, especially in science and math intensive fields, because younger faculty are more diverse. However, Black faculty are an exception. We decompose racial-ethnic and gender wage gaps and show that academic field, experience, and research productivity account for most or all of the gaps. We find no evidence of wage premiums for individuals who improve diversity, although for Black faculty we cannot rule out a modest premium.
Keywords
Recent unrest at college campuses across the United States has put renewed focus on the issue of faculty diversity. Student organizations at numerous universities have issued demands of administrators that call for a more explicit focus on recruiting disadvantaged minority and female faculty. For example, the Legion of Black Collegians at the University of Missouri has demanded an increase in the percentage of Black faculty and staff campuswide to 10% by 2017–2018. Similarly spirited demands have been made by groups at many universities, including Who’s Teaching Us? at Stanford University, Liberate MSU at Michigan State University, and the Irate 8 at the University of Cincinnati, among others.
Although it is straightforward to obtain aggregate data on faculty representation at universities (e.g., from a source like the Integrated Postsecondary Education Data System [IPEDS]), contemporary policy discussions would benefit from more detailed information. For example, it would be useful to know how faculty diversity compares across fields and whether universities are behaving in a way consistent with placing independent value on a faculty member’s contribution to workforce diversity. To inform these questions, we use new data to examine racial-ethnic and gender diversity, and wage gaps, at 40 selective public universities. Our data cover faculty in six academic departments that we selected to be inclusive of science, technology, engineering, and mathematics (STEM) and non-STEM fields—biology, chemistry, economics, educational leadership and policy, English, and sociology—and are taken from the 2015–2016 academic year.
Our analysis of faculty representation overall reveals anticipated results: Black, Hispanic, and female faculty are underrepresented relative to their U.S. population shares, whereas Asian, White, and male faculty are overrepresented. 1 When we break our results out by field, the underrepresentation of Black, Hispanic, and female faculty is shown to be driven pre-dominantly by underrepresentation in STEM fields (biology, chemistry, and economics). 2 In non-STEM fields (educational leadership and policy, English, and sociology), the degree of underrepresentation of Black, Hispanic, and female faculty declines substantially, and in some cases, these groups are not underrepresented at all. 3 Patterns of race-ethnicity and gender representation by field in our faculty data generally align with analogous representation patterns in field-specific PhD production data.
We also examine faculty representation by rank. Comparing assistant professors to their senior colleagues provides insight into the future of faculty diversity. Our findings suggest that a more diverse workforce is building in higher education. Assistant professors are less likely to be White, more likely to be Asian and Hispanic, and less likely to be male than associate and full professors. Evidence of increasing diversity among junior faculty is apparent in all of the fields we study and particularly in STEM (also see Nelson & Brammer, 2010). The exception is for Black faculty: Although the representation of Black faculty in non-STEM fields is improving modestly, in STEM fields, Black faculty are just as underrepresented among junior faculty as they are among senior faculty.
Finally, we document and decompose faculty wage gaps by race-ethnicity and gender. Unconditionally, Black and Hispanic faculty have significantly lower annual earnings than White faculty and, to a lesser extent, Asian faculty. Our decompositions indicate that three observable factors can entirely explain racial-ethnic wage gaps: academic field, work experience, and research productivity. These same three factors account for a large fraction of the gender wage gap as well; however, unlike with the racial-ethnic gaps, they do not fully explain wage differences by gender.
In a concluding section, we briefly discuss the policy implications of our study. A simple takeaway is that STEM and non-STEM fields exhibit very different diversity conditions, which merits consideration in the design of policies to increase faculty diversity. Our wage decompositions identify the key factors that account for differences in faculty wages across racial-ethnic and gender groups, which can be used to guide policies aimed at mitigating these differences. Finally, our analysis of wages give no indication of a wage premium for faculty who contribute to workforce diversity. This result is inconsistent with a model in which a faculty member’s contribution to diversity is valued as an independent contributor to productivity, although it could also reflect a lack of wage flexibility along race and gender lines afforded to universities even in the presence of an explicit valuation on diversity.
Data
Our sample consists of faculty from 40 selective public universities ranked highly by the 2016 U.S. News & World Report, as listed in Appendix A. 4 We collected data from faculty rosters as published on department websites at the sampled universities during the 2015–2016 academic year. The data were collected manually, and as such, it was not feasible to include all faculty at all 40 universities. Instead, we used a sampling strategy focusing on faculty in the six above-described academic departments. We selected three of the six departments at random at each university, and for each selected department, we collected data from every faculty member listed on the department website whose position involved at least some teaching. 5 We focus our primary analysis on tenure-track faculty but show results that include non-tenure-track teaching faculty in Appendix B (available on the journal website). Appendix A documents the departments at each university that are included in our analytic sample.
Our use of data from all listed faculty members in each university-by-department cell we sampled offers an important advantage over survey-based studies, where individual respondents may choose not to participate. Of direct relevance to our research questions, Bollinger, Hirsh, Hokayem, and Ziliak (2014) show that survey response rates can differ by race and, moreover, correlate differentially with earnings outcomes for men and women. This type of self-selection into survey participation raises questions about the ability of survey data to inform the questions we pursue. The most widely used data to study faculty wages in previous research comes from the National Study of Postsecondary Faculty (NSOPF) administered by the National Center for Education Statistics, which was discontinued in 2003–2004. The 2003–2004 NSOPF faculty survey had a response rate of 76%.
For each sampled university-by-department cell, we collected data on faculty demographics, qualifications, salaries, and measures of research productivity. Table 1 provides descriptive statistics for our data set of tenure-track faculty (Appendix Table B1, available on the journal website, further breaks out the descriptive statistics by field). Note that although we evenly sampled departments across universities (subject to random sampling variability; see Appendix A), faculty in our data are disproportionately in STEM fields. This is because academic departments in these fields tend to be larger.
Descriptive Statistics for Our Sample

The rankings for PhD-granting institutions are taken from the 2016 U.S. News & World Report, inclusive of private institutions. There are 56 faculty in sampled English departments who do not have a PhD. These faculty have master of fine arts (MFA) degrees instead (an MFA can be a terminal degree in the fine arts and performing arts).
We report the sources of experience data where the options are (in order of our preference for where the data come from) (a) the faculty member’s own profile based on the year the PhD was obtained, (b) the faculty member’s own profile based on the year of the first publication, and (c) the year of the first publication reported in Scopus. For 2% of faculty, we were unable to calculate experience using any of these three sources.
Wage data for faculty at most public universities are published by government agencies and freely accessible. Our aim was to collect data on base pay for faculty in each state. Although in many states base pay is clearly labeled in agency reports, this is not always the case. Thus, in some states it may be that the earnings data include some supplemental salary. Although our sense is that this is rare, it is a source of measurement error in the wage data. That said, empirically we do not anticipate this causing a significant problem, because we use wages as the dependent variable in our analysis of earnings, and in addition, our wage regressions include university fixed effects that will net out wage-reporting differences across states on average. Moreover, despite this potential limitation, our wage data offer a number of benefits over survey data—which have been commonly used in previous, similar research to obtain faculty wage information—including (a) what is likely to be a significant reduction in measurement error owing to mistakes in self-reporting and (b) our ability to mitigate the potential for selective responses correlated with earnings (Bollinger et al., 2014) by pulling data from all faculty in sampled departments.
Of all tenure-track faculty included on the rosters we sample, wage data were available for 94%. The primary reason for missing wage data—and in fact the only reason we can identify, given the comprehensive nature of wage reporting for public employees—is that the faculty member is new to the university or was on leave and did not draw a salary during the previous year. This generates missing data because wage data are posted by government agencies with a lag. Consistent with this explanation, in Appendix Table B2 (available on the journal website) we show that being a young professor is by far the strongest predictor of missing wage data. 6
The qualification data we collected include the faculty member’s rank, years of experience, and the prestige of the PhD-granting institution. Ideally, and for most faculty, we measure experience from the year the PhD was obtained as reported on faculty websites or curricula vitae (CVs). In cases where a faculty member’s profile does not indicate the year of the PhD, we measure experience by the time since the first registered publication, on either the faculty member’s website (first choice) or Scopus (second choice). Between these various sources, we obtain experience measures for 98% of our sample. 7 The PhD-granting institution is taken from each faculty member’s profile and is available for 94% of faculty. We divide PhD-granting institutions into four groups based on their ranking in U.S. News & World Report, inclusive of private universities, as shown in Table 1.
We collected research-productivity data from Scopus, including the number of publications, number of citations, and h-index for each faculty member. For each metric, we create standardized measures of productivity within fields as follows:

where
The most important elements in our data set are the demographic measures—that is, the racial-ethnic and gender designations. Although such measures are straightforward to obtain in respondent-driven data sets given their self-reported nature, obtaining these designations in our case is more complicated. In short, we relied on visual inspections of faculty pictures (found on faculty websites and elsewhere on the Internet as available), origins of names, and in some cases, biographical details (e.g., the country of the undergraduate institution listed on the CV) to assign racial-ethnic and gender designations to faculty. We group faculty into one of five possible race-ethnicity categories: Black, Asian, Hispanic, White, and Other/unknown. We use three gender groups: male, female, and unknown.
We could speculatively debate the conceptual merits of our approach to collecting race-ethnicity and gender designations in some detail. One notable point is that unlike data sets that rely on respondents’ own input, our designations are best described as race-ethnicity and gender “appearance measures.” This approach has both benefits and costs given our research objectives. Rather than delving into an extended conceptual discussion, we evaluate our data empirically. 8 Specifically, we ask how well the racial-ethnic and gender shares in our data compare to related available numbers.
Table 2 compares the race-ethnicity and gender shares in our data with data from the IPEDS from 2014 (i.e., the most recently available data from IPEDS). IPEDS data can be used to measure faculty diversity at universities, but the data are not broken out by field. We compare the race-ethnicity and gender shares in our full sample to the full IPEDS sample of Research I universities and to IPEDS data from the same 40 institutions we study. Overall, the race-ethnicity and gender shares in our data are a close match to the IPEDS shares, particularly when one recognizes that we sample a small and selected fraction of the academic departments upon which the IPEDS numbers are based. 9
Comparison of Racial-Ethnic and Gender Representation in Our Data and Integrated Postsecondary Education Data System (IPEDS) (in percentages)

Note. Each cell reports the percentage of the sample indicated by the column that is accounted for by the group indicated by the row. In the IPEDS data, we construct a comparable other/unknown group for race-ethnicity by combining faculty identified as American Indian or Alaska Native, Native Hawaiian or other Pacific Islander, two or more races, and race-ethnicity unknown. The group of faculty identified as being of two or more races contributes to the larger other/unknown group in the IPEDS data; there is no way for us to code such a category in our study. There is only one faculty member in our data set for whom gender is coded as unknown (0.0002%).
Although the comparisons in Table 2 are of some comfort and suggest that our data are broadly consistent with related data from other sources, surely there are some inaccuracies. To quantify the scope for errors in our data, we examine the interrater reliability of faculty designations by using two different raters to code race-ethnicity and gender designations for 400 faculty in our data set. This exercise yields high interrater reliabilities. For the racial-ethnic designations, interrater reliability is 95.5%; for the gender designations, it is 99.75% (i.e., 1 inconsistency in 400).
Racial-Ethnic and Gender Representation Among Faculty
Table 3 shows field-specific race-ethnicity and gender representation in our data. We also show population shares using data from the 2010 Census as one point of comparison for the faculty representation numbers. Another useful comparison is to the pool of qualified workers, which we address below in Table 4.
Faculty Diversity by Field and U.S. Population Diversity (in percentages)
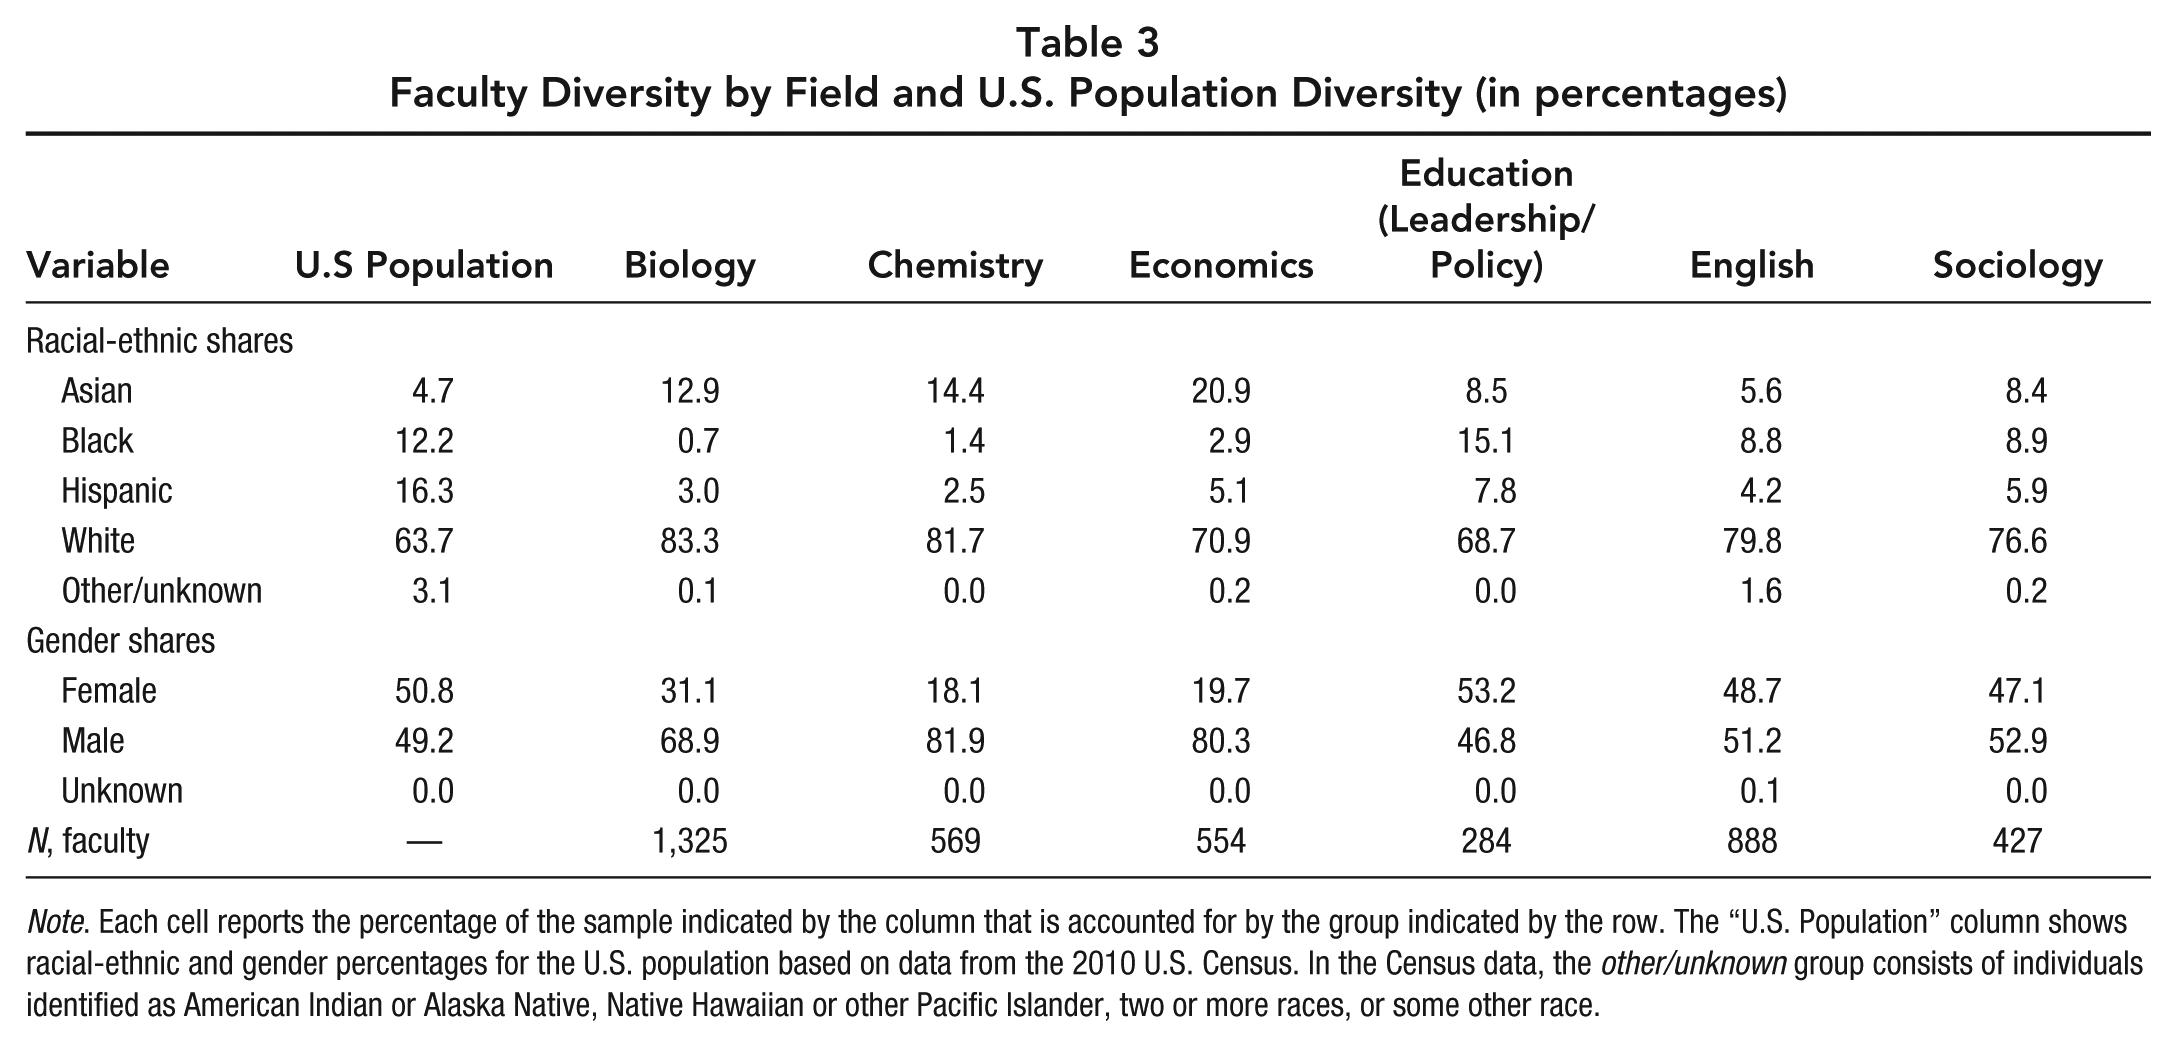
Note. Each cell reports the percentage of the sample indicated by the column that is accounted for by the group indicated by the row. The “U.S. Population” column shows racial-ethnic and gender percentages for the U.S. population based on data from the 2010 U.S. Census. In the Census data, the other/unknown group consists of individuals identified as American Indian or Alaska Native, Native Hawaiian or other Pacific Islander, two or more races, or some other race.
Comparison of Race-Ethnicity and Gender Representation by Field in PhD Production Data From the Survey of Earned Doctorates (SED) at Top 50 Universities and Among Assistant Professors in Our Data (in percentages)

Note. The first number in each cell is the SED percentage of degrees produced by field in 2013–2014 at top 50 universities; the second number, in square brackets, is the percentage of assistant professors in that field in our data from 2015–2016. The SED data are restricted to doctorate recipients who graduated from universities on the U.S. News & World Report “Best Colleges 2016” list of top 50 universities, inclusive of private universities.
Starting with Table 3, our data highlight a stark contrast dividing the STEM fields—biology, chemistry, and economics—and non-STEM fields—educational leadership and policy, English, and sociology. Black and Hispanic representation in STEM ranges from 0.7% to 2.9% and from 2.5% to 5.1% across fields, respectively, versus from 8.8% to 15.1% and from 4.2% to 7.8% across non-STEM fields. Particularly for Black faculty, the representation differences between STEM and non-STEM fields are large. Gender representation follows a similar pattern: Female representation ranges from 18.1% to 31.1% in STEM fields and from 47.1% to 53.2% in non-STEM fields.
In Figure 1, we provide complementary information to Table 3 by documenting differences in representation in STEM and non-STEM fields between assistant and associate/full professors. The rank separation is of interest for two reasons. First, representation at the assistant professor level can be viewed as a leading indicator of faculty diversity in the future. 10 The comparison reveals that representation of Asian, Hispanic, and female faculty among assistant professors is significantly higher than among associate/full professors, particularly in STEM fields. However, for Black faculty, although there is a modest increase in representation in non-STEM fields, there is no indication of diversity progress in STEM in the assistant professor data.
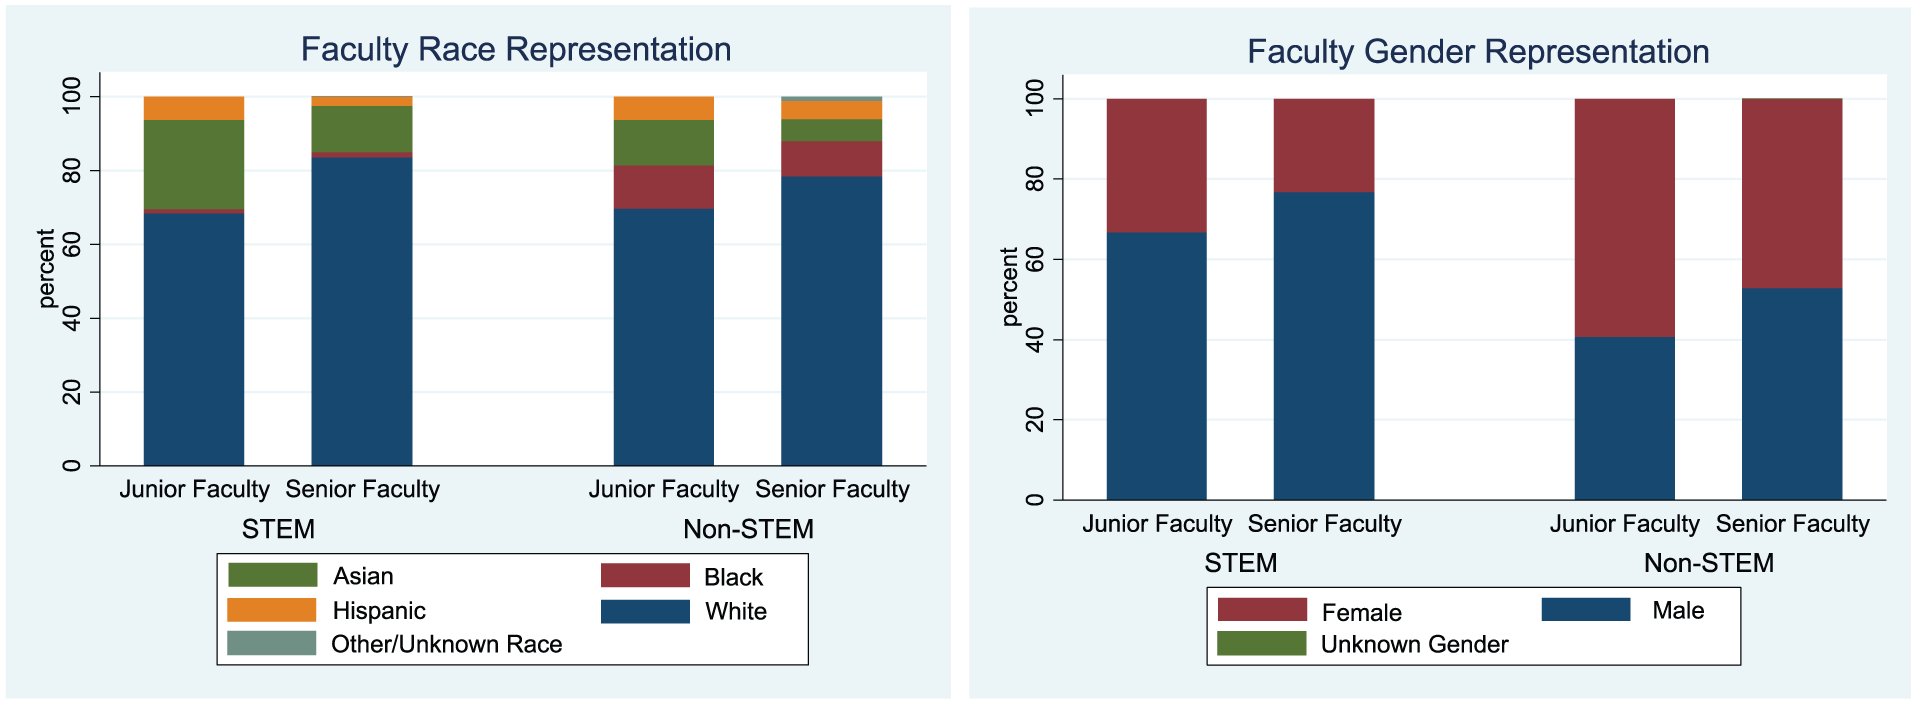
Faculty representation by field, split by assistant and associate/full professors in STEM (biology, chemistry, economics) and non-STEM (educational leadership/policy, English, sociology) fields
The second benefit of focusing on assistant professors is that it allows us to connect representation among young faculty to recent PhD production rates by field, as indicated by the Survey of Earned Doctorates (SED) from the National Center for Science and Engineering Statistics. The SED is a national survey of recent doctoral recipients. In Table 4, we show PhD production rates by race-ethnicity, gender, and field for U.S. citizens and permanent residents from the SED, which we compare to racial-ethnic and gender shares among assistant professors in our data. 11 Because the selective public universities in our sample are likely to draw primarily from selective programs for new hires, we limit the SED production data to include only universities in the top 50 of the U.S. News rankings, inclusive of private universities. The SED data are taken from the 2013–2014 academic year; PhD production rates in 2013–2014 should be highly relevant for assistant professors in 2015–2016. 12
The patterns in the SED data broadly reflect patterns in our assistant professor data. This points toward the PhD pipeline as a key source of racial-ethnic and gender imbalance among faculty (also see Ginther et al., 2010), but there are some points of divergence. For instance, even conditional on PhD production rates, Black faculty are consistently underrepresented as assistant professors in STEM fields at the selective universities we study. Alternatively, they are overrepresented among assistant professors relative to their PhD production rates in all three non-STEM fields (albeit only marginally in educational leadership and policy). The picture for Hispanic faculty is mixed, and although there is variability across fields, no indication of systematic over- or underrepresentation among assistant professors relative to PhD degree production is apparent. Asian faculty are significantly overrepresented as assistant professors relative to domestic degree-production rates in all fields except in sociology. Some of the overrepresentation of Asians among junior faculty is surely driven by in-migration of students from other countries into domestic PhD programs, which is not accounted for in the SED numbers (as noted above, the SED reports only PhD production rates by field for U.S. citizens and permanent residents). White faculty are overrepresented relative to PhD production in biology, and to a lesser extent educational leadership and policy, but underrepresented in all other fields, most notably in economics. In terms of gender, representation among assistant professors relative to PhD production rates varies somewhat across fields but is generally fairly even, and no consistent gender gaps emerge along STEM/non-STEM lines.
Wage Decompositions
In this section we decompose racial-ethnic and gender wage gaps into their observed components using the method of Gelbach (2016). The foundation of our decompositions is the following linear regression model:

In Equation (2), Yijk is the annual salary for faculty member i at university j in field k, in dollars.
13
The X vector includes years of experience, Scopus measures of research productivity, and indicators for the prestige of the PhD-granting institution. Recall from above that the experience information comes from several different sources; our regressions also include indicator variables to identify the source of the experience data. 14 Of the three normalized productivity measures from Scopus, we include just the h-index in our preferred wage models, as it is the most predictive over wages. We interact the normalized h-index with field indicators to allow for differential returns to productivity across disciplines. In Appendix Table B4 (available on the journal website) we confirm that our wage gap findings are qualitatively unaffected if we include all three Scopus measures simultaneously in the model. Finally, for the prestige of the PhD-granting institution, we use the categories shown in Table 1 to divide universities. We also include missing-data indicators as appropriate in cases where some data elements are unavailable for individual faculty. 15
Table 5 shows racial-ethnic and gender wage differences estimated from progressively detailed models. Column (1) reports unconditional wage gaps from a model that excludes the X vector and university and field fixed effects. Column (2) adds university fixed effects, column (3) adds field fixed effects, column (4) adds the prestige of the PhD-granting institution, column (5) adds experience, and column (6) adds the normalized h-index interacted with field, which fills out the full model as shown in Equation (2). We include individuals with unknown race-ethnicity and gender for completeness in the models; however, as indicated by Table 1, they account for a very small fraction of our sample (less than 0.5%), and thus strong inference is not warranted. The coefficients for the control variables are omitted from Table 5 for brevity but provided for interested readers in Appendix Table B5 (available on the journal website).
Wage Regressions

Note. The omitted groups are White and male faculty. Standard errors clustered at the university level are reported in parentheses. The sample size is smaller than in the preceding tables because individuals without wage data are excluded from the regressions. Coefficient estimates for all variables in the full model, as estimated in the last column, are reported in Appendix Table B5 (available on the journal website).
p < .10. **p < .05.
Column (1) of Table 5 shows that unconditional wage gaps favor White faculty and men, who are the omitted groups. In the racial-ethnic comparisons, Black and Hispanic faculty have significantly lower wages than White faculty, on the order of roughly $10,000 to $15,000 annually, or 8% to 12% of the average wage ($120,195; see Table 1). The unconditional gender gap is larger, at just over $23,000. The table shows that racial-ethnic and gender gaps moderate as more information is included in the model. In the final column, the racial-ethnic gaps disappear. In fact, they nominally favor Black and Hispanic faculty relative to White faculty, although the differences are not statistically significant. The gender gap attenuates significantly after including available controls but remains statistically significant at about $4,000. These results are consistent with previous, related evidence. 16
Next, in order to understand the factors that drive observed wage gaps, we decompose the gaps into the following components: (a) differences in universities, (b) differences in fields, (c) differences in experience, (d) differences in the prestige of the PhD-granting institution, and (e) differences in research productivity. It may be tempting to read across the columns in Table 5 to assess the relative importance of these factors. However, this can be misleading because the order by which the variables are added can affect their implied explanatory significance. Gelbach (2016) shows that a number of previous high-profile studies have inaccurately estimated component weights in various decomposition exercises by relying on sequence-dependent methods. The sequence-invariant method developed by Gelbach and used in our study solves this problem.
The key feature of Gelbach’s (2016) approach that makes it order invariant is that the parameter estimates upon which the decomposition is based come only from of the full specification. Intermediary specifications are ignored. We illustrate following Gelbach’s notation. Suppose we have an nx1 outcome vector,

Thus, decomposing this formula is equivalent to decomposing the differences between the restricted- and full-model coefficients of interest:

Defining
We decompose racial-ethnic and gender wage gaps into five covariate groups: university, field, experience, prestige of the PhD-granting institution, and research productivity. When the number of covariates is large as in our study, Gelbach (2016) proposes a way to simplify the computation process. First note that for covariate group g, the explained wage gap is

The values in Equation (5), which capture the explanatory power for each group of covariates, g, can be recovered by applying the following procedure as outlined by Gelbach (2016, p. 523):
Estimate the full model (in our application, this is the model shown in the last column of Table 5).
For each faculty observation i, sum the contributions of the decomposition covariates
In auxiliary OLS regressions, regress the heterogeneity variables
Table 6 shows results for our decompositions of wage gaps for Black, Asian, and Hispanic faculty relative to White faculty and for women relative to men. 19 Negative numbers in the table correspond to factors that exacerbate the gaps; positive numbers indicate factors that shrink them. At the bottom of Table 6, we show the percentage of each unconditional wage gap explained by the observable factors in our data set. Values in excess of 100% reflect cases where the direction of the gap changes going from column (1) to column (6) of Table 5. 20 Values below 100% indicate that the observable factors in our data are insufficient to fully explain the wage difference.
Decompositions of Wage Gaps by Race-Ethnicity and Gender
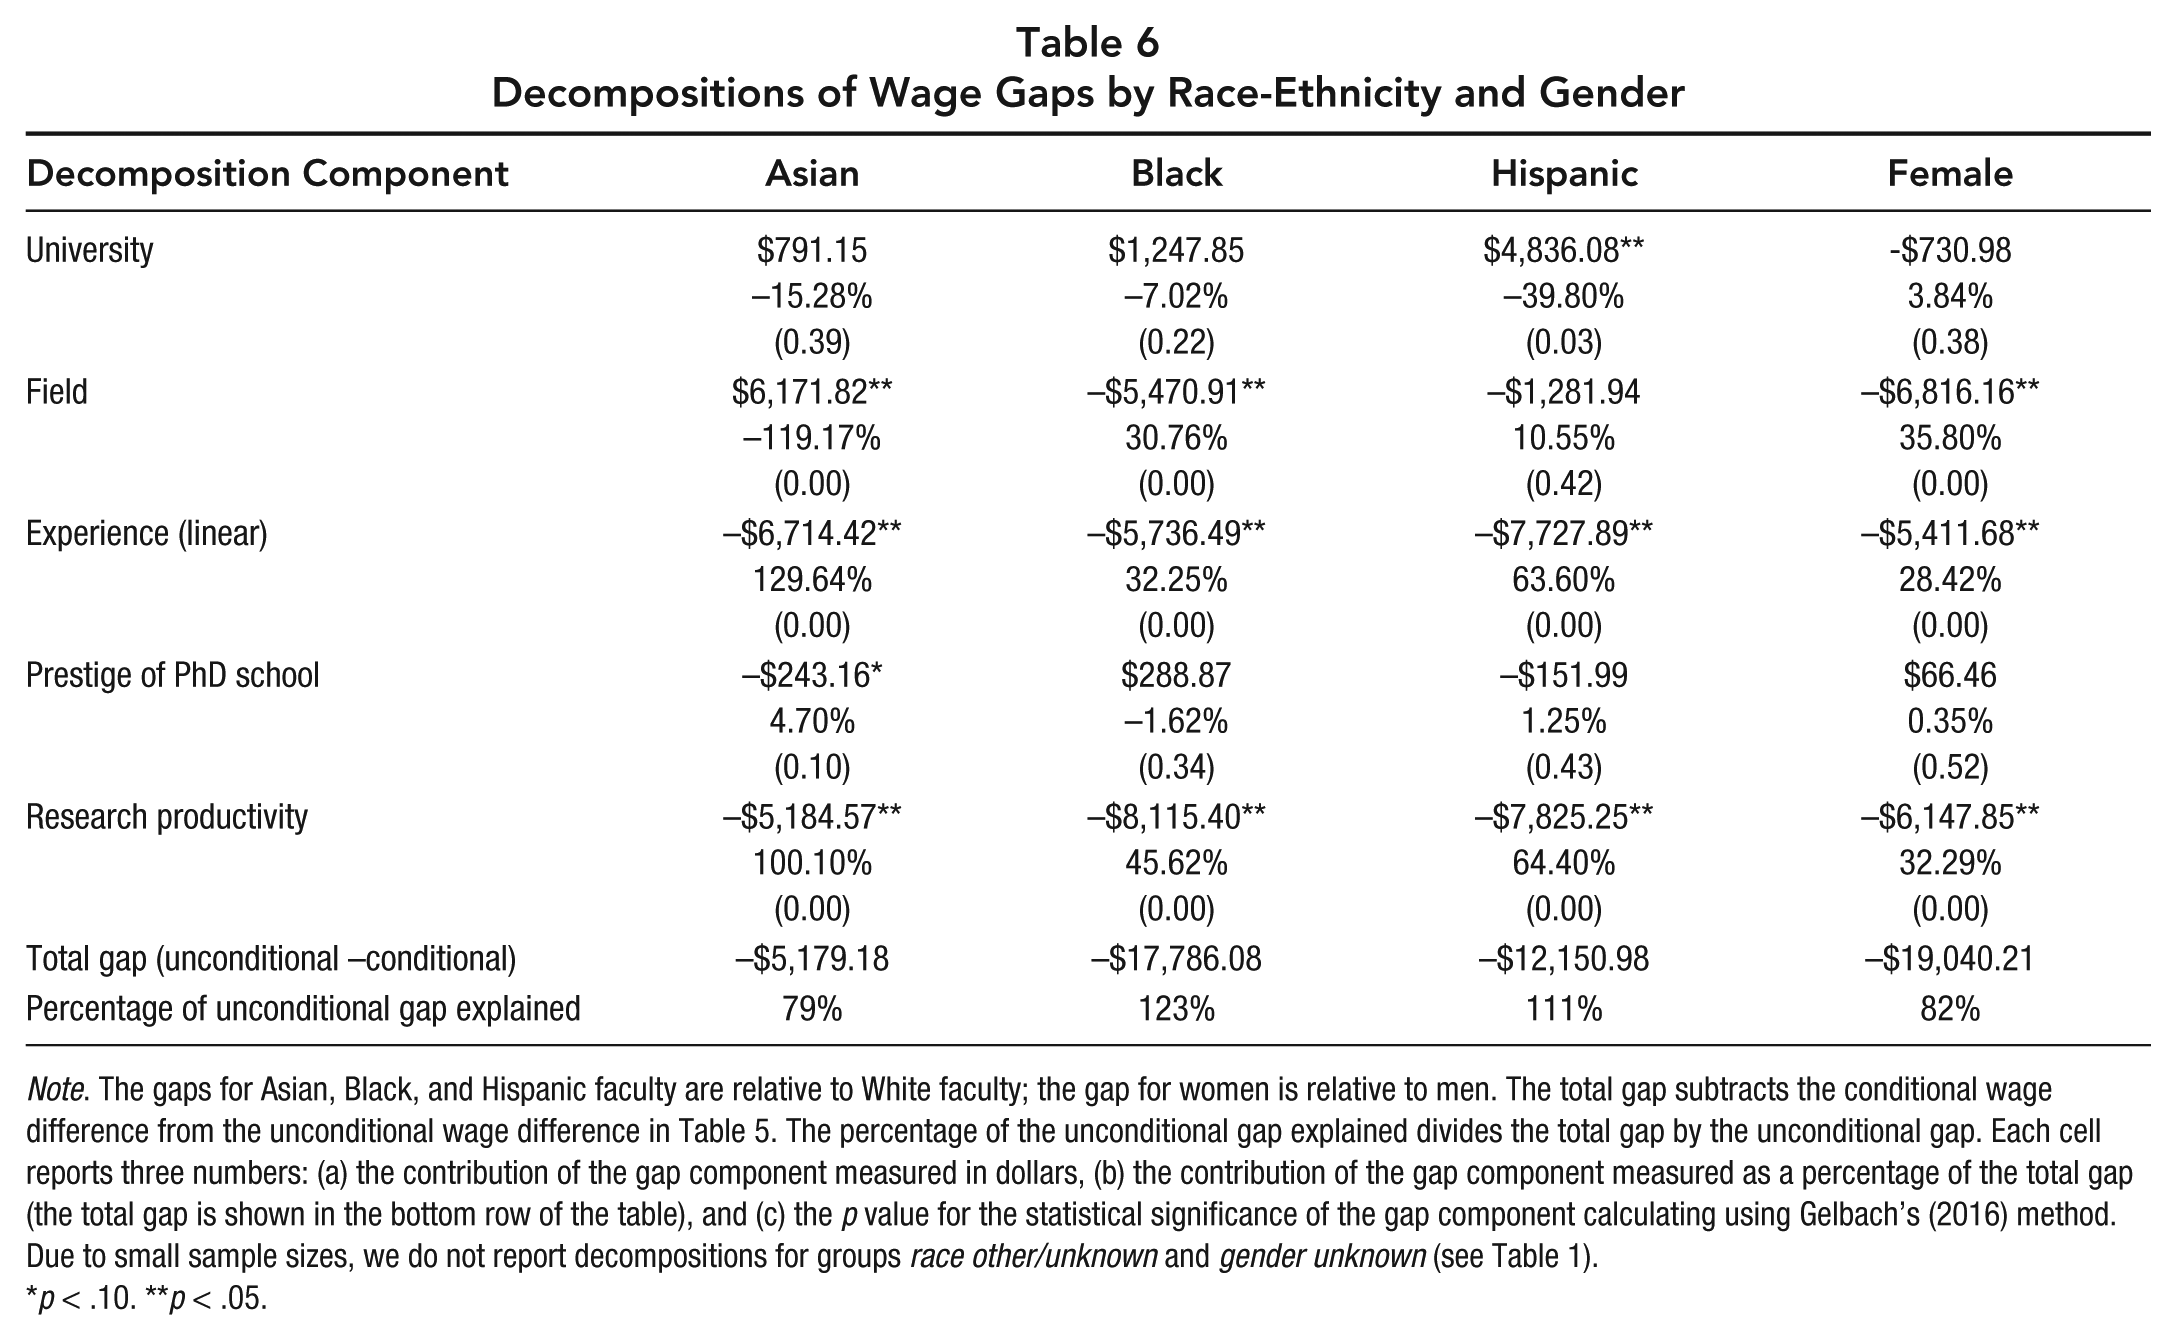
Note. The gaps for Asian, Black, and Hispanic faculty are relative to White faculty; the gap for women is relative to men. The total gap subtracts the conditional wage difference from the unconditional wage difference in Table 5. The percentage of the unconditional gap explained divides the total gap by the unconditional gap. Each cell reports three numbers: (a) the contribution of the gap component measured in dollars, (b) the contribution of the gap component measured as a percentage of the total gap (the total gap is shown in the bottom row of the table), and (c) the p value for the statistical significance of the gap component calculating using Gelbach’s (2016) method. Due to small sample sizes, we do not report decompositions for groups race other/unknown and gender unknown (see Table 1).
p < .10. **p < .05.
The decompositions identify three factors that primarily explain observed wage gaps by race-ethnicity and gender: (a) academic field, (b) experience, and (c) research productivity. Although there is some variability in the importance of these factors across the gaps we consider, all three are generally important. 21 To elaborate briefly, field differences account for a substantial portion of the higher wages of White relative to Black faculty, and men relative to women, but do not explain the wage gap between Hispanics and Whites. For the Asian–White gap, field differences contribute positively because Asians tend to be concentrated in higher-paying fields than other faculty, including Whites. Consistent with data from other occupations, we find significant wage returns to experience for faculty (see Appendix Table B5, available on the journal website), and Table 6 shows that a substantial share of each wage gap we consider can be explained by the fact that White and male faculty are more experienced than other groups, as illustrated by Figure 1. Figure 1 also implies a reduced role of experience in explaining wage gaps in the future. Finally, research productivity is a consistently important factor in explaining wage gaps by race-ethnicity and gender, accounting for at least 30% of the total gap in each comparison we consider.
Tables 5 and 6 show that the racial-ethnic wage gaps are fully explained by the observable components in our data. On the one hand, this result is consistent with a lack of systematic bias toward specific racial-ethnic groups in hiring and wage negotiations. On the other, it is also consistent with universities placing little value on the diversity contributions of faculty per se, at least as measured by wages, although a caveat to this interpretation is that universities may be limited in how much wage flexibility they have. 22 It also bears mentioning that our models do not account for teaching or service contributions. Previous research on whether minorities and women are burdened by more service requirements and/or invest more time in teaching is mixed. Although some studies find that these groups take on more service and invest more in teaching (Guarino & Borden, in press; Menges & Exum, 1983), others find that they do not (Olsen, Maple, & Stage, 1995; Porter, 2007).
Discussion and Conclusion
We use recent data from the 2015–2016 academic year to examine faculty representation and wage gaps at 40 selective public universities. Our study focuses on six academic departments: biology, chemistry, economics, educational leadership and policy, English, and sociology. We show that the underrepresentation of Black, Hispanic, and female professors among faculty in these departments overall is driven predominantly by a lack of diversity in STEM fields. Non-STEM fields are much more diverse. Younger cohorts of faculty are more diverse than their senior colleagues in most respects, which projects for improved faculty diversity in the future. The trend toward diversity is particularly apparent in STEM fields. However, Black faculty are an exception: Younger cohorts in STEM fields do not include more Black faculty than older cohorts at the universities we study.
Our wage decompositions identify three observed factors that explain racial-ethnic wage gaps in their entirety and most of the gender wage gap: (a) academic field, (b) experience, and (c) research productivity. These factors should be of focal consideration in policy efforts to ameliorate racial-ethnic and gender wage differences among faculty. We do not find any evidence of wage premiums associated with diversity per se, although for Black faculty we cannot rule out a modest premium.
We conclude by briefly addressing the policy implication of our finding that diversity is particularly lacking in STEM fields. If a rationale for policies to improve faculty diversity is to provide role models for underrepresented students, and if it is presumed that students will gravitate toward such role models, the current diversity imbalance in higher education implies that students from underrepresented groups may be nudged toward lower-paying, non-STEM fields. 23 This would serve to perpetuate an already-existing imbalance in the workforce, both in academia and in the broader labor market (e.g., also see Bayard, Hellerstein, Neumark, & Troske, 1999; Carnevale, Fasules, Porter, & Landis-Santos, 2016). If an aim of diversifying the faculty is to promote better long-term outcomes for underrepresented students, targeted efforts to increase diversity in STEM fields may need to be an explicit objective. However, STEM-specific considerations do not seem to be prominent in current policy discussions on faculty diversity. 24
We thank Gabriel Gassmann and Ryan Grantham for research assistance and Eric Parsons for feedback on earlier versions of this work. All errors are our own.
Footnotes
Appendix A
Notes
Author Biographies
DIYI LI is a PhD candidate in the Economics Department at the University of Missouri–Columbia, 118 Professional Building, Columbia, MO 65211;
CORY KOEDEL, PhD, is an associate professor of economics and public policy at the University of Missouri–Columbia, 118 Professional Building, Columbia, MO 65211;
References
Supplementary Material
Please find the following supplemental material available below.
For Open Access articles published under a Creative Commons License, all supplemental material carries the same license as the article it is associated with.
For non-Open Access articles published, all supplemental material carries a non-exclusive license, and permission requests for re-use of supplemental material or any part of supplemental material shall be sent directly to the copyright owner as specified in the copyright notice associated with the article.
