
Abstract
To make the abstract idea of “college readiness” legible for public purposes, readiness indicators have tended to treat students identically: If a student meets a simple benchmark, he or she is ready for any college. This shorthand ignores that indicators of readiness may differ according to students’ backgrounds and where they choose to enroll in college. We use nationally representative data to show that readiness measures that are sensitive to students’ race/ethnicity and the selectivity and level of colleges in which they enroll reveal important nuance in readiness predictions. We find different readiness benchmarks indicate readiness for different groups of students when high school performance measures are used to predict different college outcomes, complicating the interpretation and use of conventional readiness measures.
Keywords
With the adoption of the Common Core State Standards (CCSS), “college and career readiness” has become the mantra of school officials nationwide. As states implement these ambitious readiness standards, there is renewed focus on the proportion of enrolled college students who require developmental courses—a common indicator of college readiness. This focus highlights not only the importance of developing good measures for identifying which high school graduates are “college ready” but also how little we know about how to measure readiness across the full spectrum of colleges and college students.
Measures of college readiness suffer from at least two challenges. First, most focus on the average student, which does little to extend our understanding of college readiness for historically underrepresented racial minority students (Strayhorn, 2014). Given the challenges of access to educational opportunity for students from various backgrounds, this assumption may lead to a misunderstanding of the needs of these students and may unfairly burden them with inappropriate or unhelpful labels like “not ready for college.”
Similarly, most measures of college readiness treat all colleges the same, ignoring differential levels of rigor, course placement practices, or supports for struggling students (Porter & Polikoff, 2011). This assumption seems simplistic given the variety of American higher education institutions. In actuality, any indicator of readiness may suggest a different level of readiness when considered in the context of a specific college type or mission. Research is needed that tests both the power of traditional performance variables to explain college readiness and the predictive ability of such measures for racial/ethnic minorities (REMs) in different collegiate environments.
A second, more intractable, complication is the tradeoff between a measure’s practical usability and its accordance with common-sense understandings of college readiness. For example, popular benchmarks like those established by the College Board and ACT are easy to calculate but only capture the likelihood a student earns “good grades” in specific college courses and so may not align with an intuitive understanding of college readiness. In contrast, college readiness measures like those of Conley (e.g., 2007, 2014) capture a more complete picture of the characteristics that indicate college readiness, but the number and complexity of the elements in Conley’s tool make it unwieldy for tracking national readiness trends.
In this article, we illustrate the complexity of incorporating students’ backgrounds and choices while acknowledging the tradeoffs between usability and intuitiveness associated with measuring college readiness. We use standard measures of high school performance to estimate indicators of college readiness and account for race/ethnicity and selectivity of college enrollment to improve precision in discussing this critical issue. Our goal is to illustrate the need for college readiness measures that are sensitive to students’ varied backgrounds and college preferences. Two research questions guide our work:
Do different levels of high school performance measures predict different likelihoods of college readiness for students of different race/ethnicity and who enroll at institutions of varying selectivity?
Based on race/ethnicity- and selectivity-sensitive measures of college readiness, what percentage of the U.S. population of postsecondary enrollees is ready for college?
Conventional Measures of College Readiness
Even without considering students’ diverse cultural backgrounds or institutional preferences, determining college readiness using measures of high school performance is difficult. This is in large part because college readiness is hard to define. Fundamentally, readiness means that students are prepared to succeed in college, but defining “success” is difficult. Scholars and policymakers have come up with multiple definitions to create a variety of college readiness benchmarks. These definitions focus on a few main outcomes—whether students enroll in college-level coursework, first-year grades, college degree completion, and college admissions criteria—and rarely account for students’ race/ethnicity or college choices (Porter & Polikoff, 2011).
College Readiness as Defined by Taking College-Level Coursework
Although the term college readiness is open to interpretation, the adoption of CCSS established a policy-specific meaning: “readiness to take college-level classes.” Nearly every state that adopted CCSS has defined “college ready” as “not in need of developmental coursework.” This definition is agnostic about whether the coursework occurs at 2- or 4-year colleges as long as the credits taken can accrue toward a postsecondary degree. Indeed, to the extent there is concern that students accumulate debt paying for non-credit-bearing courses, or a desire for students to ultimately earn a 4-year degree either directly or via transfer, it does not matter where a student takes developmental coursework.
This ability to complete college-level coursework is how Conley defines success in his popular readiness framework (e.g., 2014). Conley’s multidimensional framework emphasizes the importance of skills and competencies including specific content knowledge, learning skills, cognitive strategies, and knowledge of the college transition process. Given its depth, Conley’s approach comes close to describing all the characteristics a college-ready student should have. However, the portfolio of evidence—from test scores to course artifacts—needed to evaluate Conley’s framework is cumbersome (Conley, 2012, 2014).
Several scholars have indirectly addressed college readiness by examining factors that predict the need for developmental coursework. High school GPA and course-taking tend to be the strongest predictors of developmental need (Porter & Polikoff, 2011). For example, whether a student has taken Algebra 2 is a good predictor of whether a student is ready for college-level math (Long, Conger, & Iatarola, 2012). High school GPA and course units can, collectively, place students more accurately into developmental courses than traditional methods and reduce remediation rates for REM students without using race in the assignment process (Scott-Clayton, Crosta, & Belfield, 2014).
Regardless of the factors associated with developmental education, the use of developmental education to indicate college readiness has many problems. Among them are that underrepresented racial minority students are disproportionately placed into developmental courses (Attewell, Lavin, Domina, & Levey, 2006; Castro, 2013); there is a history of claims of racial-bias in placement exams (Hughes & Scott-Clayton, 2011); different cut scores determine developmental placement at different colleges (Bettinger & Long, 2009; Hodara, Jaggars, & Karp, 2012); and there is a high rate of error in developmental placement (Scott-Clayton et al., 2014).
College Readiness as Indicated by First-Year Grades
Despite the policy focus on college-level coursework, many widely known benchmarks of college readiness are based on first-year college grades. Both the College Board and ACT established readiness benchmarks pegged to specific scores on their respective tests. These are perhaps the most publicly visible college readiness metrics and appear regularly in news stories. Simple headlines like “ACT Scores Show Many Grads Not Ready for College-Level Work” (Kerr, 2016) obscure the extent to which the scope of the claims exceeds the measure’s capacity.
First, despite their claims to the contrary, both the ACT and College Board set somewhat arbitrary thresholds. For example, the ACT benchmark represents the score over which students have a 50% chance of earning a B or higher or a 75% chance of earning a C or higher in one of several first-year courses (Allen, 2013). Similarly, the College Board’s benchmark indicates a student has at least a 65% chance of earning a B– in one of a set of first-year college courses (Wyatt, Korbin, Wiley, Camara, & Proestler, 2011). The lack of consistency between these measures, and their divergence from other regulatory definitions of college readiness, typifies the challenges of defining college readiness.
Second, the ACT and College Board benchmarks are based on a large population of students from a relatively small number of institutions. Out of over 4,000 postsecondary institutions in the country, the College Board benchmark is based on data from 110 four-year institutions that predominately require SAT scores for admission (Wyatt et al., 2011). The ACT has a broader sample, including up to 68 community colleges and 75 four-year colleges (Allen, 2013), but the sample is dominated by public institutions and institutions that are located where the ACT is the predominant college-entrance exam. Despite these limitations, the ACT and College Board benchmarks have obtained scholarly currency in that they have been utilized as the outcomes of still other college-readiness benchmarks. Alongside high school GPA, Gaertner and McClarty (2015) used them as the outcome when predicting college readiness based on middle-school characteristics.
College Readiness as Indicated by Bachelor’s Degree Attainment
Another conventional indicator of students’ readiness for college is degree completion. Using degree attainment as a readiness indicator has the benefit of being relatively, if tautologically, intuitive: If a student finishes college, then he or she was ready for college. However, not only are colleges able to select the students they expect to graduate, but the time to finish a degree is long enough that there may be many reasons a student does not complete college other than not having been college ready. Nevertheless, some scholars use college completion to indicate college readiness. Adelman (1999, 2006) found a strong relationship between high school course-taking patterns and college completion. Although test scores and high school GPA also predict college completion, neither on its own is as effective at predicting completion as high school course-taking, but a composite measure of the three was better at predicting college completion than socioeconomic status (Adelman, 1999).
College Readiness as Indicated by Admissions Criteria at 4-Year Colleges
Scholars have also operationalized college readiness using requirements for college admission. In this research, a student is college ready if she has met some minimum criteria for admission to a 4-year college. This approach was pioneered by Berkner and Chavez (1997), who considered a student minimally qualified for college if he or she fell in the top 75% of his or her cohort on measures commonly used to evaluate college applications, such as high school GPA, class rank, or standardized test scores. Students move up in the assessment if they took high school courses amounting to 4 years of English; 3 years each of social science, natural science, and math; and 2 years of a foreign language. Like other measures, this college readiness benchmark has carried sufficient weight that scholars have used it as a measure in other work (e.g., Cabrera & La Nasa, 2001; Klasik, 2012).
Greene and Winters (2005) argue that this approach does not hew closely enough to the reality of 4-year admissions and disagree that reasonable performance on any one of Berkner and Chavez’s criteria qualifies a student for college, even minimally. They propose an alternative approach in which students must graduate high school with a regular diploma, take a slightly less rigorous courseload than prescribed by Berkner and Chavez, and meet the “basic” level of performance on the National Assessment of Educational Progress (NAEP) reading assessment.
Approaches that equate college readiness and 4-year college admissions standards have two main shortcomings. First, if colleges only admitted college-ready students, there would be no need for CCSS to focus on readiness to take college-level coursework. Second, the focus on 4-year college admission overlooks the large population of students who attend community colleges, which often have less selective admissions policies.
The Accuracy-Legibility Tradeoff
The challenges of finding a practical and realistic measure of college readiness are common to many measurement schemes. The problem lies in the need to find a metric that makes the complex idea of college readiness “legible” for policy purposes. As Scott (1998) explains, producing legible information involves the “rationalizing and standardizing [of] what was a social hieroglyph into a legible and administratively more convenient format” (p. 3). Education is replete with attempts to make performance legible to policymakers—eliminating the idiosyncrasies of individual school context for the sake of producing general trends and helpful rules of thumb (Labaree, 2011; Weiss & Gruber, 1987). Attempts to measure college readiness face a tradeoff between, on the one hand, conceptual clarity and accuracy and, on the other, legibility and portability (Scott, 1998). At one end of this spectrum are measures of college readiness like Conley’s (2011) in which students are expected to demonstrate a variety of key skills, behaviors, and strategies. This metric faithfully reflects what many believe it means to be college ready, but it is difficult to measure at a large scale because of the number and detail of the measures. At the other end are measures like those from College Board and ACT, which measure readiness in terms of a threshold score on their exams. This style of measuring readiness is easy to evaluate but is removed from the conceptual underpinnings of college readiness.
One main criticism of simplification that makes complex phenomena administratively legible is that it can overlook local, practical knowledge of the issue. A high school teacher could give what would likely be an accurate assessment of his or her students’ college readiness, especially given that teachers are better than simple statistical models at predicting college enrollment (Soland, 2013). However, it is not practical for policy makers, or even colleges, to rely on these individualized assessments. Yet the accuracy-legibility tradeoff does not have to be an either/or proposition: We do not have to set aside all knowledge of important differences between students or colleges.
To wit, few of the measures of college readiness described above consider students’ race/ethnicity, despite the ease of doing so, or reasons to believe assessments may function differently by race/ethnicity (Hood, 1998; Mattern, Patterson, Shaw, Korbin, & Barbuti, 2008; Strayhorn, 2014). Assessments that are not culturally sensitive may not function as intended when predicting the outcomes of REM students (e.g. Hood, 1998). Indeed, one study that did adjust for race found that the rigor of a student’s high school curriculum was more predictive of baccalaureate completion for Black and Hispanic students than for White students (Adelman, 1999). Similarly, Scott-Clayton et al. (2014) note that the use of different developmental placement assessments would differentially place students by race. Although there is little evidence of strong cultural bias in most educational assessments (Reynolds & Suzuki, 2013), the College Board acknowledges the differential predictive validity of the SAT, which overpredicts the college GPA of underrepresented minority students by as much as 0.32 standard deviations (Mattern et al., 2008). This overprediction of college grades for Black students has been true since at least the 1960s (Stanley & Porter, 1967).
The existence of these race-based differences may indicate the influence of systematic factors related to performance, such as differential access to high-quality teachers or cultural biases in the assessments, but cannot tell us about the forces at play on any single individual. As a result, the recognition of these differences in group performance is useful for diagnosing the college readiness of large populations but is less useful for setting college readiness benchmarks that are used to place individual students into developmental courses.
Existing college readiness benchmarks also treat students’ college choices as irrelevant to the likelihood of readiness. However, there is no theoretically or empirically grounded reason to assume that the test score that predicts college readiness at a selective 4-year college would be the same as predicts readiness at a community college (Porter & Polikoff, 2011). Differences in academic rigor might suggest that more stringent readiness thresholds are needed for students attending more selective institutions. However, the higher graduation rates at more selective schools suggest they all but guarantee the academic success of the students they select—they have more resources to support students that may need additional academic help (Hoxby, 2009). Complicating issues of where students enroll is that race/ethnicity and college choice are correlated—White and Asian students are more likely to enroll in more selective colleges, while Black and Hispanic students tend to enroll in less selective colleges (e.g., Baker, Klasik, & Reardon, 2018; Reardon, Baker, & Klasik, 2012), which underscores the need to consider race and enrollment choice together.
Data
We primarily use the Education Longitudinal Study of 2002 (ELS), a nationally representative, longitudinal dataset of 10th graders in 2002 and 12th graders in 2004. The data include students’ race/ethnicity and where students enrolled in college, if at all. It also contains potential college readiness indicators including whether students took developmental coursework or completed a college degree. Finally, the data contain information from students’ high school records including SAT/ACT scores, academic GPA, and number of units in different subject areas and Advanced Placement or International Baccalaureate coursework. We use the ELS survey weights that adjust for sampling and survey nonresponse.
We merge these data with college selectivity information from the Barron’s Admissions Competitiveness Index. Barron’s rates the selectivity of 4-year colleges on a scale from 1 to 6 (from most to least selective) based on the high school GPAs, class ranks, and SAT/ACT scores of enrolled students, as well as on admission rates. We exclude specialty schools with nonstandard admissions criteria. We combine the two most and least selective categories of colleges because of the relatively small number of enrollments by various populations in the sample. We thus analyze four levels of selectivity of 4-year colleges and add a fifth category to indicate enrollment at a 2-year college.
We limit our analysis to the 8,920 ELS students we observe enrolled in a 2- or 4-year college between 2004 and 2006. Table 1 provides descriptive statistics for this sample. The average SAT score (or ACT score converted to the SAT scale) was 1010, and the average high school GPA was 2.8. Fifty-seven percent completed a degree, and 60% reported not taking a developmental course. Table 2 gives descriptive statistics for the students by race/ethnicity and by the selectivity and level of the college where they first enrolled. White students and students at most/highly competitive institutions had the highest degree-attainment rate—62% and 86%, respectively. These groups also had the highest rate of not taking developmental courses—63% and 70%, respectively. In contrast, Black students and 2-year college enrollees had the lowest degree-attainment rates (41% and 40%, respectively), and Hispanic students and students at 2-year colleges had the lowest rates of not taking developmental courses (48% and 51%, respectively).
Descriptive Statistics of the Sample
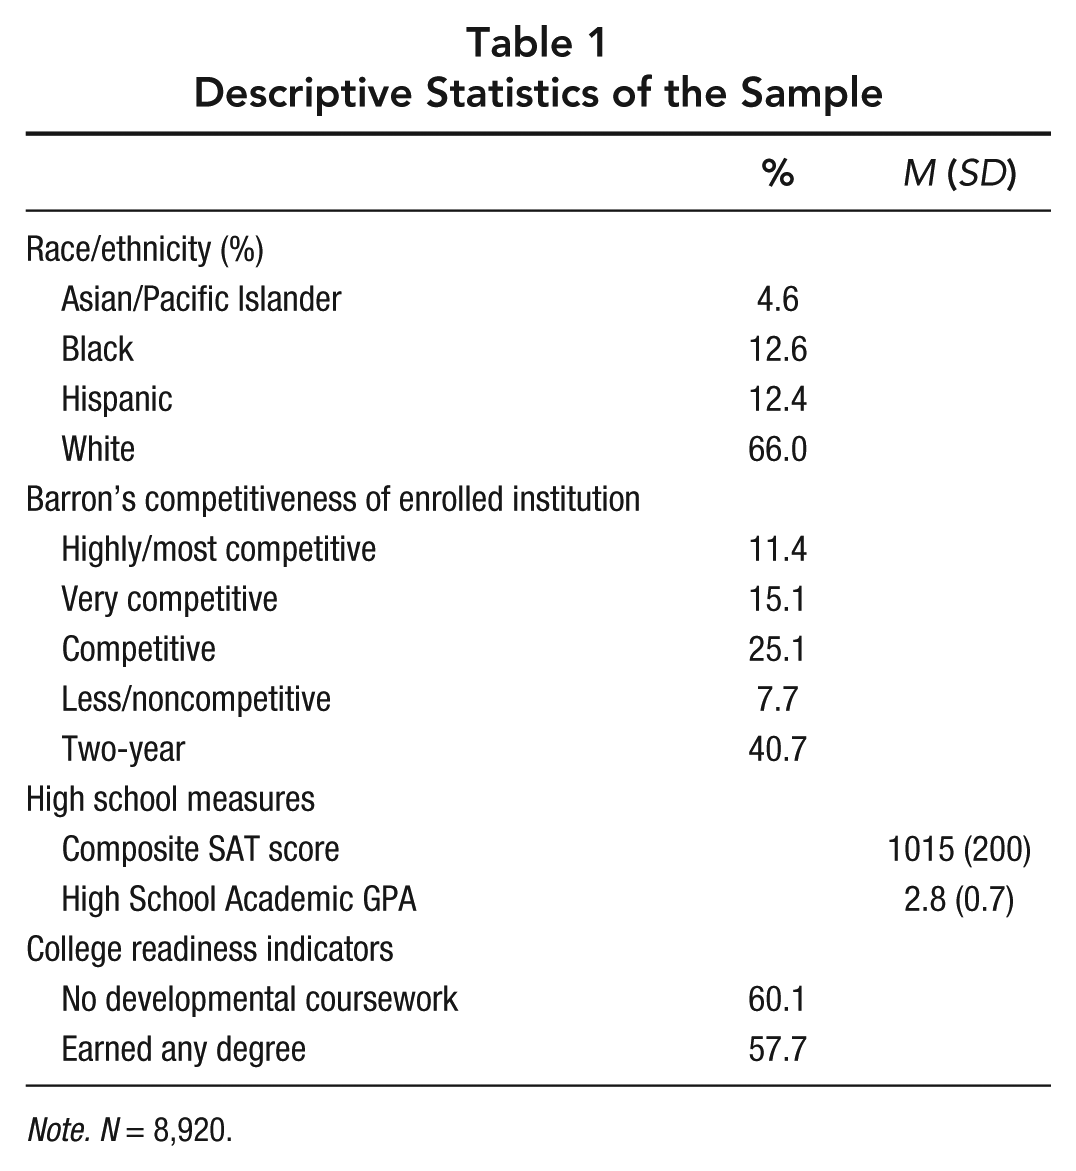
Note. N = 8,920.
Selected High School and College Measures by Race and Selectivity/Level of First Enrolled School
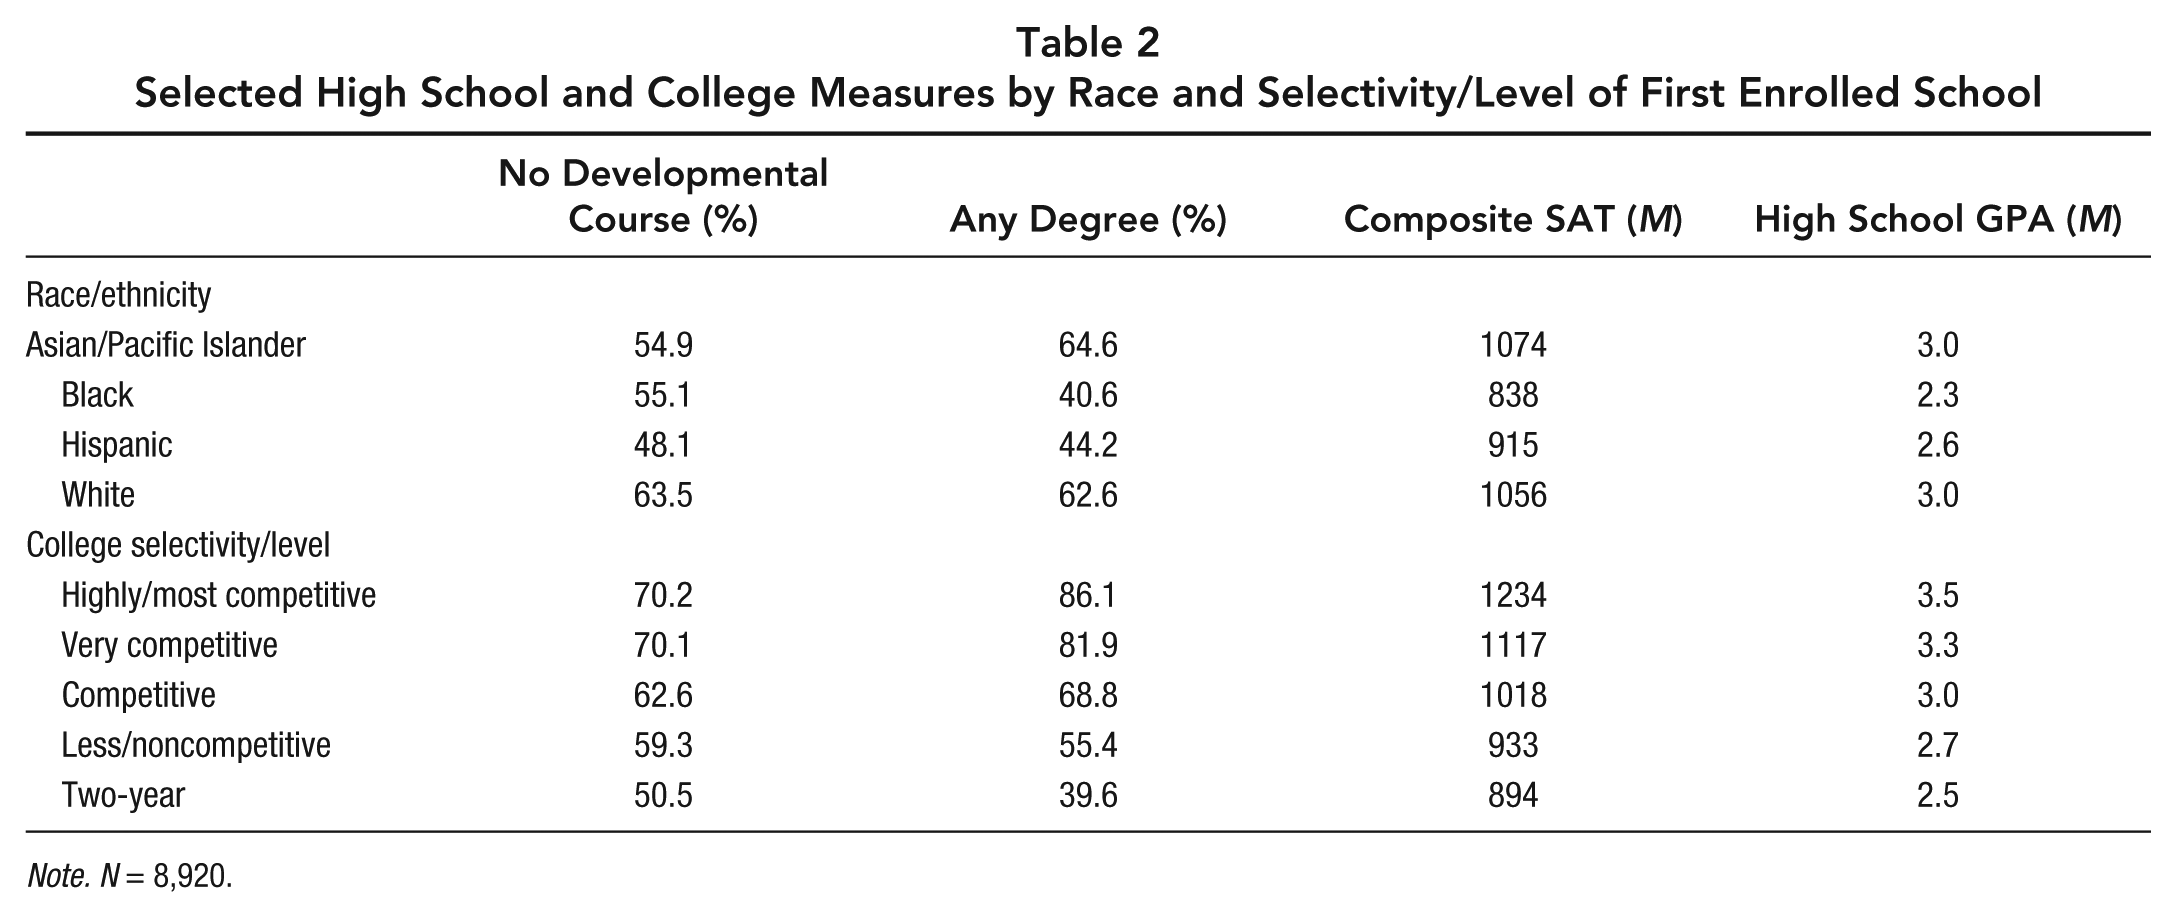
Note. N = 8,920.
Limitations
Although the nationally representative ELS sample is close to ideal, it has some limitations. First, it only supports the evaluation of college readiness for the population of students that enrolls in college. If a student does not enroll in college, we cannot assess readiness outcomes or account for the selectivity of college enrollment. Such limitations are typical in the college readiness literature (e.g., Allen, 2013; Wyatt et al., 2011).
Additionally, students self-report taking developmental coursework. They may underreport these courses because there may be stigma attached to taking these courses (despite survey confidentiality) or they may not realize they have taken developmental coursework. Widespread underreporting will lead us to overestimate the population of students who are college ready.
Finally, we are limited to analyzing students who enroll within 2 years of high school graduation. Individuals may develop college readiness later in life, but the usefulness of ELS data to study this population is limited.
Method
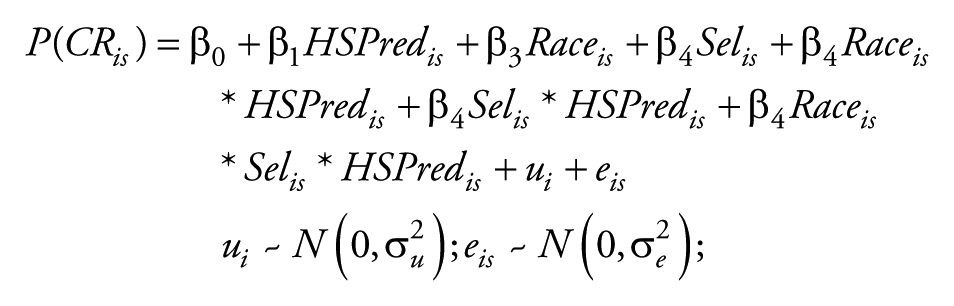
We determine college readiness benchmarks based on methods used by the College Board and ACT (Allen, 2013; Wyatt et al., 2011). Generally, we use a logistic regression to estimate the odds that a student meets a readiness indicator based on different high school indicators. Because students who attend the same colleges face identical environments for demonstrating their readiness, we use a random-effects model to account for the nonindependence of observations within the same college. Our basic model takes the form
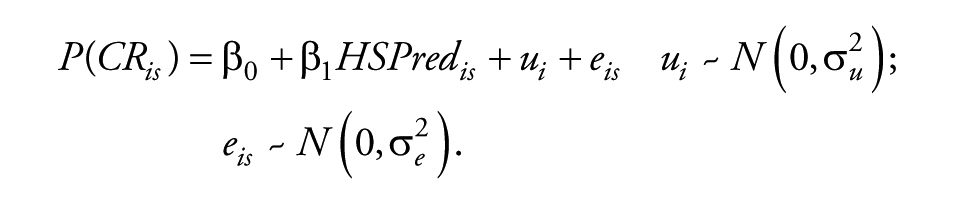
That is, the probability that student s attending institution i demonstrated college readiness (CRis) is predicted by a high school performance measure (HSPred), plus an institution-specific random coefficient (
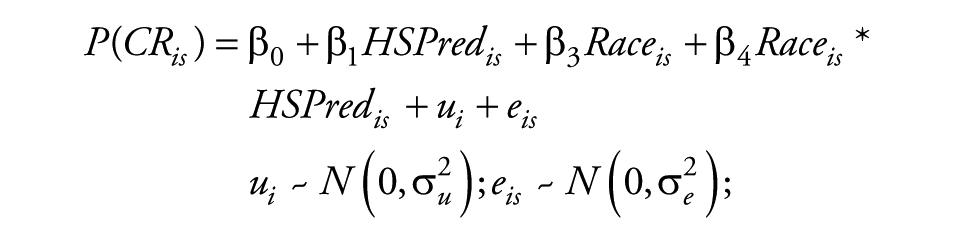
We extend this basic model by examining college readiness under three additional scenarios. First, we add terms that allow for the predictive ability of HSPred to vary according to a student’s race/ethnicity and an interaction between those indicators and HSPred:
Analogously, we allow the predictive ability of HSPred to vary according to the selectivity of the college in which a student enrolls (
In keeping with the College Board/ACT approach, we set readiness benchmarks at the scores at which students have either a 65% or 50% chance of meeting the given readiness standard. Using these benchmarks, we then calculate how many students in the sample would be considered college ready by whether they exceed the various benchmarks.
Results
We assess our readiness predictions primarily by looking at the plot of the probability a student meets the given college readiness outcome over the full range of the high school predictor variable. Good readiness measures can clearly discriminate college-ready from unready students. Because they were the only ones to reasonably meet this standard, we limit the remainder of our discussion to the prediction of developmental coursework by SAT score and the prediction of degree completion by academic GPA. Appendix A describes the characteristics we looked for to make this determination and gives examples of relationships that we omit from our discussion. Note that although we refer to “SAT scores,” the data include both SAT scores and ACT scores converted to the SAT scale.
Table 3 gives the GPA and SAT benchmarks for each race/ethnicity and selectivity group, both individually and in combination, where the predicted probability of the readiness outcome exceeds either 50% or 65%. The graphic depiction of the outcome probability predictions over the full range of GPA and SAT score are given in Appendix B, Figures B1–B12.
Estimated Benchmarks by Race and Barron’s Competitiveness

Note. Significant differences are relative to the top row, as described in Appendix C. PI = Pacific Islander.
0 indicates all score/GPA values are above the likelihood threshold.
p < .1. *p < .05.
Race- and College-Selectivity-Only Predictions
The top rows of Table 3 give readiness benchmarks that account for race and college selectivity individually. In the race-only predictions, a relatively wide range of scores benchmark college readiness. Across all race groups, there is a 125-point (0.6 standard deviation) difference between the lowest and highest score that predict readiness at the 65% threshold. The same range is about 0.7 standard deviations at the 50% likelihood level. A slightly smaller range of GPAs—amounting to between 0.3 and 0.4 standard deviations—predict readiness.
The range of SAT scores that predict readiness when accounting just for college selectivity is roughly similar to the race-only predictions (roughly 150 points, or 0.7 standard deviations). The GPA range, however, is much larger—over 2 standard deviations at the 65% threshold. Perhaps unexpectedly, the threshold that predicts likelihood of degree completion is lowest at the most selective colleges and highest at 2-year colleges. These differences may be in part selection—selective colleges attract and select students likely to graduate—and in part resources—selective colleges have more resources to support students toward the completion of their degree (Hoxby, 2009).
Predictions Sensitive to Race and College Selectivity
The benchmarks are more varied when considering race and college choice together. There is the least amount of variation in benchmarks for White students for the developmental coursework outcome, perhaps because this burden falls more heavily on students from other race groups. Indeed, the predictions of White students not needing developmental coursework at the most selective colleges appear to be outliers due to the small number of students at this level who report such coursework.
Predicted benchmarks for not taking developmental coursework are more varied for REM students conditional on their college choices. In general, Asian/Pacific Islander students enrolled in very competitive or competitive colleges are predicted not to need developmental coursework with significantly higher test scores than the average student. Black students face a significantly higher benchmark at most/highly competitive colleges but need significantly lower test scores to indicate readiness at other 4-year colleges. The scores that predict developmental course-taking are quite different within REM groups, depending on the level of selectivity of college enrollment. For example, scores ranging from 710 to 1180, a greater than 2 standard deviation spread, predict not taking developmental coursework for Black students at the 65% level.
When race/ethnicity and college destination are taken into account in benchmarks that use GPA to predict degree completion, the thresholds similarly vary widely and in ways that deviate from thresholds that do not make such an accounting. Significantly higher GPAs are required to indicate readiness than under naïve estimates for students from REM groups enrolled in 2-year colleges. Further, both Black and White students appear college ready with significantly lower GPAs at most/highly competitive colleges than naïve estimates would indicate.
Simulated Rates of College Readiness
Given the different benchmarks that indicate college readiness from Table 3, we can compare college-readiness rates under naïve conditions (all students held to the same benchmark) and standards that are sensitive to race/ethnicity and college choice. Table 4 gives these rates. With no race/ethnicity or enrollment selectivity adjustments, we see that 28.4% of students have a 65% chance of not needing to take a developmental course according to their SAT score. Calculated using thresholds sensitive to race/ethnicity and the enrollment selectivity, this prediction rises to 32.3%. In terms of the probability of degree completion predicted by GPA, naïve estimates have the 65% readiness rate at 39.0%. Allowing the benchmark to vary by race and enrollment selectivity lowers this rate to 37.7%.
Estimated Percent of College-Ready Students, Accounting for Race and College Selectivity/Level

Note. Predicted college readiness of sample students who enrolled in a degree-granting institution and have a valid GPA or SAT score. Significant differences in readiness prediction relative to “…Nothing” condition, as described in Appendix C.
p < 0.01.
For each outcome-predictor pair, the readiness rates follow the same pattern, but higher, at the 50% threshold. Predicted readiness goes up when accounting for race/ethnicity and selectivity with SAT scores as the predictor but goes down when we use GPA.
Discussion
Based on the belief that simple, legible measures of college readiness need not be devoid of nuance, we engaged in the straightforward exercise of calculating college readiness rates that are sensitive to students’ race/ethnicity and selectivity of college enrollment. The results reveal what most college readiness measures occlude: There is substantial variation in the predictions of college readiness for students from different backgrounds attending different colleges.
The implications of these results depend on the intended use of readiness assessments. For example, policymakers might use these results to obtain a more accurate assessment of national college readiness rates or assess individual school performance for accountability purposes. Attending to the race/ethnicity and college destinations of students represents a way to improve the accuracy of aggregate readiness rates.
Further, postsecondary institutions can use these results to help calibrate their own developmental placement practices. Our findings should prod institutions to acknowledge that placement metrics do not function equivalently for all students and to be more sensitive to a student’s race/ethnicity and other background characteristics when assigning students to developmental courses. This recognition could prompt responses ranging from the use of educated discretion in the developmental placement of students with academic performance close to naïve college readiness benchmarks to the rigorous study of the scores that are predictive of readiness for REM students at a specific institution.
The implications of this article are on less firm ground when it comes to prescriptions for individual students. Group averages can establish rough expectations for how a set of students might perform in college, but few individuals are “average.” Using these results to diagnose the readiness of individual students is thus unlikely to illuminate and may do harm if it falsely diagnoses college nonreadiness. However, extending earlier recommendations by Maruyama (2012), estimations such as ours could be used to improve college counseling, by providing an assessment of a student’s “college potential” in the form of predicted likelihood of readiness for different college destinations, by race/ethnicity. In other words, rather than receiving a firm ready/nonready pronouncement, students could be told that given their test scores or GPA, similar students had a certain probability of earning a degree if they enrolled in a very competitive college, but a different probability if they enrolled in a competitive college.
Such assessments are already implicit in calculations of readiness presented both here and elsewhere—we have dichotomized an otherwise continuous probability of readiness by saying a student is college ready if that student has a minimum probability of meeting a readiness outcome. Such simplifications throw out potentially valuable information about levels of readiness that dichotomous measures ignore. They also lead to the awkward disagreement between expected and actual college success: We estimate 50% of college-going students had a 50% chance of earning a degree, which leads to the demonstrably false expectation that only 25% will earn one—in reality, 57% of these students graduated with a college degree. Such contradictions would not occur if we were to measure a continuous idea of college potential rather than the dichotomous notion of college readiness.
Thus, this article raises questions about how we measure and conceive of college readiness. Our results demonstrate racial differences in the predictive ability of college entrance exams—the fact that estimated readiness rates based on SAT/ACT scores are higher when we account for race and college destinations than when we simply use average performance reveals systematic underassessment of college readiness among REM populations with respect to developmental coursework. However, estimated readiness rates appear higher when measured by GPA with race/ethnicity- and enrollment-selectivity-sensitive methods rather than naïve methods. This increase indicates that although high school teachers have the flexibility to be culturally responsive in their grading in a way that entrance exams do not, there appears to be grade inflation that varies by race/ethnicity that overestimates the college readiness of students. In other words, while SAT and ACT scores tend to be pessimistic about the likely college readiness of REMs, high school GPAs appear to paint too rosy a picture. The accuracy of college readiness measurement improves when accounting for race/ethnicity and college destinations but would not be necessary if the underlying assessments did not demonstrate such cultural biases. Another way to improve the measurement of readiness might be to find a practical way to assess nonacademic college readiness traits like those proposed by Conley (2012, 2014), although there may be potential problems with the measurement of noncognitive abilities in high-stakes contexts like college admissions (Niessen, Meijer, & Tendeiro, 2017).
Ultimately, the measurement of college readiness is far more complex than the latest headline proclaiming the academic decline of American teenagers. Measures of readiness are sensitive not just to which outcome is measured but also who is measured and where he or she enrolls in college. Gaps in the prediction of readiness between estimates that ignore important group differences and those that are sensitive to them should give scholars and policymakers reason to think deeply about oversimplifying the national assessment of college readiness. However, as we have demonstrated, it is not challenging to add important contextual detail even to measures used on a national scale. Developing assessments of college readiness that are meaningful and easy to use but also take into account details of a student’s individual context is an endeavor worth pursuing as the consequences of college readiness for students, high schools, and colleges become more acute.