




Abstract
Congressional lobbying by education-related interest groups is an understudied subject in education research. This brief uses congressional lobbying expenditure data from 1998 to 2017 to examine trends in lobbying behavior by labor unions; K–12 education providers; and public, private nonprofit, and for-profit higher education institutions. Education interest groups have spent in excess of $2 billion lobbying Congress since 1998. Higher education institutions represent a disproportionate share of lobbying activity and expenditures, accounting for almost 70% of education-focused interest groups and around 80% of education-related lobbying expenditures. Lobbying expenditures steadily rose until 2011 before rapidly declining. The brief speculates as to the possible reasons for these trends and concludes with a call for greater research on lobbying for education.
Lobbying plays an important role in American democracy. Due to restrictions governing campaign contributions, 1 many public and nonprofit organizations rely on lobbying as a means of political action. Lobbying, therefore, represents a major political expenditure for many interest groups. 2 Lobbying expenditures dramatically exceed political action committee (PAC) and campaign contributions (de Figueiredo & Richter, 2014; Milyo et al., 2000). Interest groups and super PACs 3 spent $37.4 million in campaign expenditures during the 2018 election cycle. Lobbyists spent $6.84 billion.
Education interest group expenditures account for only 3.9% of total lobbying expenditures across all industries. Yet the $2 billion spent over the past two decades by education interest groups represents a massive investment in lobbying. Furthermore, the expanding role of the federal government in education policymaking—as evidenced by No Child Left Behind (NCLB) and the Every Student Succeeds Act (ESSA)—foretells an increase in education-related lobbying activity (Leech et al., 2005). Few researchers have examined congressional lobbying behavior and expenditures within the education sector (Cook, 1998; de Figueiredo & Silverman, 2006; Ferrin, 2003, 2005; Hannah, 1996; Parsons, 1997; Smith, 1993, 1995). In this brief, we examine the trends in the number of interest groups lobbying Congress and the amount of money spent lobbying over the past two decades. We find higher education institutions account for a disproportionate share of both lobbying expenditures and the number of educational interest groups. We also find total education lobbying expenditures increased before starting to decline in 2011. We posit possible reasons for these trends at the end of this brief.
Data Sources and Collection
Our data come from the Center for Responsive Politics (CRP), a nonprofit organization 4 that maintains data on lobbying, campaign expenditures, and other political activity at the federal level. Federal law requires lobbyists to give a quarterly good-faith estimate of expenditures on their federal lobbying activity. 5 CRP collects estimates for each interest group and classifies groups by industry. CRP data is reported reliably and frequently cited in other disciplines. 6
We focus on the CRP-denoted members of the education industry. The resulting panel dataset consists of every education interest group that disclosed lobbying expenditures in a given year from 1998 to 2017. We define an interest group as any organization or individual that spent money lobbying Congress at a level that required reporting expenditures. We also draw on data from the Comparative Agendas Project (CAP), a comprehensive multinational research program that collects data on legislative voting patterns, to examine congressional votes on education-related issues. 7
Trends in Education Interest Group Lobbying
Table 1 shows the 25 education sector organizations that spent the most lobbying Congress; 8 22 of the top 25 spenders represent higher education institutions. Only two labor unions—the National Education Association (NEA) and the American Federation of Teachers (NFT)—make the top 25. In all, labor unions 9 spent around $90 million since 1998. For-profit universities spent double that amount; 77 individual for-profit higher education institutions together spent over $183 million lobbying Congress since 1998. This group represents around only 1% of the nearly 7,300 for-profit higher education institutions 10 that existed during the past 20 years. Of a possible 3,270 nonprofit institutions, 531 spent a total of $607 million; 255 public institutions and 21 public university systems representing 308 public institutions spent an additional spent $676 million. Just under 2,600 public institutions existed for at least one year of the time period. The fact that for-profit institutions have a different and less diverse set of priorities than other postsecondary institutions may account for this trend (Cook, 1998; Kelderman, 2017; Kreighbaum, 2018). The fact that a small proportion of the total number of institutions within the for-profit sector chose to lobby may also account for this difference. Still, the higher education sector as a whole 11 spent more than four times the rest of the education industry combined, and 10 times the expenditures of education-related labor unions and the K–12 sector.
Top 25 Education Interest Groups by Lobbying Expenditures, 1998–2017
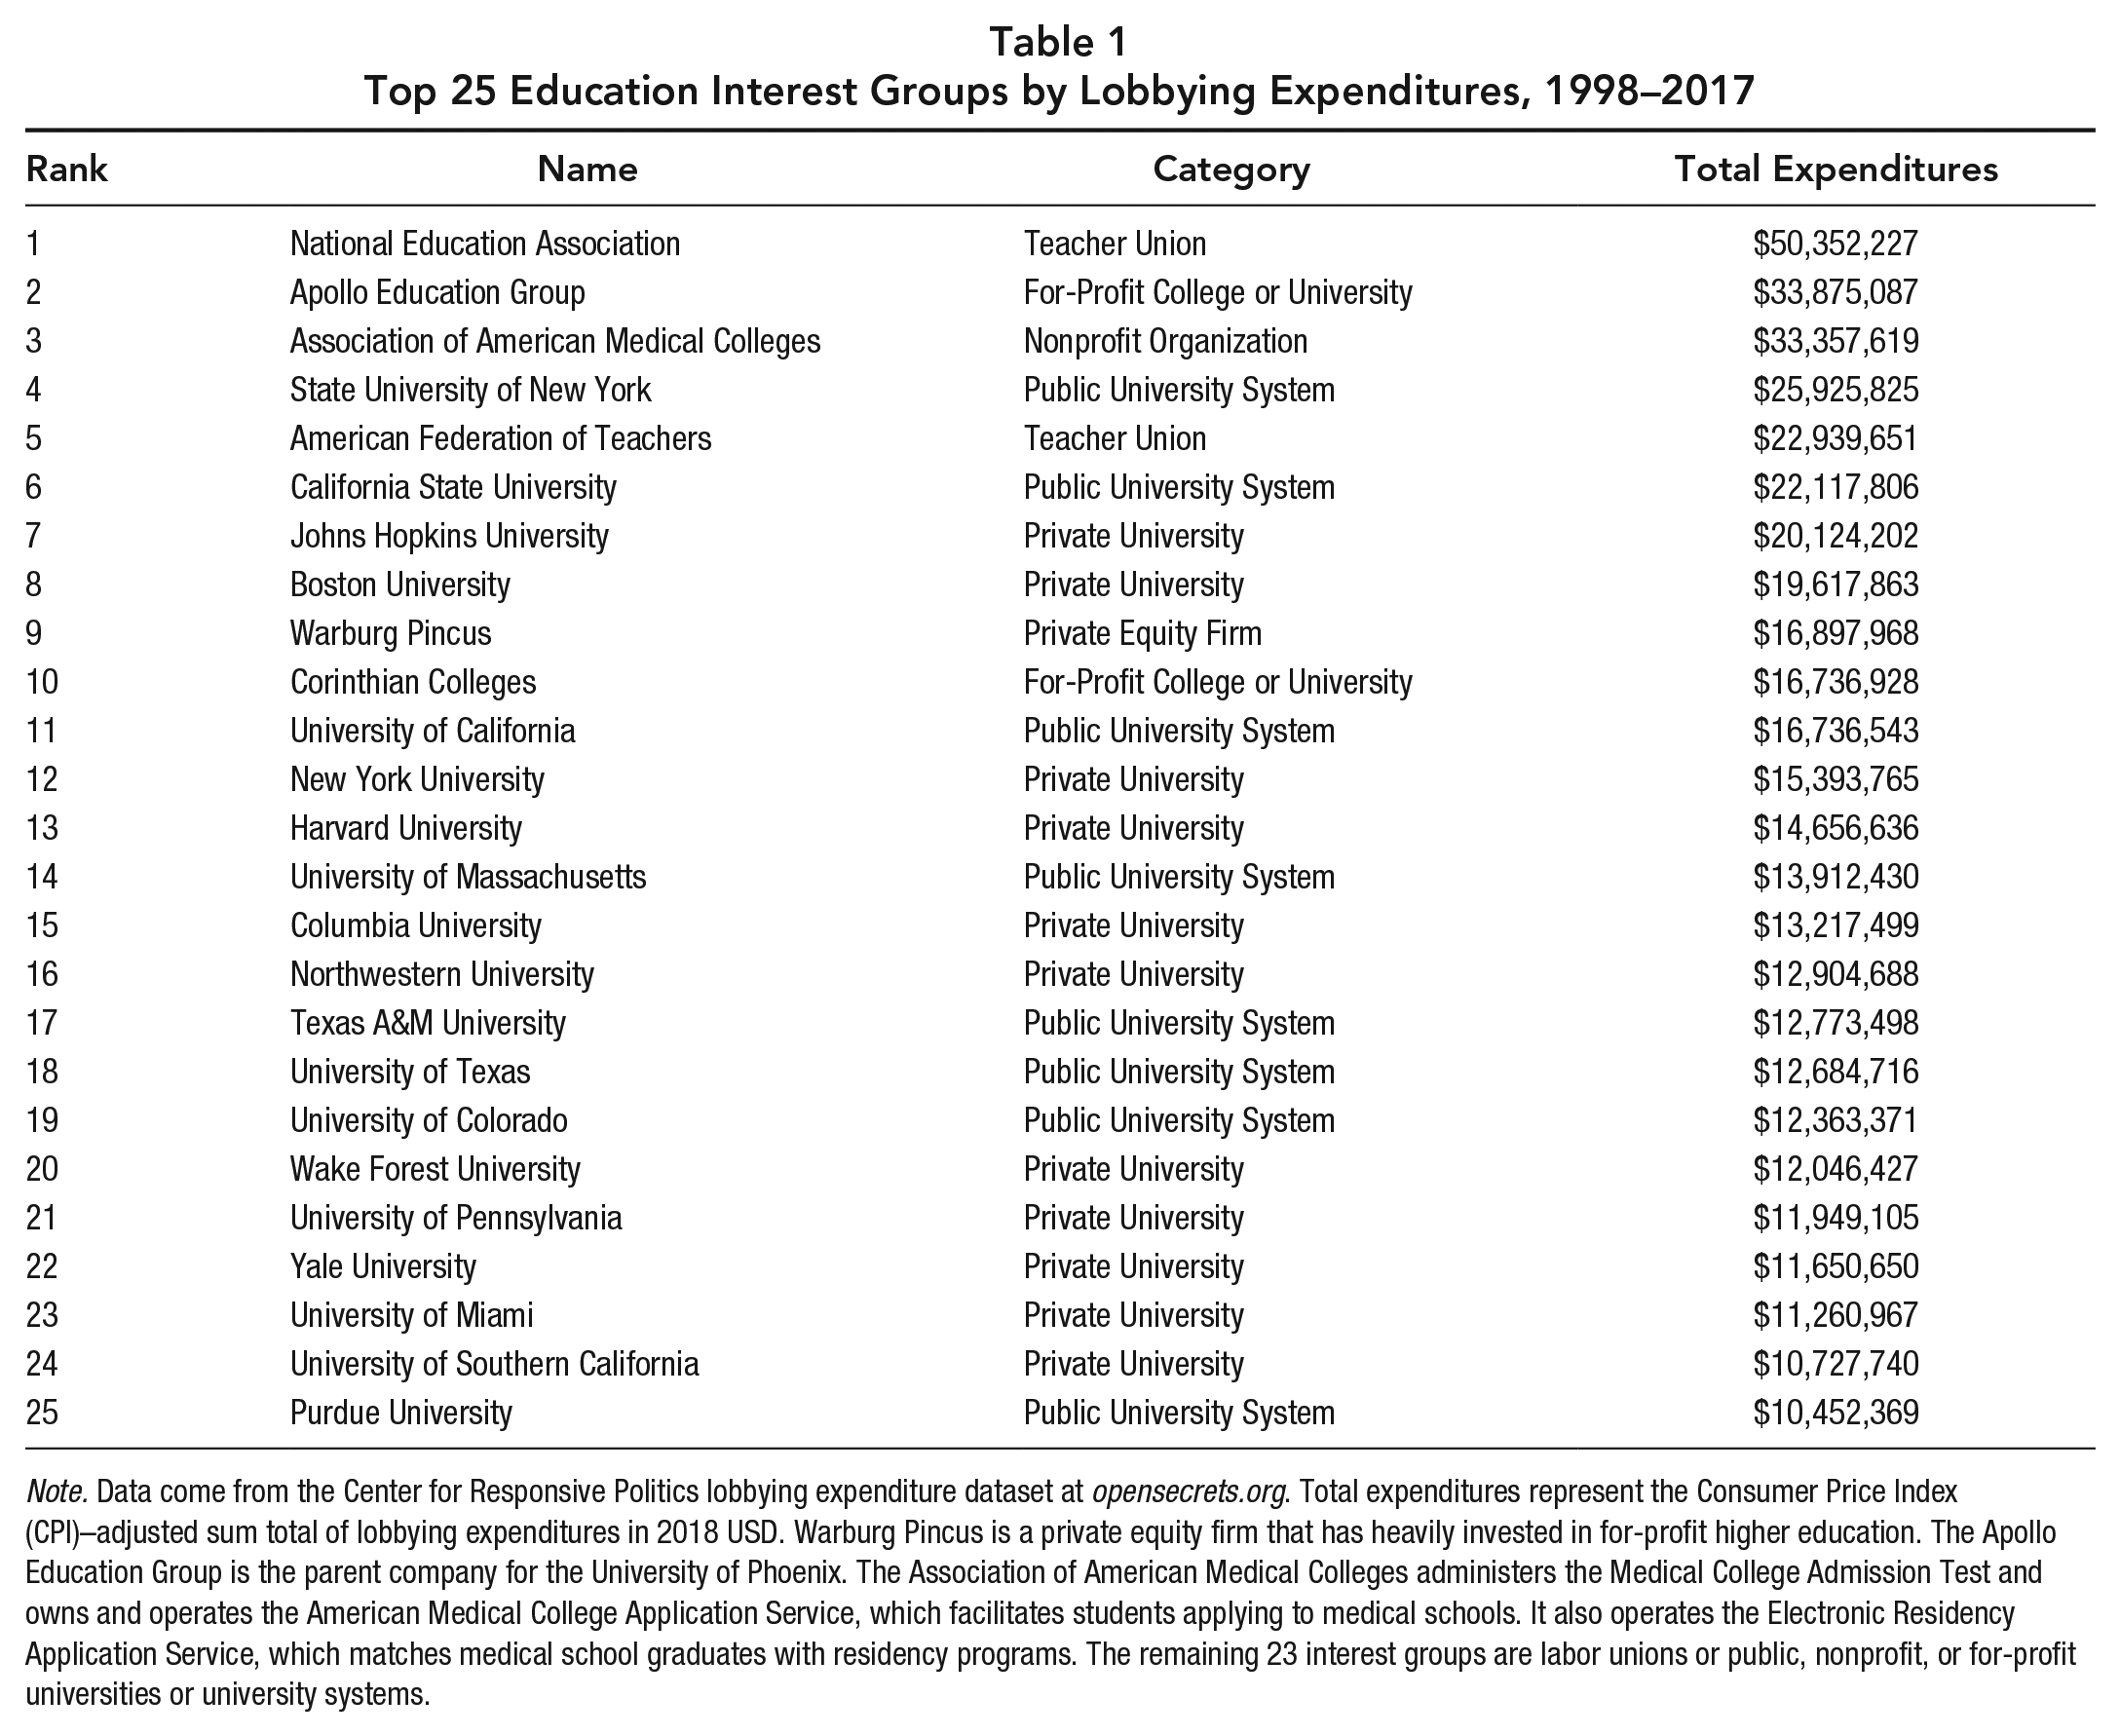
Note. Data come from the Center for Responsive Politics lobbying expenditure dataset at opensecrets.org . Total expenditures represent the Consumer Price Index (CPI)–adjusted sum total of lobbying expenditures in 2018 USD. Warburg Pincus is a private equity firm that has heavily invested in for-profit higher education. The Apollo Education Group is the parent company for the University of Phoenix. The Association of American Medical Colleges administers the Medical College Admission Test and owns and operates the American Medical College Application Service, which facilitates students applying to medical schools. It also operates the Electronic Residency Application Service, which matches medical school graduates with residency programs. The remaining 23 interest groups are labor unions or public, nonprofit, or for-profit universities or university systems.
Higher education interest groups comprised a large proportion of education lobbying expenditures throughout our panel. Figure 1 shows trends in number of interest groups that lobbied on the left and the trends in amount spent by interest group type on the right. 12 In every year since 1998, higher education interest groups have accounted for at least 70% of the education interest groups that lobbied Congress. In only two years, 2007 and 2011, did higher education interest groups account for less than 80% of total education interest group lobbying expenditures.

Trends in education interest group lobbying, 1998–2017.
The number of interest groups lobbying Congress and total education industry expenditures rose before starting to decline in 2011. In 1998, 355 education interest groups spent $52 million lobbying. By 2011, lobbying expenditures and the number of interest groups lobbying had risen over two and a half times to almost $141 million and 981 interest groups. By 2017, however, the number of interest groups and amount they spent had declined precipitously across all interest group types. In all, higher education interest groups reduced their spending by around 33% after 2011. K–12 interest groups cut their lobbying expenditures in half.
Possible Explanations for Trends
One explanation for the consistent gap between K–12 and higher education expenditures is that congressional action may be more salient to higher education institutions. Table 2 shows the number of higher education and K–12 focused roll-call votes 13 during the time period, along with roll-call votes concerning research and design (R&D) funding for various areas of research that might apply to higher education institutions. Higher education– and R&D-related votes 14 exceeded K–12 votes in five consecutive Congresses from 2005 to 2014. However, the data do not clearly support the idea that educational lobbying is focused on specific salient legislation. Reductions in higher education roll-call votes began to happen prior to declines in lobbing expenditures. 15 If the education sector did lobby in this manner, we would expect to see more frequent, random spikes in lobbying activity as the sector activates around salient issues. Lastly, higher education interest groups greatly outspent K–12 interest groups even in years in which K–12 votes occurred more frequently.
Roll-Call Votes by Subject Matter and Congress
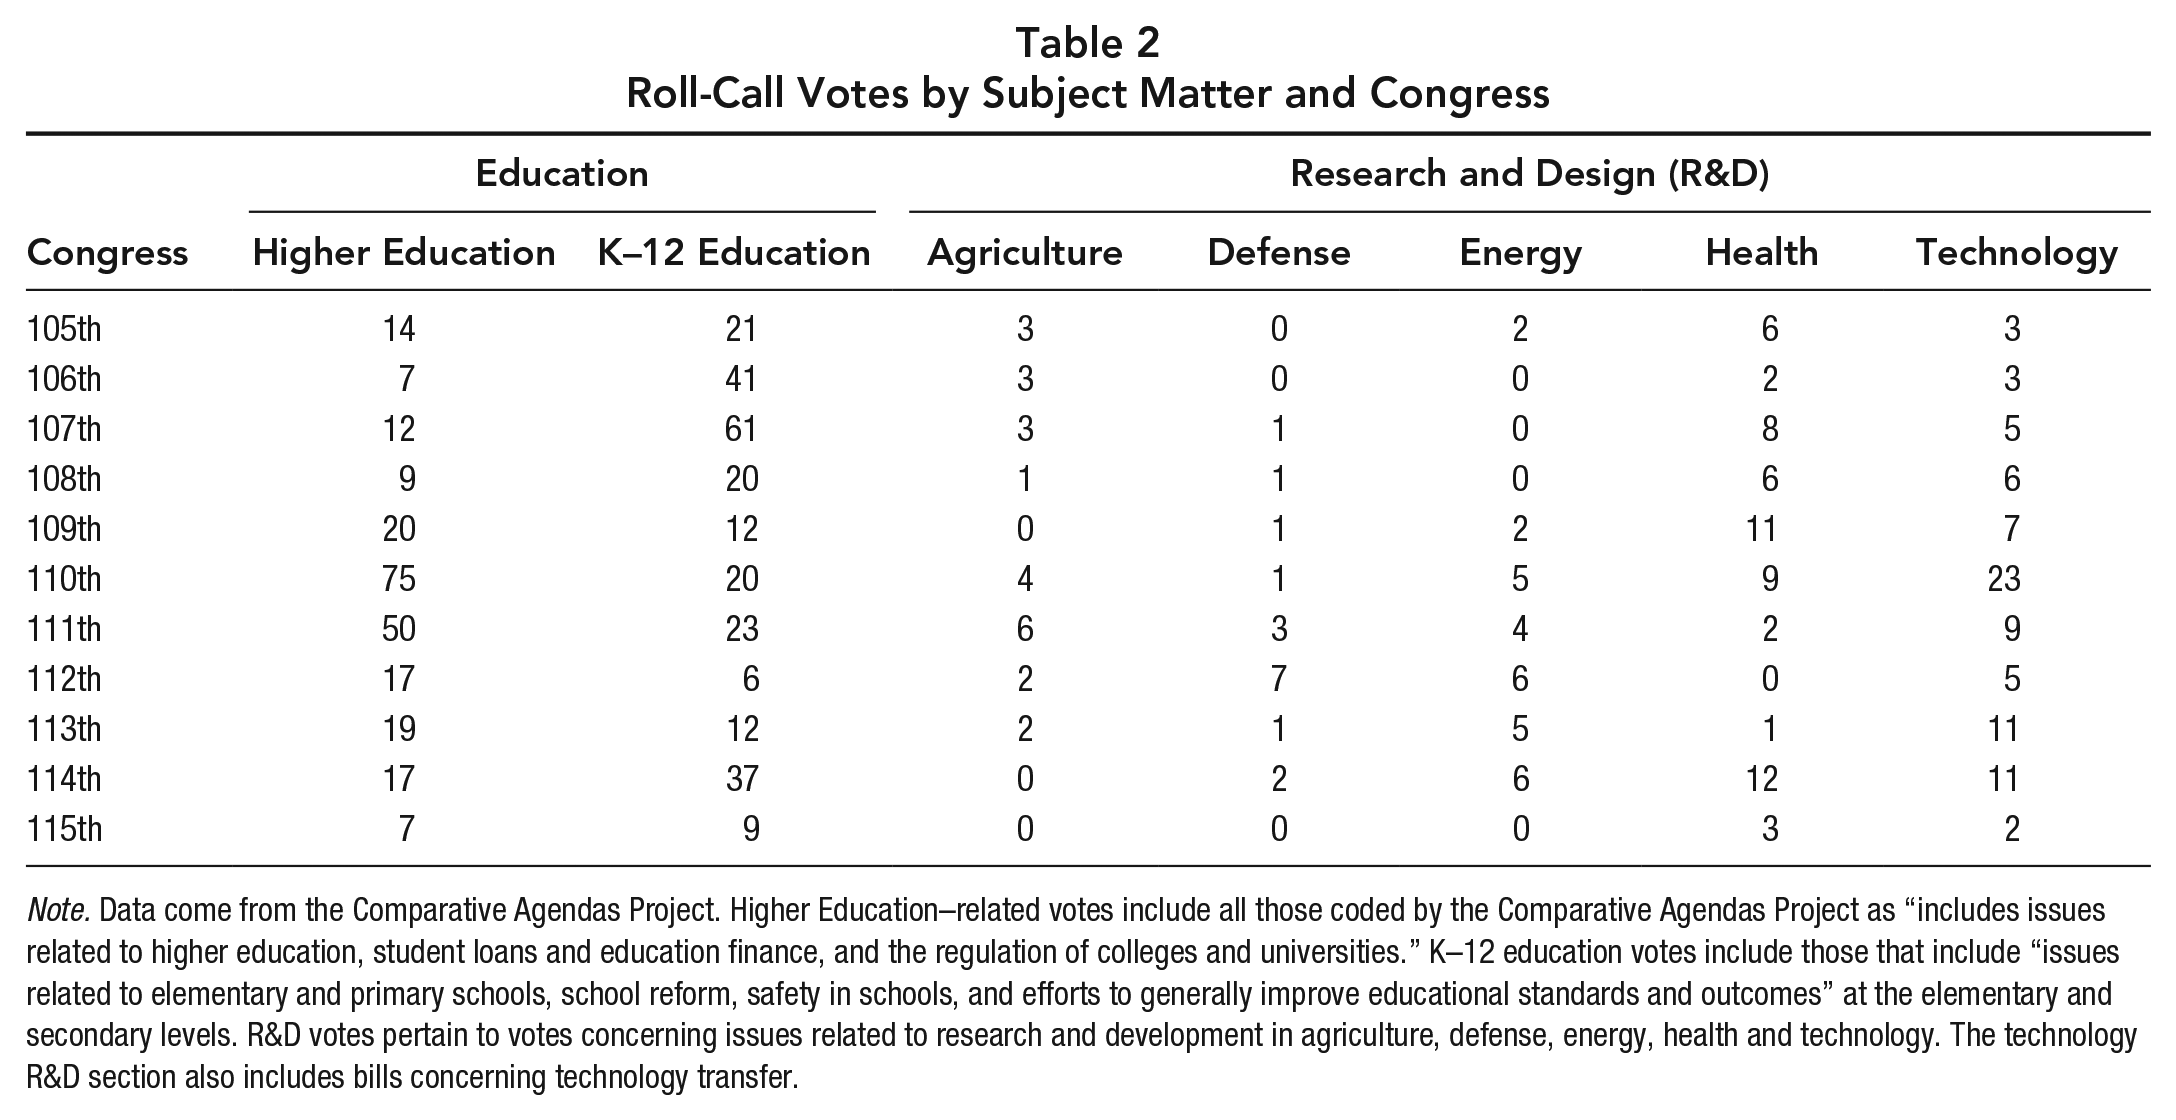
Note. Data come from the Comparative Agendas Project. Higher Education–related votes include all those coded by the Comparative Agendas Project as “includes issues related to higher education, student loans and education finance, and the regulation of colleges and universities.” K–12 education votes include those that include “issues related to elementary and primary schools, school reform, safety in schools, and efforts to generally improve educational standards and outcomes” at the elementary and secondary levels. R&D votes pertain to votes concerning issues related to research and development in agriculture, defense, energy, health and technology. The technology R&D section also includes bills concerning technology transfer.
Another reason for the difference in expenditures might be that K–12 interest groups simply receive less federal funding compared to higher education institutions. Over 90% of K–12 spending occurs at the state or local level (Common et al., 2018). However, the federal government’s 8% still represented $50 billion for the 2014–2015 school year (Common et al., 2018) compared to $80 billion spent on higher education in 2014. This 8:5 gap in spending is meaningful, but not large enough to explain the 10:1 gap in lobbying expenditures.
The decline in spending and the number of interest groups lobbying could be the result of changes in legislative trends. Figure 2 shows the number of bills passed since 1998—a measure of congressional productivity 16 —is declining. Although the 115th Congress was one of the most productive Congresses in recent years, it was still the eighth least productive Congress since World War II. It is possible that lobbyists attempting to halt legislation might have contributed to the lack of productivity and that contribution might have resulted in increased expenditures. However, if education lobbyist expenditures lead to reduced legislative productivity, we would expect to see two trends in the data. First, few education-related bills would pass or receive votes. Second, we would expect expenditures to increase alongside decreases in productivity. Whereas Figure 3 shows a low percentage of education-related bills introduced receiving roll-call votes, this represents a broader trend in Congress of few bills receiving votes. Less than a quarter of the bills introduced received roll-call votes in any Congress during the research time period. Furthermore, we see no clear relationship between expenditures and reductions in productivity.

Congressional productivity in decline, 105th–115th Congresses.

Bills introduced and roll-call votes: Education, 1998–2017.
Additionally, Congress ended earmarks 17 in 2011, perhaps contributing to the declines in the number of interest groups lobbying and their expenditures. Previous research has argued the exclusive goal of most universities lobbyists is to earn earmarks (de Figueiredo & Silverman, 2006). Without the possibility of receiving earmarks, education interest groups may have allocated their advocacy budget elsewhere.
Limitations and Conclusions
While CRP data make this analysis possible, they also carry a major limitation. CRP data rely on congressional lobbying expenditure reports, which likely underreport the actual total of lobbying expenditures within the sector due to the nature of the lobbying disclosure regulations. 18 Still, these data provide the best available estimate of federal lobbying expenditures within the education industry.
Another limitation of this analysis is the lack of attention to within-sector subcategory differences. Entire manuscripts could be written on the expenditure differences within the for-profit and nonprofit/public subcategories of the higher education sector. We hope that researchers will answer the call to examine such differences in future research.
Although popular media sources give much attention to for-profit higher education organizations and K–12-focused labor unions, they ignore public and nonprofit postsecondary institutions that spend significantly more money lobbying (Ackley, 2018; Kelderman, 2017; Kriegbaum, 2018). As such, the goals of congressional education interest group lobbyists and the tactics they use are largely understudied (Ferrin, 2003, 2005). Although researchers have examined the political influence of labor unions (Moe, 2011), few have examined whether universities have the same influence over education policy. The literature requires updating, especially considering recent changes in congressional productivity and the dissolution of earmarks.
Supplemental Material
MarsicanoandBrooks_ONLINEAppendix – Supplemental material for Professor Smith Goes to Washington: Educational Interest Group Lobbying, 1998–2017
Supplemental material, MarsicanoandBrooks_ONLINEAppendix for Professor Smith Goes to Washington: Educational Interest Group Lobbying, 1998–2017 by Christopher R. Marsicano and Christopher Brooks in Educational Researcher
Footnotes

Notes
Authors
References
Supplementary Material
Please find the following supplemental material available below.
For Open Access articles published under a Creative Commons License, all supplemental material carries the same license as the article it is associated with.
For non-Open Access articles published, all supplemental material carries a non-exclusive license, and permission requests for re-use of supplemental material or any part of supplemental material shall be sent directly to the copyright owner as specified in the copyright notice associated with the article.
