
Abstract
Using panel data from three successive collective bargaining (CBA) negotiation cycles from 277 California school districts in a difference-in-differences framework, I investigate the relationship between changes in CBA restrictiveness and racial and economic achievement gaps over time. I find that achievement gaps in California are smaller where contracts increase in restrictiveness in class size and larger where contracts increase in restrictiveness in teacher evaluation and leave policies over time, though this is not the case for all student subgroups. These effects are primarily concentrated in math, are small in magnitude, and are sometimes delayed in their timing. Altogether, this study provides some evidence that contract changes are associated with the educational opportunities of school districts’ diverse and economically disadvantaged students.
Keywords
Since the publication of the Coleman report (1966), discussions of achievement gaps have become ubiquitous in American public discourse on education (Valant & Newark, 2016). A determination to close achievement gaps served as the impetus for major federal policy efforts like the No Child Left Behind Act of 2001, and the corresponding accountability and standards-based testing movement. State lawmakers have formed task forces to investigate the causes of racial- and income-based achievement gaps, and these efforts have yielded a variety of policies and programs to address educational inequities (Shafer, 2017). Scholars have investigated the role that state and federal policy plays in mitigating or exacerbating gaps in educational opportunities (e.g., Braun et al., 2006), including the impact of state finance reforms on the provision of resources to high-poverty districts and schools (Jackson et al., 2015; LaFortune et al., 2018), and state personnel and compensation policies on the distribution of experienced and high-quality teachers to the lowest performing, most disadvantaged schools (e.g., Clotfelter et al., 2008). Researchers have also investigated the role of individual programs in mitigating gaps in achievement, including early childhood (e.g., Duncan & Sojourner, 2013) and school discipline (e.g., Gregory et al., 2010) interventions.
Although this research has made strides in understanding the sources of and potential policy responses to disparities in achievement by race and income, new research suggests ongoing and substantial variation in racial test score gaps across school districts (Reardon, Kalogrides, & Shores, 2019); yet few studies have investigated the role of district policy in producing or resolving inequities in student performance. Permitted or required in 43 states, collective bargaining agreements (CBAs) negotiated between school district administration and local teachers’ unions are the most comprehensive district policy document governing the work of teachers and administrators, command a significant portion of school district budgets, and determine much of what happens in schools and school districts (Hill, 2006). A burgeoning area of scholarship explores the effects of teacher collective bargaining policies on student achievement (e.g., Marianno & Strunk, 2018; Moe, 2009; Strunk, 2011), but this research has not yet explored the ways in which changes to CBA policies might interact with school and district contexts to produce or resolve inequities in educational outcomes.
In this study, I investigate the equity effects of CBA policies using a panel data set of CBAs from 277 of the largest school districts in the state of California over three bargaining cycles. I link this data set to panel data on the performance of California student subgroups from the Stanford Education Data Archive (SEDA; Reardon, Ho, et al., 2019). I use a series of two-way fixed effect models in a difference-in-differences framework to estimate the relationship between changes in CBA policies and changes in district English language arts (ELA) and math achievement gaps. In particular, I focus on two groups of CBA policies: (1) those that may enhance or restrict the flexibility of administrators to implement student supports and interventions and (2) those that may limit or expand some students’ access to experienced, high-quality teachers as these policies are the most likely to shape inequities in educational opportunities across contexts.
Overall, my findings reveal some evidence that changes in CBA content are associated with small increases and decreases in achievement disparities. I find that an increase to the restrictiveness of class sizes is associated with a decrease in the White–Black math gap. I find that increased restrictions in the areas of teacher evaluation are associated with larger achievement gaps (mainly in math) between California’s economically disadvantaged and noneconomically disadvantaged students and Hispanic/Latino and White students. In some cases, the effects of increasing the restrictiveness of teacher evaluation content are not immediate but appear the year after the contract changes are made. I further find that increases in the restrictiveness of the leave contract language are associated with lagged increases in the size of the White–Black and noneconomically disadvantaged–economically disadvantaged gaps (in math and ELA). Finally, I find that an increase in the restrictiveness of the nonteaching duties area is associated with a decrease in the math achievement gap between economically disadvantaged and noneconomically disadvantaged students but a lagged increase in the math and ELA achievement gap between White and Black students.
Achievement Gaps, Unions, and the Teacher Collective Bargaining Agreement
Established through negotiations between teachers’ unions and school districts, teacher CBAs govern a variety of teacher policies, including those dictating the length of the school day, class sizes, and the hiring and assignment of personnel. 1 Given their inextricable connection to and governance over the work of the most important school-based factor in student learning, several scholars have made efforts to understand the relationship between unions, collective bargaining, and student achievement. Early studies from this body of literature largely conclude that teachers’ unions and bargaining are positively associated with student learning outcomes (Argys & Rees, 1995; Eberts & Stone, 1984; Milkman, 1997). For example, Eberts and Stone (1984) use data from New York State to estimate education production functions for union and nonunion districts and find that unionized districts have test scores that are about 4% higher, which they attribute to working condition improvements from collective bargaining.
More recent studies generate measures of union strength that capture the policy content of CBAs and find negative effects of unions on achievement. Moe (2009), Strunk (2011), and Strunk and McEachin (2011) create measures of CBA “restrictiveness,” or the degree to which a given contract sets boundaries on district and school leadership in their management of teachers, and study the relationship between restrictiveness and achievement in samples of California school districts. For example, Strunk (2011) finds that a 1 standard deviation (SD) increase in CBA restrictiveness is associated with a 4.4- to 4.8-point decrease in average achievement. Strunk and McEachin (2011) find that a 1 SD increase in contract restrictiveness is associated with a 1.3% decrease in graduation rates and a 7.7% increase in the likelihood of a school district entering program improvement status under No Child Left Behind.
The aforementioned studies are all decidedly correlational. One of the threats to causal inference in work on teachers’ unions is that unions are sorted to districts based on the demand for union services. Teachers may be more likely to demand union representation in areas where teaching conditions are more difficult and, consequently, where student outcomes are lower, on average, leading to a spurious negative correlation between union activity and achievement. A growing number of studies make an effort to correct for endogeneity in unionization when estimating the relationship with student outcomes (Baron, 2018; Brunner et al., 2020; Hart & Sojourner, 2015; Hoxby, 1996; Lott & Kenny, 2013; Lovenheim, 2009; Marianno & Strunk, 2018; Matsudaira & Patterson, 2017; Roth, 2017). The most recent to leverage measures of CBA restrictiveness and average district performance over time finds that once time-invariant working conditions are taken into account, the relationship between CBA restrictiveness and student achievement is effectively zero (Marianno & Strunk, 2018). The authors conclude that there is “little to suggest that CBAs are substantively harming students” (p. 104).
How Might CBAs Affect Achievement Gaps?
Although it may be the case that union activity has no effect on average school district performance, it is entirely possible that the effects of CBAs negotiated at the district level are heterogeneous by student context—that is, that the rules and regulations ensconced in CBAs do not affect all students the same way. CBAs may, in fact, contain provisions that boost or impair the performance of lower performing, more economically disadvantaged, or diverse students relative to their higher performing, advantaged, and/or less diverse counterparts.
Figure 1 presents a conceptual framework for the types of CBA items and the mechanisms by which these items might influence gaps in student performance. First, CBAs may shape gaps in student achievement by enhancing or restricting the flexibility of administrators to implement student supports and interventions (Strunk & McEachin, 2011). In particular, CBA rules may make it more difficult for administrators to implement tiered supports that require more instructional time, more professional development, or more or less number of students in a classroom (Ballou, 2000; Eberts, 1984; Hess & Kelly, 2006; Hess & Loup, 2008; Moe, 2009). For example, CBAs contain standardized rules on the “school workday” that establish limits on the length of the workday and the amount of instructional time. These agreements further include restrictions on “nonteaching duties,” including the number and frequency of meetings and professional development sessions, and the number and amount of adjunct/extra duties. Strict “grievance” procedures may make it hard for administrators to work flexibly with contract rules when implementing reforms without fear of reprisal. “Class size” rules potentially limit how administrators are able to assign students needing extra assistance across grade levels and to specific teachers.
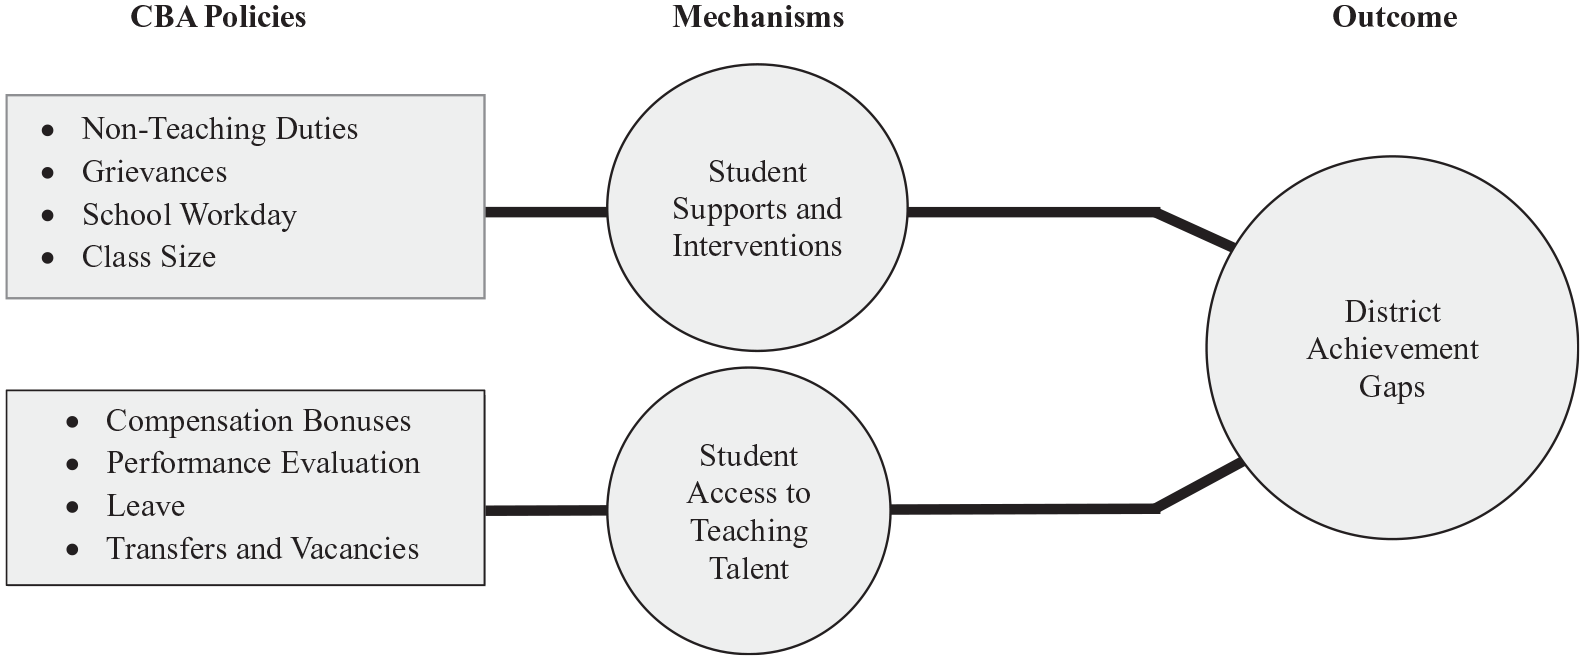
Hypothesized mechanisms for CBA items to influence district achievement gaps.
Second, some CBA items may shape the distribution of teaching talent in ways that limit or expand some students’ access to experienced, high-quality teachers. For example, contracts frequently dictate lengthy and routinized procedures for teacher “transfers” like those that determine the order in which current teachers are transferred to new assignments by length of service (seniority) in the district. If teacher mobility is strongly associated with teacher preference or the performance level and demographic composition of schools (e.g., Hanushek et al., 2004; Scafidi et al., 2007), then senior, more experienced teachers may utilize these transfer provisions to work in higher performing schools, leaving novice teachers to fill positions at schools that serve the most disadvantaged students (Anzia & Moe, 2014; Hess & West, 2006). Although not particularly common, CBA language can also be used to incentivize experienced teachers to take positions in schools that serve lower performing, economically disadvantaged students by affording “compensation bonuses” for teachers who work in these positions. Strict “performance evaluation” procedures may make it more or less difficult to identify, improve, or remove ineffective teachers, which is problematic if these teachers are concentrated in schools that serve lower performing, diverse, or disadvantaged students. Finally, “leave” policies may provide important working conditions to attract highly effective teachers to the profession, particularly to positions that are harder-to-staff. In short, if CBA policies drive the concentration of experienced, more effective teachers to teach in or to leave positions that serve more diverse or economically disadvantaged students, then achievement gaps could be affected when districts adopt specific transfer, compensation, layoff, evaluation, and leave provisions.
Data
To assess the relationship between changes to CBA provisions and changes to district gaps in student achievement, I draw on longitudinal district-level data on teachers, students, and CBAs in California. Data on district CBA policies come from a self-collected database of contracts from California school districts (available from 2008–2009 to 2014–2015). Data on teachers and students are drawn from the SEDA and the California Department of Education and National Center for Education Statistics’ publicly available data sets. I describe these data sources and measures in more detail below.
My main results are based on a sample of school districts with contract information from the three contract collection years (2008–2009, 2011–2012, and 2014–2015) with sufficient subgroup data to estimate district achievement gaps. The final analytic sample consists of 277 school districts (81% of all districts in the contract database). 2
CBA Restrictiveness Treatment Measures
I hypothesize that CBA policies most likely to restrict or enable student supports and interventions and the equitable distribution of teaching talent to students will be strongly related to district achievement gaps. I draw on a rich data set that contains the operating CBA during the 2008–2009, 2011–2012, and 2014–2015 school years for California school districts with at least four or more schools. 3 From this database, I follow the extant literature (e.g., Goldhaber et al., 2013; Marianno & Strunk, 2018; Strunk, 2011, 2012; Strunk & Reardon, 2010) and generate a series of CBA restrictiveness measures that capture the main working conditions and procedures that could inhibit or facilitate student interventions and teacher sorting.
Student supports and intervention items
I cull from contracts (more details on this process are provided below) items related to four subareas of the CBA that could reasonably affect the supports and interventions provided to students—nonteaching duties, grievances, school workday, and class size. I list the individual contract items within these five contract subareas in Appendix Table A1 (all appendixes are available on the journal website). The nonteaching duties measure is composed of nine items (α = .731) that dictate the amount of time teachers can reasonably be expected to spend outside instructional time in order to support student activities. Strict provisions in this regard may limit the ability of administration to train and deploy staff in supporting students. The grievance measure is composed of seven items (α = .605) that set the requirements for contract enforcement and could realistically tie up administrator time and resources in defending how they implement the CBA. The school workday measure contains 11 provisions (α = .642) that limit teacher time before and after school and set boundaries on the length of the workday and the number of instructional minutes. Intervention efforts must be reconciled with these contract regulations. Finally, the class size measure is composed of 17 items (α = .827) that dictate the processes and procedures for classes that exceed the contractual maximums.
Student access to teaching talent items
I also isolate items from four subareas of California CBAs that could shape how teachers are distributed to schools and the access of economically disadvantaged and diverse students to high-quality, effective teachers. These provisions fall in the areas of compensation bonuses, performance evaluation, leave, and transfers. The items for these subarea measures are shown in Appendix Table A2. The compensation bonuses subarea measure is made up of 23 items (α = .755) that pertain to regulations that govern the affordances of bonuses to teachers in critical shortage areas, to teachers completing degrees and extra certifications, and to experienced teachers transferring into or remaining with the district. These items could shape the ability of school districts to attract needed teachers, particularly to positions in disadvantaged locations. The performance evaluation measure is derived from 13 items (α = .722) that dictate the ability of administrators to build a case against ineffective teachers for dismissal. The leave measure is composed of 10 items (α = .631) that outline the amount of parenting, maternity, and sabbatical leave received by teachers. The transfer measure is made up of 24 items (α = .638) that require transfers to be determined by seniority in lieu of other factors or that provide an order for determining the filling of open positions. These provisions could lead to a disproportionate number of experienced teachers instructing predominantly White or affluent students and a larger share of novice teachers instructing lower income or diverse students if senior teachers self-select into less diverse, more affluent locations.
Partial independence item response model
I created the aforementioned measures of contract restrictiveness following a process outlined in Strunk and Reardon (2010) and validated by Goldhaber et al. (2013). I generated the measures from a set of contracts that were collected once every 3 years beginning with the 2008–2009 school year and concluding with the 2014–2015 school year. Each contract was individually coded for 253 contract items. To identify which items reliably indicate underlying restrictiveness within each contract subarea, I conducted a Cronbach’s alpha item analysis on each contract subarea to eliminate weakly related items. Following Strunk and Reardon (2010), I removed items that were correlated with latent subarea restrictiveness at less than 0.25, resulting in the final set of items for each subarea listed in Appendix Tables A1 and A2.
To create each subarea restrictiveness measure, I utilized a partial independent item response model (PIIR). The PIIR model operates on the premise that each area of the CBA has a latent restrictiveness that can be inferred from the presence or the absence of various provisions that constrain district operations in that area of the contract much like a correct or an incorrect answer on a test can be used to infer a student’s latent understanding of a subject. The PIIR model allows for the fact that some provisions will be interdependent such that a more restrictive provision can only be present if a less restrictive “gate” provision is also present (e.g., the teacher workday cannot be limited to 7 hours or less unless it is also restricted to 7.25 hours or less). Thus, although each contract provision is measured dichotomously based on its presence or absence, more and less restrictive provisions governing the same district behavior can also be incorporated by modeling their interdependence. The model is formally estimated as a hierarchical random effects model, taking into account this conditional (or gate) structure, as well as the fact that CBAs in my data are nested in collection years. I define
I estimate the structural model as follows:
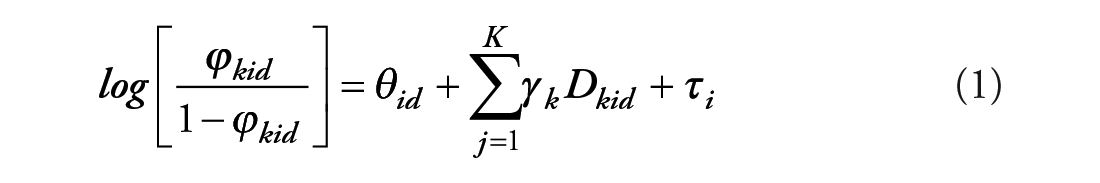
D is a dummy variable indicating whether each provision is present in each contract, with
Continuous treatment
The timing of changes to school district CBAs is critical to the identification of a comparison group that can generate a counterfactual by which to estimate the impact of treatment, or of changing CBAs, on district achievement gaps. That is, per the Rodda Act (1975), California public school districts must negotiate with their labor partners no later than every 3 years. The routine timing of these negotiations presents a plausibly exogenous source of variation by which to create a comparison set up districts that made no changes to their bargaining agreements in a given year because their contracts were not up for renegotiation. These districts can be compared to a set of treatment districts, who, because of their established bargaining cycle, changed the restrictiveness of their CBA in a given year.
I derived the timing of CBA negotiations for a given district from the expiration dates provided in the individual contracts. Again, the CBA database contains the operating CBA in each school district in the sample for the 2008–2009, 2011–2012, and 2014–2015 school years. Consequently, the first potential treatment year for a given school district is 2009–2010, the first year that a contract operating on collection in 2008–2009 could effectually be superseded by the operating contract collected in 2011–2012. Appendix Table B1 provides information on the timing of CBA changes by area of the contract. For example, 59% of school districts renegotiated their CBAs in the 2009–2010 school year. Note that Appendix Table B1 shows that no districts renegotiated their CBAs during the 2008–2009 school year. This is because I do not have information on contract spans for CBAs collected before 2008–2009 (and by virtue of the way in which the contracts were collected, I know that the contract collected in 2008–2009 is the operating CBA for that year and may have been in place sooner). Appendix Table B2 shows that 42% of districts in the sample consistently negotiate on a 3-year cycle and another 16% consistently negotiate on a cycle that is less than 3 years. The remaining districts (42%) negotiate on a cycle that varies in length.
In the two-way fixed effects model within the difference-in-differences framework presented below, subarea restrictiveness is utilized as a continuous policy treatment variable (Kelchen et al., 2019). Treatment is identified as a change in the subarea restrictiveness of the contract (relative to not making any changes because the contract was not up for renegotiation that year). Table 1 shows the size of the first treatment group and control group in the first potential treatment year (2009–2010) with complete achievement gap data. In total, 116 districts made no changes to their CBAs because they did not negotiate in 2009–2010 and 161 districts made changes. Table 1 also tests for differences in outcome levels between the 2009–2010 treatment and control groups at baseline (the 2008–2009 school year). I find no significant differences between no change and change districts on the outcome variables. The two-sample t-test results in Table 1 further indicate that none of the differences between no change and change districts on the independent variables are statistically significant at p < .05. These results suggests a fair degree of compositional balance between the treatment group and control group at baseline.5,6
Summary Statistics of Key Variables at Baseline (2008–2009) by Treatment Status in 2009–2010

Note. Two-sample t tests were used to test for significant differences between change and no change districts. W–B = White–Black; W–H = White–Hispanic/Latino; ELA = English language arts; NED–ED = noneconomically disadvantaged–economically disadvantaged; FRL = free or reduced-price lunch.
p < .10. *p < .05. **p < .01. ***p < .001.
District Achievement Gaps
I draw data on student subgroup achievement gaps from the SEDA (Reardon, Ho, et al., 2019). Student subgroup achievement gaps in the SEDA data are created for a national set of schools, districts, counties, and metropolitan statistical areas through a process outlined extensively in the research literature (Ho & Reardon, 2012; Reardon et al., 2017; Reardon & Ho, 2015; Reardon, Kalogrides, & Ho, 2019; Reardon, Kalogrides, & Shore, 2019). In short, based on the frequencies of students scoring in ordered proficiency categories, Reardon, Ho, et al. (2019) estimate means and standard deviations of subgroup test score distributions for students in multiple states, grades, subjects, and years. One of the benefits of the SEDA data is that the test scores are linked to a common exam, which helps mitigate issues with differences in exams between states and over time. Discussed by Reardon, Kalogrides, and Ho (2019), the subgroup score estimates in the SEDA data are linked to the corresponding National Assessment of Educational Progress (NAEP) subject, year, and grade score distribution. The resulting measures are made more interpretable after being placed on what the SEDA documentation calls the Cohort Standardized Scale. This is done by dividing the new district, year, grade, and subject means by the national grade subject-specific standard deviation for the 2009, 2011, and 2013 NAEP cohorts. 7
For this analysis, I rely on district-level third-grade achievement gaps from 2008–2009 to 2014–2015. The SEDA data have information on the following ELA and math achievement gaps: White (W)–Black (B), White (W)–Hispanic/Latino(H), and noneconomically (NED)–economically disadvantaged (ED). I utilize third-grade scores because third grade is the first year when California students take the summative state exam. Table 1 provides the mean achievement gap scores for each measure for all districts in the sample and for the treatment and control groups. For example, the average W–B ELA achievement gap for California districts in the sample is 0.58. This indicates that the average difference in W–B student ELA achievement in California districts is 0.58 SDs above the national third-grade NAEP cohort average.
Other School and District Control Variables
I also control for other important factors that may influence general school working conditions and student achievement, including the natural log of district enrollment, the percentage of free and-reduced-price lunch students, the percentage of teachers with a master’s degree, the percentage of teachers with more than a master’s degree, the percentage of Black students, and the percentage of Hispanic/Latino students. These variables are drawn from the National Center for Education Statistics Common Core Data Files and the California Department of Education’s Annual Performance Index data files.
Analytic Strategy
To estimate the relationship between changes in CBAs and district achievement gaps, I employ a two-way fixed effects model in a difference-in-differences framework. The model is an adaptation of the traditional difference-in-differences model to allow for treatment to occur at different times for different units and is formally specified as follows:

where a(d) is a district fixed effect and b(t) a time fixed effect. In the model, R(d,t) captures the subarea restrictiveness of a contract in time period t in district d. The outcome variable for these models, Y(d,t), is ELA or math subgroup achievement gap for district d in year t. C(d,t) is a vector of time-varying district characteristics. e(d,t) is a random error term.
The primary identifying assumption underlying this model is that outcomes in districts that changed the restrictiveness of their CBAs would have followed parallel paths to the outcomes in districts that did not change their CBAs (because they were not up for negotiation) in the absence of contract changes. A visual inspection of pretreatment trends becomes inherently more challenging when the timing of treatment varies over time and when districts can jump in and out of treatment based on the timing of their contract negotiations. Nonetheless, I follow Kelchen et al. (2019) and Wing et al. (2018) and run a series of checks to test the plausibility that this assumption is met. These tests are discussed in more detail below.
Results
Tables 2 and 3 provide the full results from Equation (2) for each contract subarea and achievement gap measure. The coefficient on the subarea restrictiveness measure captures the change in the achievement gap (in standard deviation units) for a standard deviation increase in restrictiveness. I highlight coefficients in the tables with associated p values that are less than .10 but only discuss coefficients with associated p values that are less than .05.
Difference-in-Difference Models Predicting Third-Grade District Achievement Gaps Based on Collective Bargaining Agreement Changes (Student Supports and Intervention Subareas)

Note. Each numbered column is from a separate two-way fixed effects (FE) regression model with district and year fixed effects. The models also control for district enrollment (ln), % FRL students, % teachers with a master’s degree, % teachers with greater than a master’s degree, % Black students, and % Hispanic students. Standard errors are clustered at the district level. Subarea restrictiveness is measured continuously and standardized with respect to the base year. Achievement gaps are measured on the Stanford Education Data Archive cohort scale and are interpretable in terms of standard deviation unit difference from the average of the third-grade NAEP (National Assessment of Educational Progress) cohort in 2009, 2011, and 2013. W–B = White–Black; W–H = White–Hispanic/Latino; ELA = English language arts; NED–ED = noneconomically disadvantaged–economically disadvantaged; FRL = free or reduced-price lunch.
p < .10. *p < .05. **p < .01. ***p < .001.
Difference-in-Difference Models Predicting Third-Grade District Achievement Gaps Based on Collective Bargaining Agreement Changes (Student Access to Teaching Talent Subareas)

Note. Each numbered column is from a separate two-way fixed effects (FE) regression model with district and year fixed effects. The models also control for district enrollment (ln), % FRL students, % teachers with a master’s degree, % teachers with greater than a master’s degree, % Black students, and % Hispanic students. Standard errors are clustered at the district level. Subarea restrictiveness is measured continuously and standardized with respect to the base year. Achievement gaps are measured on the Stanford Education Data Archive cohort scale and are interpretable in terms of standard deviation unit difference from the average of the third-grade NAEP (National Assessment of Educational Progress) cohort in 2009, 2011, and 2013. W–B = White–Black; W–H = White–Hispanic/Latino; ELA = English language arts; NED–ED = noneconomically disadvantaged–economically disadvantaged; FRL = free or reduced-price lunch.
p < .10. *p < .05. **p < .01. ***p < .001.
White–Black Achievement Gaps
I find that one of the four student supports and intervention contract subareas (class size) is significantly associated with the W–B achievement gap. Table 2, column 22 reveals that a 1 SD increase in the restrictiveness of class size contract policies is associated with a 0.05 SD decrease in the W–B achievement gap in math (but not ELA). A 0.05 SD decrease for the average school district at baseline would equate to a 7.7% decrease in the W–B math achievement gap. The estimated coefficients are approximately zero for all of the other student supports and intervention subareas.
Table 3 shows that the four student access to teaching talent contract subareas (i.e., compensation, evaluation, leave, transfers, and vacancies) are not significantly associated with ELA or math W–B achievement gaps. Again, the estimated coefficients are approximately zero.
White–Hispanic/Latino Achievement Gaps
In terms of the W–H achievement ELA and math gaps, Tables 2 and 3 reveal that none of the four student supports and intervention contract subareas and the four student access to teaching talent contract subareas are significantly associated with W–H achievement gaps. These coefficients are small (generally around 0.01 SD) and do not reach conventional levels of statistical significance.
Noneconomically–Economically Disadvantaged Achievement Gaps
I find that of the four student supports and intervention subareas, only changes to the nonteaching duties subarea (Table 2, column 15) are significantly associated with changes in the NED–ED achievement gap, and only in math. A 1 SD increase in the restrictiveness of the nonteaching duties subarea is associated with a 0.01 SD decrease in NED–ED math achievement gap. A 0.01 SD decrease for the average school district at baseline would equate to a 1.7% decrease in the NED–ED math achievement gap.
In terms of the student access to teaching talent subareas, I find that a 1 SD increase in the restrictiveness of teacher evaluation procedures is associated with a 0.02 SD increase in the NED–ED achievement gap, and again, only in math (Table 3, column 18). A 0.02 SD increase for the average school district at baseline would equate to a 3.3% increase in the NED–ED math achievement gap.
Lagged Effects
Of course, the effect of changes in CBA content on changes in achievement gaps may not be immediate in all cases. Instead, it may take longer for some CBA changes to begin to modify student intervention efforts/the distribution of teachers and for those changes to subsequently show up in changes in achievement gaps. Appendix Tables E1 and E2 provide results derived from versions of Equation (2) estimated on achievement gap outcomes at timepoints t + 1, t + 2, and t + 3.
Appendix Table E1 shows that of the four student supports and intervention subareas, only one could be said to reasonably have a lagged effect on achievement gap outcomes. Appendix Table E1, columns 2 and 18, shows that a 1 SD increase in nonteaching duties subarea restrictiveness is associated with a 0.02 SD increase in the W–B ELA achievement gap and a 0.03 SD increase in the W–B math achievement gap at time t + 1. A 0.03 SD increase for the average school district at baseline would equate to a 4.6% increase in the W–B math achievement gap.
Appendix Table E2 shows that of the student access to teaching talent subareas, three exhibit some lagged effects (compensation on the NED–ED ELA achievement gap; evaluation on the W–H ELA and math achievement gaps; and leave on the NED–ED ELA and math achievement gaps). Increased restrictions in the area of compensation are associated with a decrease (of 0.02 SD) in the NED–ED ELA achievement gap in t + 1 (column 66). Increased restrictions in the area of evaluation are associated with an increase in the W–H achievement gap in t + 1 (0.03 SD in ELA and 0.02 SD in math) and t + 2 (0.03 SD in ELA; columns 38, 39, and 54). Finally, increased restrictions in the area of leave are associated with an increase (of 0.02 SD) in the NED–ED ELA achievement gap in t + 1 (column 74) and an increase (of 0.02 SD) in the NED–ED ELA math achievement gap in t + 2 (column 91).
Robustness Checks
For these models to be taken as causal evidence, we must believe that outcomes in districts that changed the restrictiveness of their CBAs would have followed parallel paths to outcomes in districts that did not change their CBAs (because they were not up for negotiation) in the absence of contract changes (i.e., the parallel trends assumption). As mentioned above, Table 1 shows that the treatment and control groups are equal in level on outcomes and independent variables at baseline, which could suggest that these groups were also equal in trend in the pretreatment period (Kahn-Lang & Lang, 2020). However, I test this assumption more formally below.
Modified Granger causality tests
To test for parallel trends more directly, I first run a modified Granger causality test that assigns leads for policy adoption (Kelchen et al., 2019; Wing et al., 2018). When CBA changes are set to occur prior to when they actually do, they should not significantly predict achievement gap outcomes. Any significant effects may be an indicator of the lack of parallel pretreatment trends. For this analysis, I estimate an equation of the following form:

I use a 3-year lead for CBA changes because, as shown in Appendix Table B2, the typical negotiation cycle for most California school districts is 3 years or fewer. Only 2% of school districts at baseline had contracts that extended beyond a 3-year time frame. Under the null hypothesis, ∂ should equal to zero, indicating that changes in achievement gaps, Y(d, t), do not occur prior to treatment.
The results of this modified Granger causality test are shown in Appendix Tables F1 and F2. With each of the eight subareas, three different outcome variables, and ELA and math measures, I ran 48 different tests. I find that only one of the lead treatment variables are statistically significant at p < .05. The significant test occurs on the coefficient that captures the relationship between changes in transfer and vacancy restrictiveness and changes in the White–Black ELA achievement gap (Appendix Table F1, column 10). For the five other achievement gap outcomes across all of the subareas, this test yields more confidence in parallel pretreatment trends.
I modify the Granger causality test further by adding back in the contemporaneous treatment variable with the 3-year lead of treatment. If the relationship between contemporaneous treatments changes as a result of controlling for future treatment, then this provides some evidence of selection on trends. That is, future treatment is anticipated by current achievement outcomes. I utilize the following equation:

I provide the results from this test in Appendix Tables F3 and F4. With each of the eight subareas, three different outcome variables, and ELA and math measures, I ran 48 different tests for changes in my main results after controlling for lead treatment. The first two panels show the main ELA and math results; however, because controlling for future treatment requires dropping 3 years of the panel (because observations in years after 2012 do not have future treatment status that is 3 years out), I rerun the main results on only observations from the years 2009 through 2012.
Most of the changes in the main results are due to the drop in the final years of the panel and not due to controlling for future restrictiveness. Of the three statistically significant main results from Tables 2 and 3, two of the results lose statistical significance in the first two panels once the years 2013 through 2015 are dropped from the panel. However, the coefficients are still identical in magnitude to the main results. The one effect that does retain statistical significance (Appendix Table F3, column 46) is slightly larger in magnitude after controlling for future restrictiveness. I conclude that there is little evidence that future treatment is anticipated by current achievement outcomes.
Group-specific linear trends
A final strategy for investigating the parallel trends assumption is to fit an augmented difference-in-differences model that allows for group-specific linear trends (Kelchen et al., 2019; Wing et al., 2018). In this case, each school district is allowed to follow a unique trend over time, thereby relaxing the parallel trends assumption. If the results between my main specifications under the parallel trends assumption are similar to the results with district-specific linear trends, this provides additional support for parallel trends. These models take the following form:

In this model,
Limitations
The results of this article should be interpreted in light of a few limitations. The results of the study are generalizable only to California and to the largest school districts in the state. The observed results may not hold in other states where the scope of collective bargaining negotiations are different and where the climate for teachers’ unions is less favorable.
The results also do not provide a clear indication as to why changes in contracts are related to changes in student achievement gaps. First, I cannot be completely sure that the observed changes in CBAs and achievement gaps are not due to other contemporaneous changes in district policy, although the robustness checks help assuage some of this concern. More generally, I cannot link changes in contract policies to changes in the distribution of teacher quality across different student subgroups. I also do not observe how specific changes to CBAs impede or inhibit administrators’ ability to change instructional practice or marshal resources for student supports and interventions. Future research in this regard would greatly improve our knowledge of why some changes in CBAs are associated with changes in achievement gaps.
Finally, although I provide some evidence that the parallel trends assumption is met, I cannot prove this point definitively. Consequently, these results should be taken only as suggestive of a causal relationship between changes in CBAs and changes in achievement gaps.
Discussion and Conclusion
One of the central questions of education research since the publication of the Coleman report concerns the sources of and solutions for education achievement gaps (Reardon, Kalogrides, & Shores, 2019). This study provides one of the first investigations in the extant literature on the relationship between local district policy ensconced in teacher CBAs and racial and economic gaps in student achievement. I provide some evidence that achievement gaps in California are smaller where contracts increase in restrictiveness in class size and larger where contracts increase in restrictiveness in teacher evaluation and leave policies. I find that changes to the nonteaching duties subarea are associated with both increases and decreases in achievement gaps, depending on the student subgroup. These effects are primarily concentrated in math and not ELA, are relatively small in magnitude, and are sometimes delayed in their timing.
Although the results of this study pinpoint specific areas of the contract that are likely associated with achievement gaps for specific subgroups of students, the reasons for the observed relationships are still not well understood. I hypothesized that restrictive CBA content surrounding student supports and intervention efforts (in the areas of nonteaching duties, grievances, school workday, and class size) would be strongly related to achievement gaps as these areas of the CBA may make it more or less difficult to address student needs. Interestingly, the effects of the student supports and intervention subareas do not always work in the same direction. That is, class size restrictions are associated with decreased achievement gaps, mainly between White and Black students. The class size subarea primarily captures the strength of the restrictions imposed when class sizes are exceeded, including the addition of teachers, the reorganization of classes, and the movement of students, all of which could help ensure that class sizes remain at levels to benefit Black students. I further find that nonteaching duties restrictions are associated with decreased achievement gaps between NED and ED students but increased achievement gaps between White and Black students. These results are more difficult to interpret as it is not entirely clear why the restrictions captured by this subarea (like the length of faculty meetings and preparation time) would influence achievement disparities between White and Black students differently from how they influence disparities between NED and ED students.
Additionally, these results suggest that two contract subareas connected to student access to teaching talent are problematic for student achievement gaps. Enhanced restrictions in the area of teacher evaluation are associated with increased achievement gaps between Hispanic/Latino and White students and NED and ED students. This might have something to do with the inability of prescriptive evaluation systems to identify and promote effective teaching or remove ineffective teachers, particularly those instructing diverse and ED students. Additionally, increases in the restrictiveness of teacher leave policies appear to be associated with a widening of the NED–ED student achievement gap. Improvements to the amount of parenting, maternity, and sabbatical leave (as captured by the leave subarea) might lead to the midyear replacement of classroom teachers, particularly younger teachers who are more likely to utilize these policies and are also more likely to teach ED students (Grissom et al., 2015).
Taken together, this research suggests that the effect of CBAs on student performance is small and heterogeneous across student subgroups and areas of the contract. This study is a necessary first step toward understanding the types of provisions that affect students differently but leaves room for future research. To better understand the relationships between achievement gaps and CBAs, future research should strive to qualitatively untangle the mechanisms that drive how CBA provisions shape the performance of different student subgroups. As mentioned above, this article hypothesizes why CBAs might matter for the attenuation of and worsening of equitable achievement outcomes, but additional research could add a richer narrative to the observed results. Future research should also utilize more nuanced teacher- and student-level data that can observe patterns in teacher quality, teacher assignment, and student mobility over time to better disentangle the patterns behind the relationships documented in this study. In addition, given the changing state policy context for unions and collective bargaining around the nation in recent years (e.g., Michigan, Tennessee, and Wisconsin), future research might seek to exploit changes to state law regarding the scope of collective bargaining in order to better isolate causal impacts of changes to CBAs on racial achievement gaps. Also, performing this research in states outside California, where the strength of unions and the bargaining climate are different, would assist in assessing the external validity of this study’s findings.
Supplemental Material
sj-pdf-1-edr-10.3102_0013189X211006357 – Supplemental material for A Negotiated Disadvantage? California Collective Bargaining Agreements and Achievement Gaps
Supplemental material, sj-pdf-1-edr-10.3102_0013189X211006357 for A Negotiated Disadvantage? California Collective Bargaining Agreements and Achievement Gaps by Bradley D. Marianno in Educational Researcher
Footnotes
Notes
Author
References
Supplementary Material
Please find the following supplemental material available below.
For Open Access articles published under a Creative Commons License, all supplemental material carries the same license as the article it is associated with.
For non-Open Access articles published, all supplemental material carries a non-exclusive license, and permission requests for re-use of supplemental material or any part of supplemental material shall be sent directly to the copyright owner as specified in the copyright notice associated with the article.