
Abstract
Researchers have shown that receiving suspensions is associated with negative educational outcomes. However, existing studies fail to control for unobservable differences between those students who received suspensions and those who did not. In this study, I compare achievement for a given student across school quarters with varying types and levels of suspensions by taking advantage of a unique dataset that measures student achievement at 12 time points across 3 academic years. Results show that multiple suspensions are associated with lower math and English language arts achievement even after controlling for differences between students. Furthermore, I find suggestive evidence that these associations are stronger for students who have an elevated risk of suspensions.
Keywords
During the 2011–2012 academic year, approximately 3.5 million students in the United States received suspensions, and one third of those received suspensions multiple times (Losen et al., 2015). Suspension rates vary considerably across subgroups. The suspension rate is more than three times higher for Black students than for White students (Losen & Gillespie, 2012). In addition, students from lower socioeconomic backgrounds (Petras, Masyn, Buckley, Ialongo, & Kellam, 2011) and students who receive special education services (Losen et al., 2015; Morrison & D’Incau, 1997; Skiba, Peterson, & Williams, 1997) are at least 1.5 times more likely to receive suspensions than their counterparts. Although overall suspension rates have decreased in recent years, discipline gaps across subgroups remain largely unchanged (Stevens, Sartain, Allensworth, & Levenstein, 2015).
The stark differences in suspension rates across subgroups are particularly problematic in light of evidence suggesting that suspensions may not only be ineffective as an approach to modifying the suspended students’ behavior (Monahan, VanDerhei, Bechtold, & Cauffman, 2014; Raffaele Mendez, 2003) but actually may be counterproductive for these students’ academic development (Arcia, 2006; Morris & Perry, 2016). Because suspensions preclude students from participating in assigned academic activities, suspended students miss days of instruction and end up losing opportunities to learn (Losen, Sun, & Keith, 2017). In addition to loss of instruction time, exclusionary punishment can emotionally and psychologically alienate students from their teachers (Miller, 1986). This weakened bond between students and teachers can result in undesirable educational consequences. Therefore, scholars argue that discipline gaps can alienate disadvantaged students from school (Lee, Cornell, Gregory, & Fan, 2011) and result in achievement gaps (Gregory, Skiba, & Noguera, 2010; Losen et al., 2015).
Unfortunately, however, we lack empirical evidence about the extent to which the links between suspensions and unfavorable youth outcomes are causal. Because a student’s history of suspensions is likely both a symptom and a cause of developmental difficulties, existing studies that compare youth outcomes between suspended students and nonsuspended students are likely to produce biased estimations due to the failure to control for differences between students. One way to control for individual differences between students is a student fixed effects strategy (Monahan et al., 2014). Using student fixed effects allows me to control for unobservable (or unmeasurable) differences, including possible time-invariant characteristics, such as motivation and attitude, between students that could influence both the probability of receiving suspensions and student achievement.
In this study, I take advantage of a unique dataset that measures quarterly student achievement to compare educational achievement in quarters when a student received suspensions with quarters when the same student received fewer or no suspensions. Because student fixed effects are not able to eliminate all the potential time-variant differences between quarters for a given student, the results may not completely preclude the possibility of omitted variable bias. Nevertheless, using a student as his or her own control should yield less biased estimates of the suspension effect. I run models both with and without student fixed effects to examine to what extent controlling for student fixed effects changes the associations between suspensions and educational achievement. I also investigate whether the associations between suspensions and student achievement vary across types (i.e., in-school vs. out-of-school suspensions), number of suspensions (i.e., single vs. multiple suspensions), and subgroups (e.g., racial/ethnic groups). The findings of this study contribute to the literature on suspensions and advance our knowledge about school discipline and its consequences.
Suspensions and Student Development
Scholars have consistently warned that “get tough” school disciplinary practices (e.g., suspensions and expulsions) result in negative outcomes for students (American Academy of Pediatrics, 2013; American Psychological Association, 2008). Once students receive an initial suspension, these students are more likely to be suspended in the future (Raffaele Mendez, 2003) and are less likely to participate in political and civic activities (Kupchik & Catlaw, 2015).
Furthermore, the links between out-of-school suspensions and involvement in the criminal justice system are well documented (Fabelo et al., 2011; Monahan et al., 2014). By using person fixed effects, Monahan and colleagues (2014) compared the probability of arrest across months with varying levels of suspensions for a given student and found that suspensions increase the probability of arrest. Their findings deepen our understandings of the effects of receiving suspensions by controlling for possible time-invariant student characteristics that are important in yielding less biased estimates.
Along with negative behavioral outcomes, out-of-school suspensions are associated with lower educational outcomes (Arcia, 2006; Morris & Perry, 2016). Schools with higher suspension rates exhibit lower achievement levels and higher dropout rates (Christle, Jolivette, & Nelson, 2007; Christle, Nelson, & Jolivette, 2004; Fabelo et al., 2011; Lee et al., 2011), and individuals who receive suspensions exhibit negative future academic outcomes such as decreases in educational achievement and failure to graduate on time (Arcia, 2006; Raffaele Mendez, 2003).
Prior studies have shown the associations between receiving suspensions and negative educational outcomes, but the extent to which the links are robust, after taking time-invariant characteristics into account, remains unknown. As Monahan et al. (2014) provide evidence of suspension effects on arrest by comparing the probability of arrest for a given student across months, investigating whether suspensions are associated with negative educational outcomes for a given student across quarters is important.
Potential varying effects of suspension by frequency, type, and subgroup
The effects of suspensions on achievement can vary according to several factors, including frequency of suspension, type of suspension, and student subgroups. First, given that an increase in the number of suspensions leads to a decrease in instruction time (Losen et al., 2017), the effects of multiple suspensions are likely to be stronger than the effects of a single suspension. In addition, because suspensions are likely to weaken student-teacher relationships (Miller, 1986), multiple suspensions likely distance students from teachers and school staff, which can undermine student outcomes.
Second, suspension effects can vary by type of suspension. There are several reasons why out-of-school suspensions, in contrast to in-school suspensions, can have different effects on student development. Out-of-school suspensions are physical removals from both the classroom and school; thus, out-of-school suspensions may make students feel more isolated from the school than in-school suspensions. Considering that low levels of attachment to school are a predictor in negative student development (Archambault, Janosz, Fallu, & Pagani, 2009; Dornbusch, Erickson, Laird, & Wong, 2001), out-of-school suspensions can be more detrimental to educational outcomes than in-school suspensions. In addition, an increase in unsupervised time can lead to delinquent behavior (Flannery, Williams, & Vazsonyi, 1999; Griffin, Botvin, Scheier, Diaz, & Miller, 2000), which can impair positive student development.
In-school suspensions have been introduced in response to criticisms of out-of-school suspensions (Chobot & Garibaldi, 1982; Zimmerman & Archbold, 1979). However, in-school suspensions have hardly shown themselves to be a panacea: Like out-of-school suspensions, in-school suspensions are also associated with negative educational outcomes, including lower educational achievement (Noltemeyer, Ward, & Mcloughlin, 2015), lower grades, and higher dropout rates (Cholewa, Hull, Babcock, & Smith, 2017). In addition, given that interventions that allow at-risk youth to spend more time with other at-risk youth can exacerbate problematic behavior (Dodge, Dishion, & Lansford, 2006; McCord, 2003), in-school suspensions likely result in undesirable student development, especially when teachers view in-school suspensions as a “dumping ground” for students with uncontrollable behavior (Diem, 1988).
Third, the effects of suspension can be stronger for students who have an elevated risk of suspensions. For example, when Hispanic or Black students receive suspensions, they are more likely to develop a negative self-image because they receive a message that they belong to a group that is associated with negative stereotypes. Given that racial/ethnic minority students tend to be stereotyped as threats or dangers (Steele, 1997; Welch & Payne, 2010), suspension may play into this stereotype, creating a self-fulling prophecy that undermines a sense of school belonging. This sense of alienation from the school environment can eventually lead to negative student development (Walton & Cohen, 2007).
In addition, the effects of suspensions can be more negative for students who lack support and resources from families. In theory, suspension should be a message from the school to the home that tells parents that a student has behavioral issues and needs more care and more attention (American Academy of Pediatrics, 2003). However, given that parental involvement likely varies across family backgrounds (Domina, 2005), the suspension effects can differ by student subgroups. For example, because parents of low-income households may have less flexible work schedules and less knowledge about ways to connect to school systems, students from low-income families may struggle more after suspensions than do suspended students from more affluent families.
In sum, existing studies provide useful information about the effects of suspension on student development and suggestive evidence of heterogeneous effects of suspension. However, researchers have not systematically investigated the varying effects of suspensions on student achievement nor taken into account the unobservable differences between students. In this study, I run models both with and without student fixed effects to test the extent to which controlling for student fixed effects alters the links between suspensions and student achievement. Furthermore, I examine whether the links between suspensions and achievement vary across frequency of suspension, type of suspension, and subgroups. This study’s findings will provide better evidence on the links between suspensions and educational achievement and offer critical information about disciplinary practices.
Research questions
Based on prior studies, I ask the following research questions:
Is receiving suspensions associated with math and ELA achievement across quarters for a given student?
Do associations between receiving suspensions and educational achievement vary by frequency of suspension, type of suspension, and student subgroups?
Method
Data
I used administrative data from one California school district in a suburban area. The study’s sample includes data on 7th-grade through 11th-grade students in 17 different schools (10 middle schools and 7 high schools). The sample has a total of 15,928 students, and I observed the end of quarter math and ELA achievement four times a year for a 3-year period from 2009–2010 through 2011–2012. I merged the data of student demographic characteristics and educational achievement scores (i.e., Benchmark Test Scores) to discipline records using unique student identification numbers. All records are from the district-wide administrative data system in the district. Because this study’s main focus is the links between suspensions and student achievement, I restricted the sample to the period when a student is in the grades where both test scores and discipline recodes are available (i.e., 7th grade through 11th grade). The data have approximately 50,000 missing cases of student-quarter observations due to unavailable test scores caused by missing tests, students’ relocation, and students’ moving in and out of test grades. Therefore, the sample in the analyses includes a total of 138,712 student-quarter observations for math and 137,737 observations for ELA models.
Table 1 shows descriptive statistics of the student sample in the analyses. Approximately 50% of students are girls, and the majority of students are Hispanic (52%) and Asian (34%). In addition, 12% of students are White, 1% of students are Black, and 1% of students are some other race/ethnicity. Approximately 70% of students are eligible for free or reduced-price lunch (FRL), 19% of students are English language learners (ELL), and 3% are special education students.
Descriptive Statistics of Student Demographic Characteristics, Educational Achievement, and Suspensions
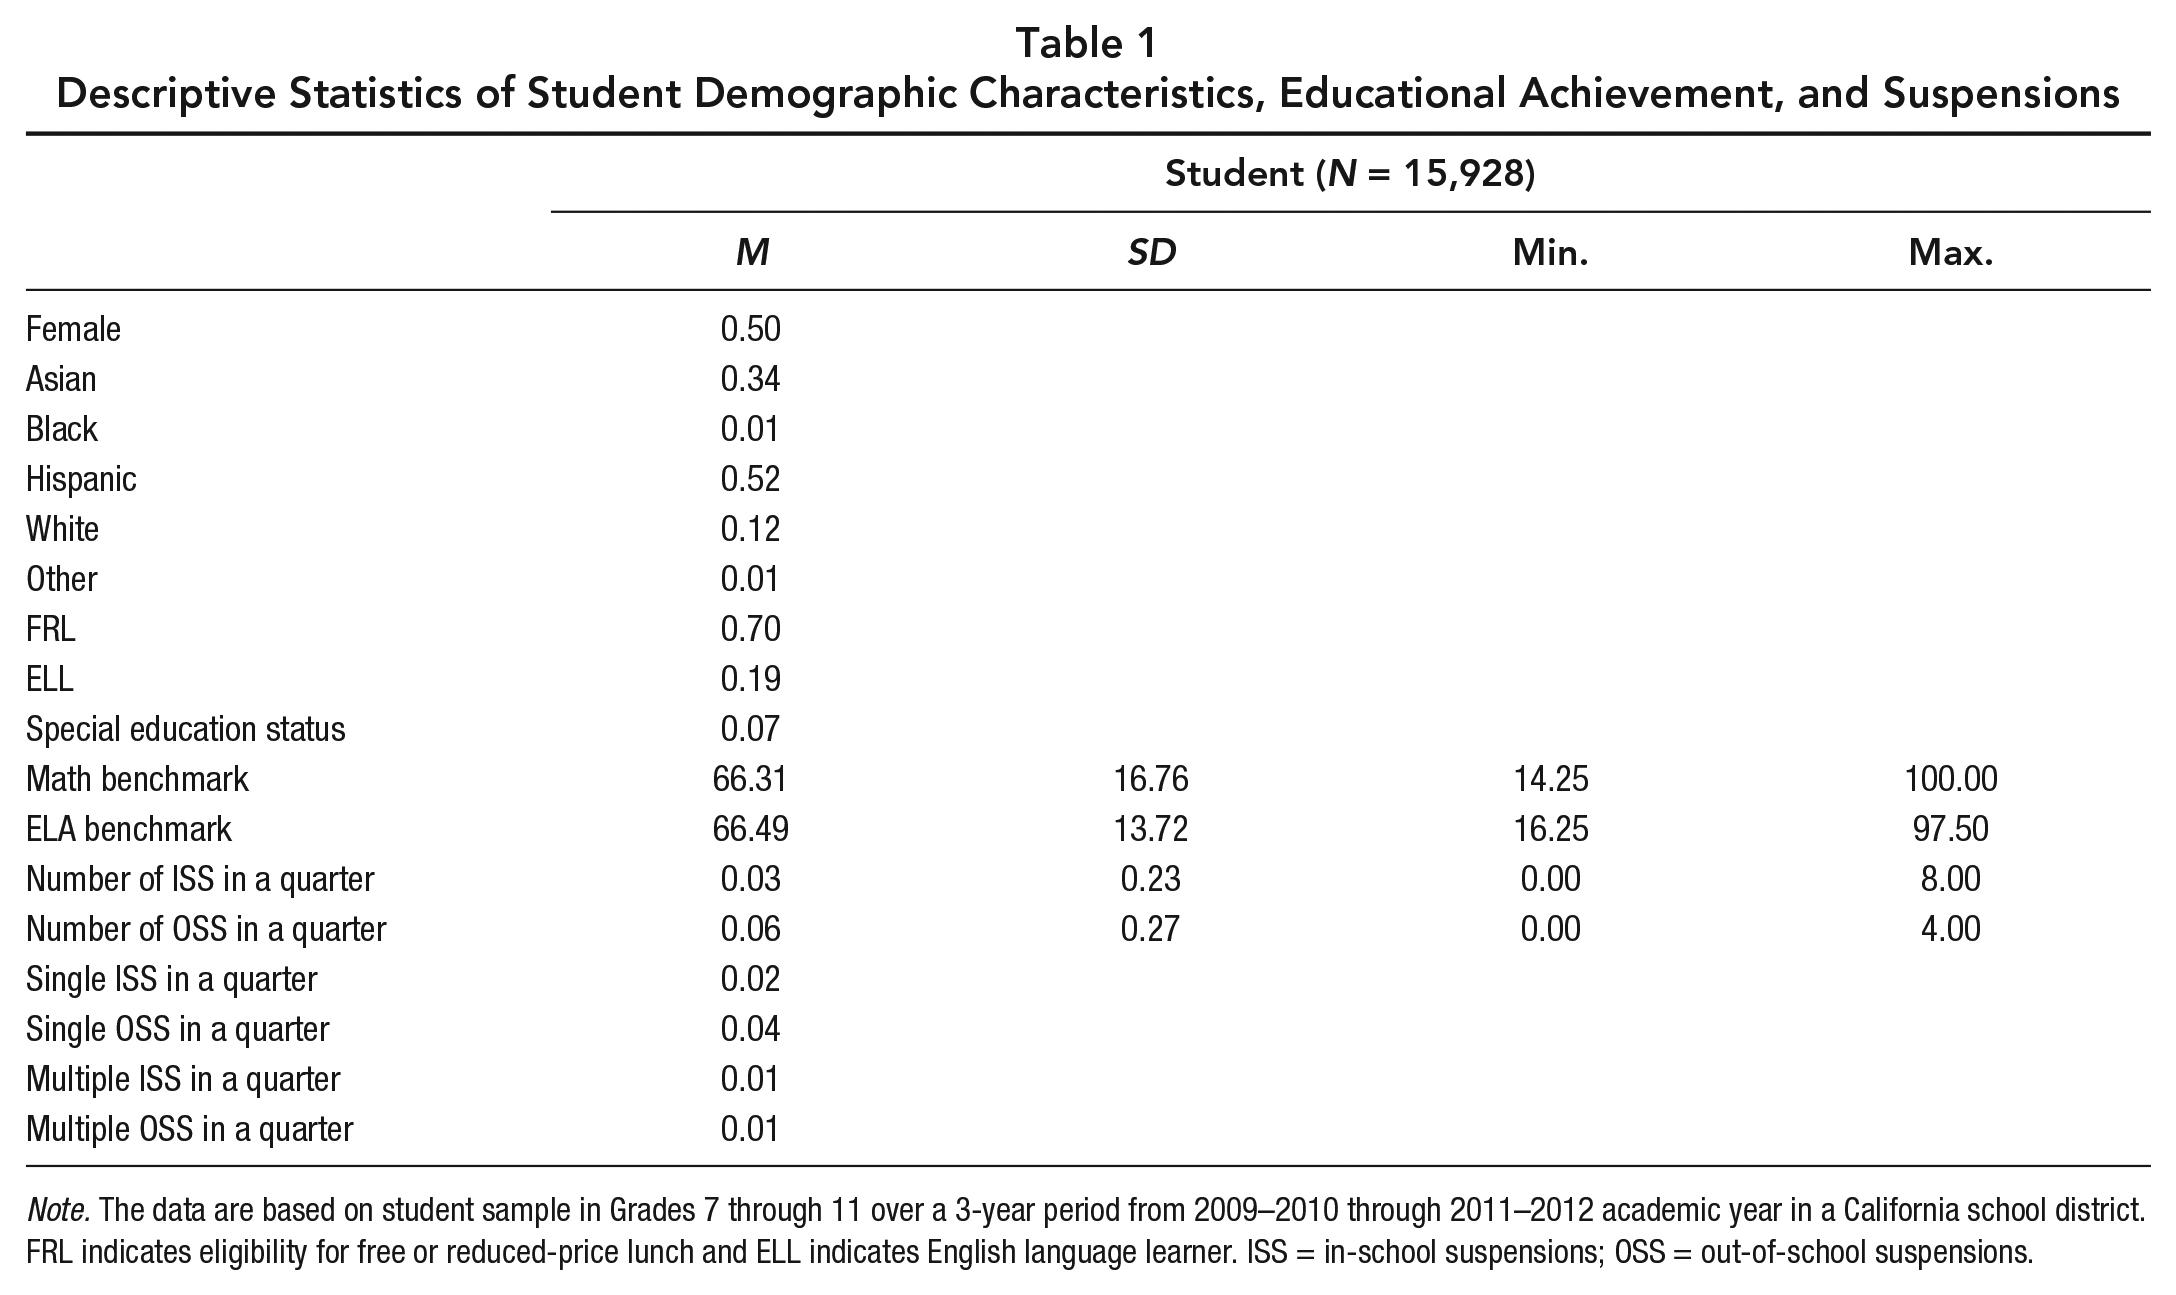
Note. The data are based on student sample in Grades 7 through 11 over a 3-year period from 2009–2010 through 2011–2012 academic year in a California school district. FRL indicates eligibility for free or reduced-price lunch and ELL indicates English language learner. ISS = in-school suspensions; OSS = out-of-school suspensions.
Table 2 shows the percentage of suspended students across quarters based on student sample. Only a few students receive suspensions in the beginning of the academic year, but more students received suspensions toward the end of the academic year. For example, 0.39% of students received in-school suspensions and 0.83% of students received out-of-school suspensions in the first quarter, whereas 0.82% of students received in-school suspensions and 1.99% of students received out-of-school suspensions in the last quarter. In a given quarter, most of suspended students received single suspensions rather than multiple suspensions.
Descriptive Information on Percentage of Suspended Students Across Quarters

Note. The data are based on student sample in Grade 7 through Grade 11 over a 3-year period from 2009–2010 through 2011–2012 in a California school district. ISS = in-school suspensions; OSS = out-of-school suspensions.
Table 3 shows that the overall yearly suspension rates of the sample are 1.8% for in-school suspensions and 3.9% for out-of-school suspensions. Certain groups of students received suspensions more frequently than other groups of students. Students who are male, Hispanic, FRL, ELL, and students who receive special education programs received suspensions at a higher rate than their counterparts. For example, 1.3% of Asian students received out-of-school suspensions, whereas 5.6% of Hispanic students received out-of-school suspensions.
Yearly Suspension Rates Across Subgroups
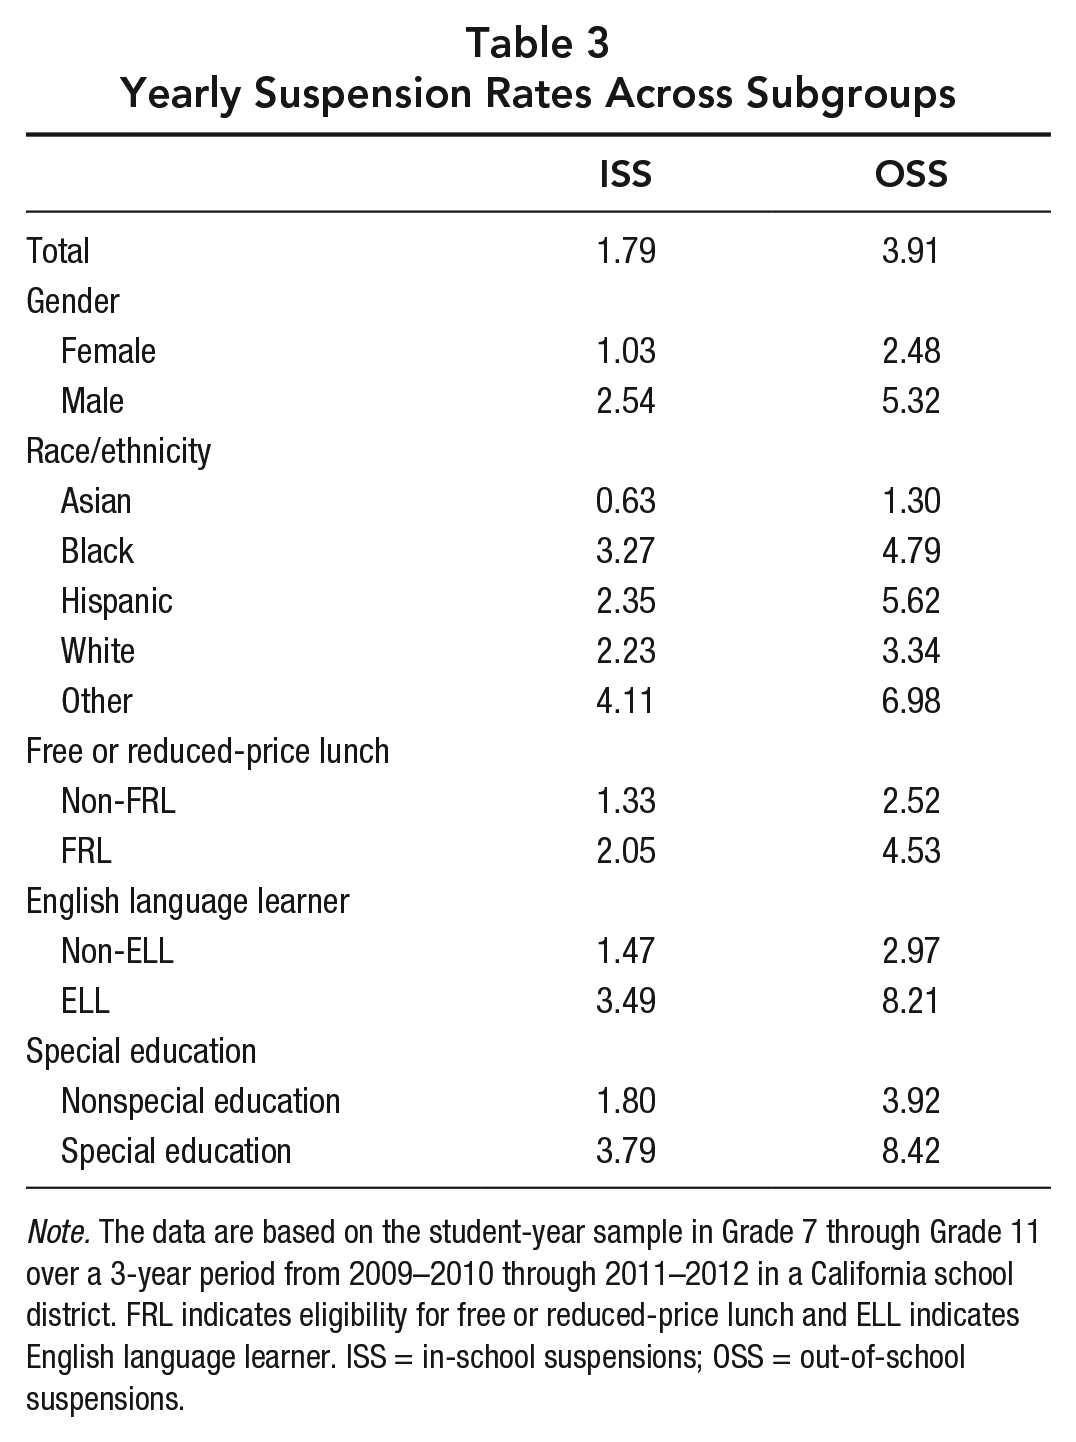
Note. The data are based on the student-year sample in Grade 7 through Grade 11 over a 3-year period from 2009–2010 through 2011–2012 in a California school district. FRL indicates eligibility for free or reduced-price lunch and ELL indicates English language learner. ISS = in-school suspensions; OSS = out-of-school suspensions.
Measures
Dependent variables
I used benchmark test scores as dependent variables to investigate to what extent suspensions are associated with educational achievement. Students across all school sites take benchmark tests four times a year, and teachers and administrators use the test scores to make informed decisions about class placement and to learn about how well students are progressing toward mastery of content. Unlike state assessment tests (i.e., The California Standard Test), the benchmark exams are not high-stake tests. Therefore, there is less concern that schools intentionally exclude low-achieving students on test days. Benchmark test Scores, which are scores of a district-specific test for math and ELA, are continuous variables. Given that students took different math tests depending upon their courses (e.g., algebra, geometry, or trigonometry), I standardized math scores for each course based on each school quarter and year. I excluded students who change math courses within a given academic year in the math analyses sample. For ELA achievement, considering that students took ELA tests by grade, I used standardized ELA scores for each combination of grade, quarter, and year. Using student fixed effects and these standardized scores for math and ELA enables me to compare the educational achievement of the same students across quarters with varying levels of suspensions.
Independent variables
The key variable is the number of suspensions that a student received. I measured suspensions in two different ways. First, to examine whether the associations between suspensions and educational achievement are linear, I included a continuous variable that indicates the number of suspensions that a student received. Second, to examine whether the associations between suspensions and achievement are nonlinear, I included two dummy variables (i.e., single and multiple suspensions) that measure the frequency of suspensions in a given quarter. I created variables in these two different ways for in-school suspensions as well as out-of-school suspensions.
Control variables
I included several control variables—FRL eligibility, ELL status, and special education enrollment status—in the models. First, I created a variable that indicates whether a student is eligible for FRL. FRL eligibility is coded as 1 when a student is eligible for FRL and is coded 0 when a student is not. I also created a variable that indicates whether a student is an ELL. ELL is coded as 1 when a student is ELL and is coded 0 when a student is not. Similarly, I created a variable that indicates whether a student is enrolled in special education. Enrollment in special education is coded as 1 when a student is enrolled in special education and is coded 0 when a student is not.
Analyses
To investigate the associations between suspensions and student achievement, I ran ordinary least squared (OLS) models both without student fixed effects and with student fixed effects. OLS models without student fixed effects compare the educational achievement between suspended students and nonsuspended students. The model is as follows:

To reduce omitted variable bias, I included several fixed effects (i.e., school, grade, year/quarter, teacher fixed effects). For example, given that teachers can play a critical role in student outcomes (e.g., Chetty, Friedman, & Rockoff, 2014), controlling for teacher fixed effects allows me to examine the extent to which suspensions are associated with educational outcomes after taking teacher effects into account. To control for teacher effects, I include specific subject teacher (i.e., math teacher fixed effects for the model that predicts math achievement and ELA teacher fixed effects for the model that predicts ELA achievement) in the model. Adding school fixed effects to the models allows me to control for school effects that may produce biased estimations. Similarly, grade, year, and quarter fixed effects control for the potential grade, year, and quarter effects that may yield biased estimations. Because suspension events can occur more frequently in certain schools, grades, years, and quarters than in others, including school, grade, year, and quarter fixed effects enables me to control for these school, grade, and time effects. Standard errors are clustered at the student level.
Next, I include student fixed effects in the model to examine the association between suspensions and educational achievement after controlling for unobservable differences between students. The student fixed effects approach allows me to compare the educational achievement of the same students across quarters in which the frequency of suspension varied. This is similar to the approach used by Monahan et al. (2014), who used student fixed effects with 1,354 juvenile offenders to investigate whether receiving out-of-school suspensions or expulsions increases the probability of arrest. By including student fixed effects, I remove between-student differences that can lead to biased estimations (Allison, 2009). The model is as follows:

Finally, I investigate whether and to what extent the associations between suspensions and educational achievement vary across subgroups. To examine whether the associations between suspensions and achievement vary across subgroups, I include interactions between suspensions and each subgroup (i.e., race/ethnicity, FRL, ELL, special education). These models indicate the extent to which the associations between suspensions and achievement are stronger or weaker when individuals belong to a certain group.
Results
To evaluate the extent to which suspensions are linked with educational achievement of suspended students, I examine the longitudinal associations between the number of suspensions in a given quarter and educational achievement at the end of the quarter. Table 4 shows the results from regression models both with and without student fixed effects. The key variables for Models 1 through 4 are the number of suspensions as continuous variables. Models 1 and 2 compare educational achievement between students who received suspensions with different students who did not receive suspensions, whereas Models 3 and 4 compare educational achievement for a given student across quarters with varying numbers of suspensions. Unlike Models 1 and 2, Models 3 and 4—which include student fixed effects—use variations within students. Therefore, Models 3 and 4 do not generate the coefficient for time-invariant variables including gender and race/ethnicity.
Summary of Results From Regression of Suspension on the Educational Achievement of Suspended Students by Frequency With and Without Student Fixed Effects
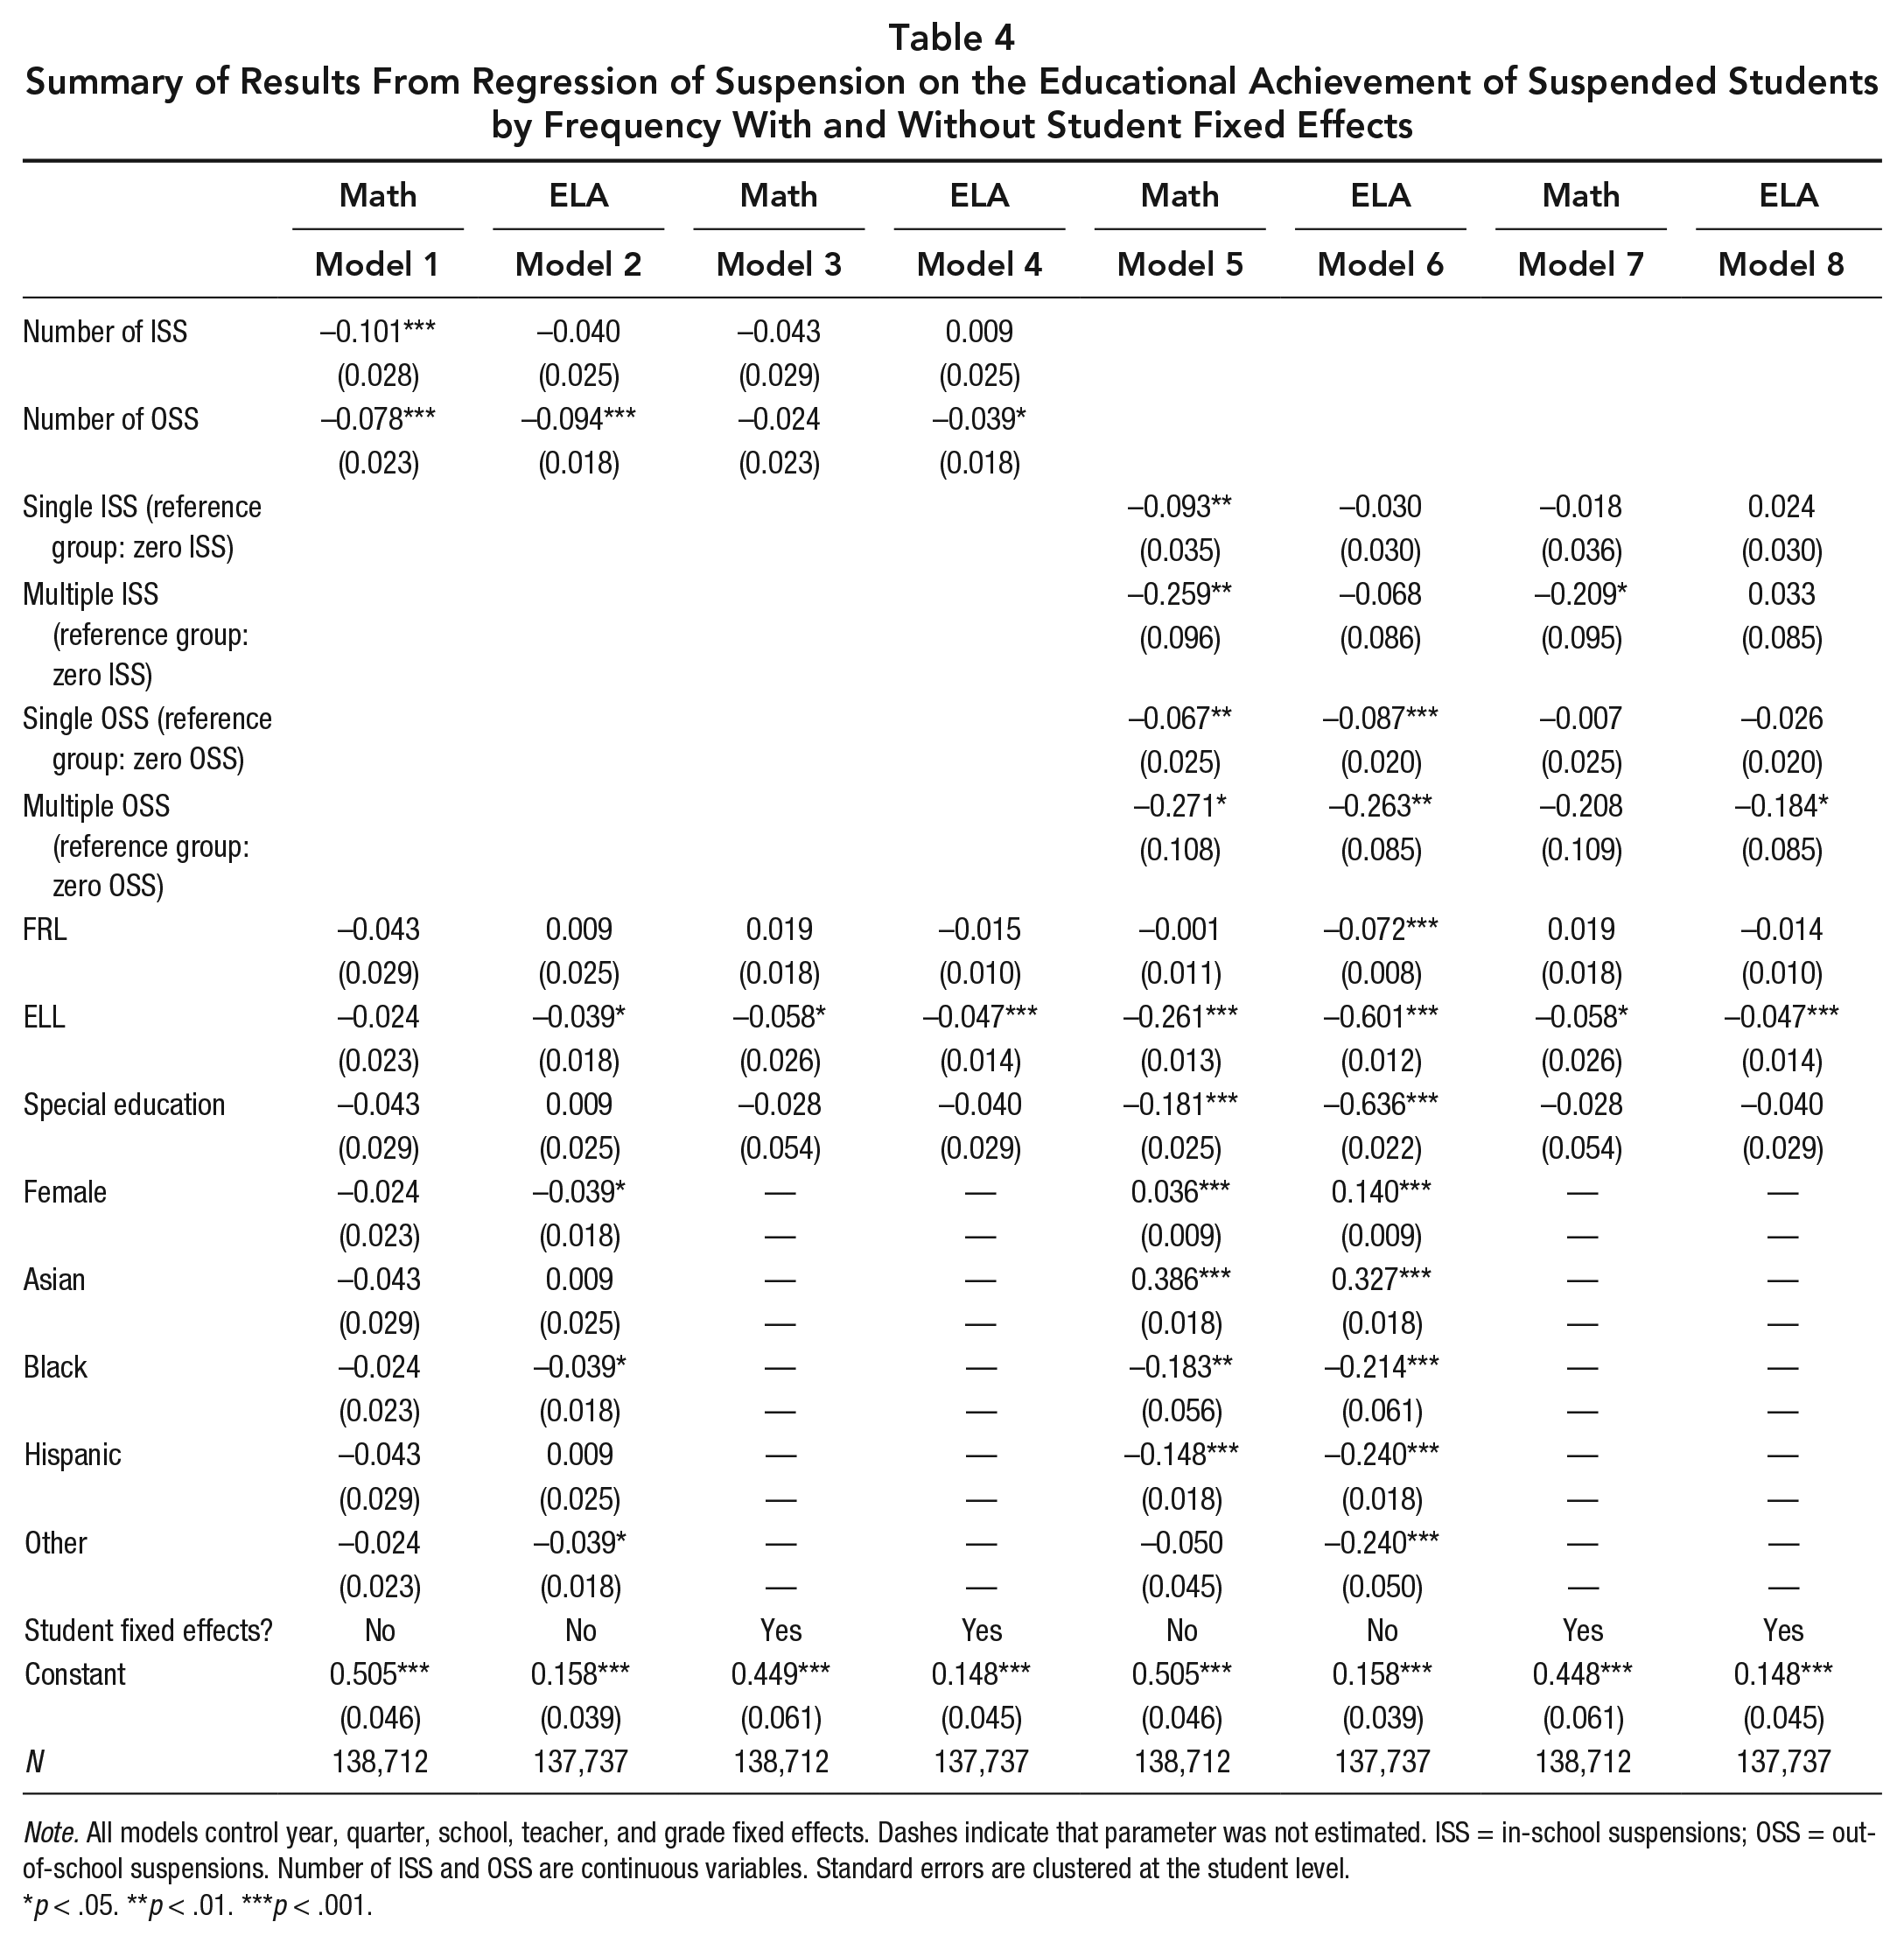
Note. All models control year, quarter, school, teacher, and grade fixed effects. Dashes indicate that parameter was not estimated. ISS = in-school suspensions; OSS = out-of-school suspensions. Number of ISS and OSS are continuous variables. Standard errors are clustered at the student level.
p < .05. **p < .01. ***p < .001.
Model 1 shows that in-school suspensions are associated with a .10 SD decrease and out-of-school suspensions are associated with a .08 SD decrease in math achievement after controlling for year, quarter, school, teacher, and grade fixed effects as well as demographic characteristics. Model 2 shows that in-school suspensions are not significantly associated with ELA achievement, but out-of-school suspensions are associated with a .10 SD decrease in ELA achievement. Model 3 shows that both in- and out-of-school suspensions are not associated with math achievement after controlling for student fixed effects and other controls. Model 4 shows that even after controlling for student fixed effects, out-of-school suspension is associated with a .04 SD decrease in ELA achievement. The results from Models 3 and 4 suggest that controlling for differences between students yields smaller associations between suspensions and student achievement.
In Models 5 through 8, I include two dummy variables that indicate whether the number of suspensions is single or multiple in a quarter. Models 5 and 6 show multiple suspensions are associated with more negative student achievement than single suspensions. For example, students who received single in-school suspensions exhibit .09 SD lower math achievement, whereas students who received multiple in-school suspensions exhibit .26 SD lower ELA achievement. While Models 5 and 6 compare educational achievement between students, Models 7 and 8 with student fixed effects allow me to compare student achievement in quarters with single suspensions or multiple suspensions in quarters with no suspensions for a given student. After controlling for student fixed effects and other controls, single suspensions are not associated with math and ELA achievement, but multiple suspensions are still associated with a decrease in educational achievement. Multiple in-school suspensions are associated with a .21 SD decrease in math achievement, and multiple out-of-school suspensions are associated with a .18 SD decrease in ELA achievement. The results show that the associations between suspensions and educational outcomes vary by type and frequency. In addition, models with student fixed effects show smaller associations between suspensions and educational achievement than models without student fixed effects. Figure 1 shows the varying associations between suspensions and achievement by type and frequency based on the results from Table 4.

Varying links between suspensions and educational achievement by types and frequency without and with student fixed effects.
Next, to examine the extent to which the associations between suspensions and student achievement vary across subgroups, I include interactions between suspensions and each subgroup, including race/ethnicity, FRL, ELL, and special education status in the models. Models 1 and 8 in Table 5 show that associations between suspensions and student achievement are stronger for certain groups of students. Models 1 and 2 show that the associations between suspensions and achievement vary across racial/ethnicity groups. The results show that the interaction term between multiple out-of-school suspensions and other race/ethnicity is positively significant. Given that the number of other race/ethnicity students in the sample is very small, these unexpected findings need extra caution. When it comes to ELA achievement, the results show that negative associations between suspensions and ELA achievement are stronger for Asian and Hispanic students. No Black and other racial/ethnic groups receive multiple in-school suspensions within a quarter, in part because the sample of this study has a small number of Black and other racial/ethnic groups (i.e., less than 1%). Thus, the analyses do not produce estimated parameters for interactions between Black students and multiple in-school suspensions and between other race/ethnic group and multiple in-school suspensions.
The Varying Associations Between Suspensions and Educational Achievement Across Subgroups With Student Fixed Effects
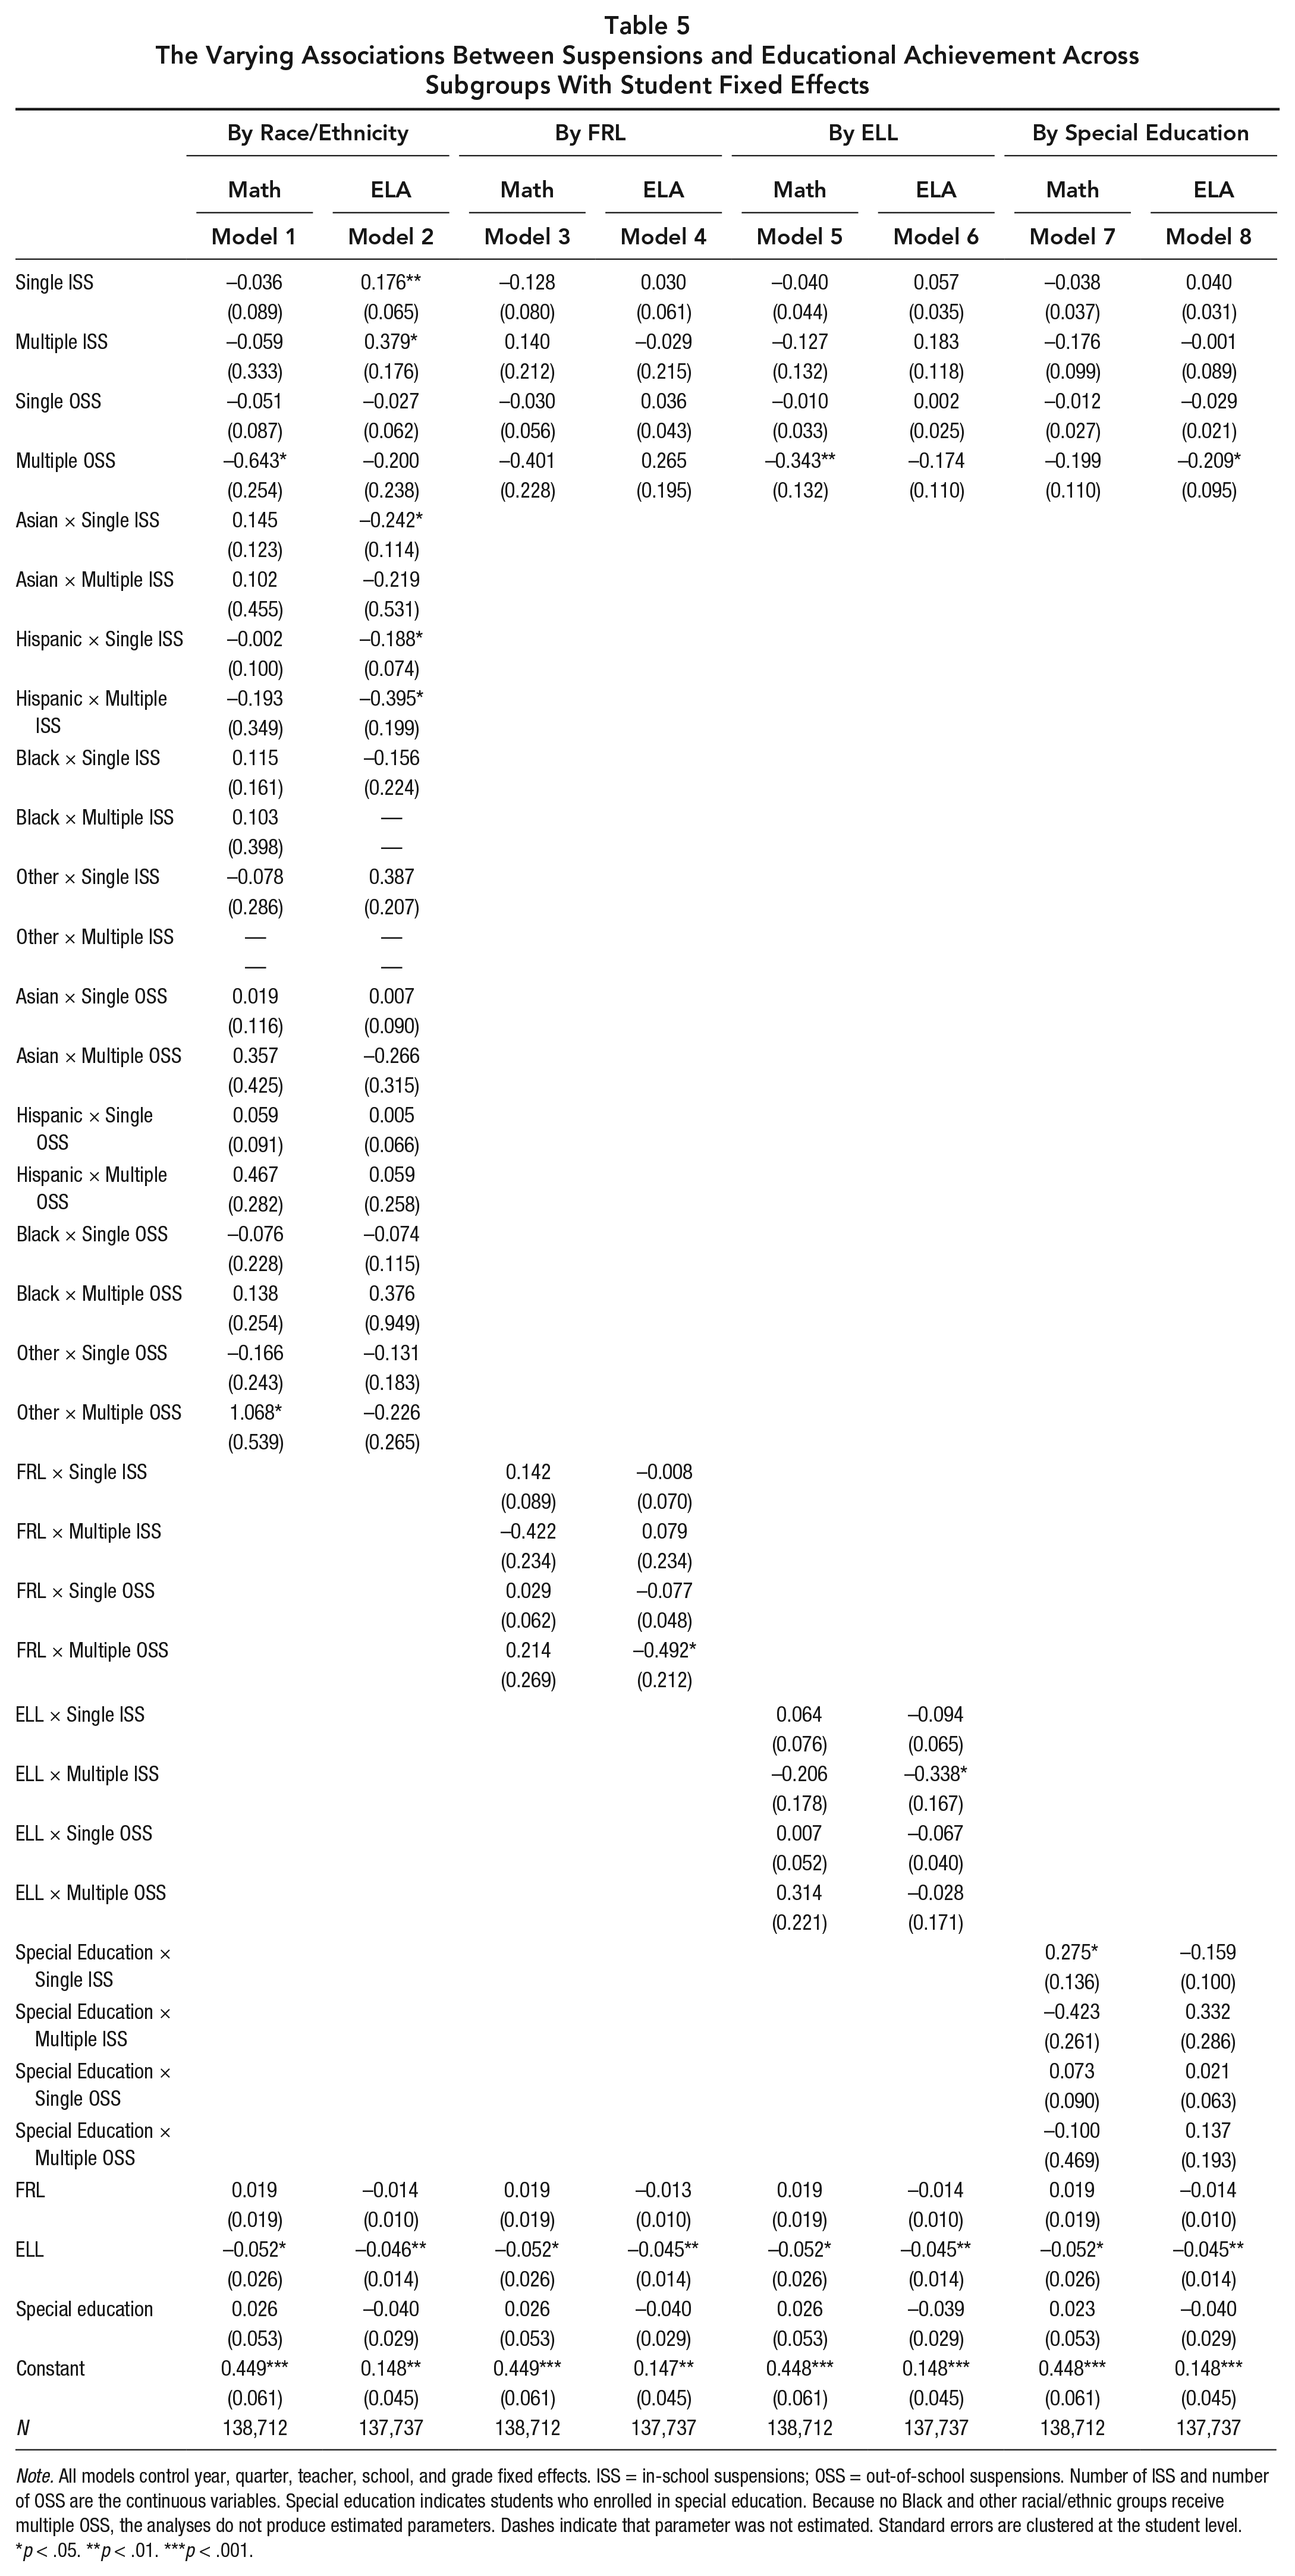
Note. All models control year, quarter, teacher, school, and grade fixed effects. ISS = in-school suspensions; OSS = out-of-school suspensions. Number of ISS and number of OSS are the continuous variables. Special education indicates students who enrolled in special education. Because no Black and other racial/ethnic groups receive multiple OSS, the analyses do not produce estimated parameters. Dashes indicate that parameter was not estimated. Standard errors are clustered at the student level. *p < .05.
p < .01. ***p < .001.
Model 3 shows that the associations between suspensions and math achievement do not vary by FRL status, but Model 4 shows that the associations between multiple out-of-school suspensions and lower ELA achievement are stronger for students who are eligible for FRL. Similarly, Model 5 shows that the associations between suspensions and math achievement do not vary by ELL status, but Model 6 shows that the associations between multiple in-school suspensions and ELA achievement are stronger for ELL students. Model 7 shows that single in-school suspensions are associated with positive math achievement for students who receive special education services. Finally, Model 8 shows that the associations between suspensions and ELA achievement do not vary by whether students received special education services or not.
I also conduct a falsification test as a robustness check to examine whether there are potential reverse causations that threaten the estimations. In this analysis, I examine whether the future suspensions predict prior educational achievement. That is, I run models that test whether suspensions in Quarters 4, 3, and 2 predict educational achievement in Quarters 3, 2 and 1, respectively. The results show that there are no associations between future suspensions and prior achievement test scores (Appendix Table A1). Falsification analysis is imperfect as a method of validating causal links between suspension and achievement, but it provides a useful indication of the degree to which that relationship may either exist or be entirely spurious.
Discussion
This study advances our understanding of the associations between receiving suspensions and short-term future educational achievement by showing the models with and without controlling for student differences. When I compare educational achievement between students, multiple out-of-school suspensions are associated with a .26 SD decrease in ELA achievement. Because unobservable differences between students can yield biased estimations, I also compare educational achievement for a given student across quarters with varying numbers of suspensions. After controlling for student fixed effects, multiple out-of-school suspensions are associated with a .18 SD decrease in ELA achievement. The differences in magnitude of the estimations on achievement with and without fixed effects imply that estimations without student fixed effects can overestimate the effect sizes. Indeed, a meta-analyses study that summarizes prior research shows that receiving out-of-school suspension is correlated with a .24 SD decrease in achievement (Noltemeyer et al., 2015), which is comparable to the estimation from the model without student fixed effects in this study. As such, my results suggest that the effects of suspension on student achievement, especially a single suspension effect, are smaller than some have argued.
Although the magnitude is reduced in models with student fixed effects, my finding is consistent with prior studies that show links between suspensions and undesirable educational outcomes (Arcia, 2006; Morris & Perry, 2016; Noltemeyer et al., 2015). The loss of learning opportunities for suspended students may explain a great deal about the negative associations between suspensions and lower educational achievement. Barred from school, these students are less likely to spend time in a learning environment of any sort, which may negatively affect their educational outcomes (Arcia, 2006; Christle et al., 2007; Lee et al., 2011). In addition, considering that low levels of school engagement predict high dropout rates (Archambault et al., 2009) and initiation of delinquent behavior (Dornbusch et al., 2001), school removal may encourage negative student development.
Given that suspension rates are higher for students from vulnerable populations (e.g., poor and racial/ethnic minority students), these findings heighten concern regarding the consequences of exclusionary discipline practices. Like numerous studies (Arcia, 2006; Morrison & D’Incau, 1997; Stevens et al., 2015), my study finds that racial minorities, students from low-income families, students with lower achievement levels, and students who are enrolled in special education have a higher risk of receiving suspensions. Considering that suspended students lose instruction time and a majority of suspended students are from vulnerable populations, the concern that suspensions may exacerbate the achievement gap is warranted. Students who receive suspensions are labeled as “frequent flyers” (Greene, 2009) or “bad kids” (Collins, 2011). Thus, multiple suspensions may further damage the positive development of students from vulnerable populations.
The results of this study, which demonstrate the associations between suspensions and lower educational outcomes, deepen concerns about the negative effects of suspensions for suspended students. Nevertheless, we still have little knowledge about the optimal ways to deal with students who engage in challenging behavior (Steinberg & Lacoe, 2017b). Safe and orderly school environments are prerequisites for student success, but school removal likely not only fails to deter student misbehavior but likely also damages student learning. Meanwhile, some school districts have recently revised discipline codes to reduce suspension rates (Steinberg & Lacoe, 2017b), but these efforts at discipline reform—which reduce the incidence of suspension without addressing the underlying behavioral challenges—have unfortunately been linked with increased school chaos and disorder in some instances (Eden, 2017; Steinberg & Lacoe, 2017a). Ultimately, any attempt to both reduce suspension rates and create stable learning environments must effectively address the challenges posed by disruptive student behavior.
The results of this study deepen our understanding of the links between suspensions and educational achievement, yet this study has limitations. First, given that these data are from one district in California and educational achievement is measured by the district-specific benchmark test, future studies should test whether these findings are replicable in other contexts. In addition, suspension rates in this district are lower than the national average suspension rates (especially in-school suspensions) and the links between suspension and educational outcomes may vary by prevalence of suspension.
Second, while I find the varying links between suspensions and educational achievement, my findings nevertheless call for further future investigations. A few unexpected and mixed findings—that suspensions are positively associated with achievement for some groups, including White and other race/ethnic students and students who receive special education—require cautious interpretations. Given that suspensions may initiate parental involvement, which have positive effects on student achievement in some cases, future replication studies are needed.
Third, because this study focuses on student achievement across quarters, it is not able to estimate the associations between suspensions and cumulative and long-term youth outcomes. Given that receiving suspension is linked to predominately negative outcomes, including a higher likelihood of school dropout (Christle et al., 2004; Lee et al., 2011) and arrest (Monahan et al., 2014), exploring the cumulative and longer term impacts of receiving suspensions is critical.
Fourth, these results show that the links vary across groups, but this study was not able to examine the mechanisms that account for these results. “In-school suspension” is defined as the exclusion of a student from regular classroom activities, with permission to be on school grounds in this district. In practice, in-school suspensions can mean staying in a principal’s office, studying in the designated in-school suspension classroom, or receiving behavioral interventions. Considering that suspension effects can vary across certain forms of in-school suspensions, future studies should further investigate the varying effects across practices of in-school suspensions as well as across groups.
Finally, because student fixed effects are not able to control for time-variant differences between quarters (e.g., changes in home environments and changes in student behavior), the results of analyses are not able to completely isolate causal effects from other unmeasured endogenous factors. The associations between suspension and negative educational achievement can also be explained by student behavior that results in suspension, rather than by the suspension itself. For instance, perhaps students received a suspension for fighting. Apart from the suspension, fighting itself—and the behavioral characteristics that lead to it—may be a cause of lower achievement levels. Student fixed effects do not allow me to control for a time-variant variable, so it is possible that lower educational outcomes are not caused by suspensions but are caused by changes in student behavior.
With these caveats in mind, this study nevertheless provides better evidence on the links between receiving suspensions and educational achievement. The results show that multiple suspensions are associated with lower levels of achievement. In addition, I find that these associations are stronger for students from vulnerable populations who have a higher risk of suspensions. The goal of disciplinary responses should be to deter future student misbehavior while still engaging that student in the learning process. Isolating students from school is unlikely to correct misbehavior and is likely to hamper student-teacher relationships and school bonding. Ultimately, this loss of instruction time may push students further away from schools, leading to irreversibly negative consequences.
Footnotes
Appendix
Falsification Test: Summary of Results From OLS Regression of Suspension (None vs. Once, None vs. More Than Once) on the Educational Achievement of Suspended Students in the Previous Quarter, With Student Fixed Effects

| Math | ELA | |
|---|---|---|
| ISS (reference group: no suspension) | ||
| Single ISS | −0.031 | −0.064 |
| (0.042) | (0.034) | |
| Multiple ISS | 0.029 | −0.075 |
| (0.115) | (0.103) | |
| OSS (reference group: no suspension) | ||
| Single OSS | −0.024 | 0.008 |
| (0.027) | (0.024) | |
| Multiple OSS | −0.096 | 0.008 |
| (0.097) | (0.080) | |
| FRL | 0.021 | −0.026* |
| (0.021) | (0.011) | |
| ELL | −0.072* | −0.067*** |
| (0.029) | (0.016) | |
| Special education | 0.023 | −0.102** |
| (0.059) | (0.033) | |
| Constant | 0.142** | 0.278*** |
| (0.048) | (0.027) | |
| N | 106,562 | 98,602 |
Note. All models control for year, quarter, grade, school, student, and teacher fixed effects. ISS = in-school suspensions; OSS = out-of-school suspensions; FRL = eligibility for free or reduced-priced lunch; ELL = English language learner. Standard errors are clustered at the student level.
p < .05. **p < .01. ***p < .001.