
Abstract
This article evaluates the impact and cost-effectiveness of offering an innovative middle school model—the Sistema de Aprendizaje Tutorial (SAT)—to Honduran villages instead of traditional middle schools. We identified a matched sample of villages with either type of school and collected baseline data among primary school graduates eligible to enroll in middle schools. After 2 years, the test scores of children residing in SAT villages were 0.2 standard deviations higher than children in other villages, though the per-student cost in SATs was at least 10% lower than traditional schools. The article is one of the few studies to rigorously evaluate a scaled-up instructional reform in a poor country, implemented with an alternative model of teacher recruitment and contracting.
R
The most common model, the Centro de Educación Básica (CEB), reconfigures rural primary schools to offer Grades 7 to 9, but otherwise finances and manages them as public schools (Inter-American Development Bank [IDB], 2000). The government also supports the expansion of non-traditional schools operated by the private and public sectors, including the Sistema de Aprendizaje Tutorial (SAT; Umansky, Hernandez, Alas, & Moncada, 2007). The SAT model combines features of several popular education interventions in developing countries, including improved instructional materials and teacher training, flexible teacher contracts and an alternative teacher recruitment model, and decentralized school management by the Asociación Bayán, a non-governmental organization (NGO). Bayán recruits individuals from rural communities who do not necessarily have university or teaching credentials and provides 6 weeks of annual in-service training in the SAT curriculum and instructional methods, which emphasize close teacher–student interaction centered around textbook exercises. The government approved the SAT curriculum and pays teacher salaries, but Bayán retains much autonomy to hire, train, supervise, and occasionally dismiss teachers. Prior qualitative research suggests that SAT improves students’ sense of social responsibility (Honeyman, 2010) and the empowerment of female students (Murphy-Graham, 2012).
This article evaluates the impact on academic achievement of offering SATs to rural villages instead of CEBs. In identifying the causal impact, the fundamental challenge is to ensure that children who reside in SAT and CEB villages are similar, on average, but for their exposure to a particular school type. The best (though infeasible) means of doing so would have been to randomly assign a SAT or a CEB to a sample of rural villages without middle schools. 3 Instead, we identified villages that already had either a SAT or a CEB. The natural concern is that school location decisions are correlated with variables that are also correlated with school outcomes. To avoid biases introduced by endogenous program placement, we gathered variables that are correlated with official placement criteria and student outcomes, and then identified a matched sample of observably similar villages with either a SAT or a CEB.
At the end of the 2008 school year, we collected baseline achievement data among graduating sixth graders in the matched sample of villages (i.e., students who are newly eligible to enroll in a middle school grade). At baseline, sixth-grade students in SAT and CEB villages were similar along a wide range of household and individual variables, including test scores. We interpret this falsification test as strong evidence of the internal validity of the quasi-experiment, particularly because these variables were unavailable when the original matching exercise was conducted (Rubin, 2008). The same students were revisited in 2009 and 2010, regardless of whether they actually enrolled in a middle school grade.
After 2 years, baseline children who reside in SAT villages are similarly likely to enroll in school, relative to children in CEB villages. However, they have test scores that are 0.2 standard deviations higher, on average, than children living in CEB villages, a substantial 45% increase in the rate of learning. These estimates—akin to intention-to-treat effects—are difficult to explain unless SATs and CEBs in the respective villages are differentially effective. As evidence of this, we show that average treatment effects across all children in the villages are larger among children from relatively wealthier families (who are more likely to enroll in any type of school). Effects are also larger at higher quantiles of the conditional distribution of follow-up test scores in the full sample of children residing in the villages.
Using principal and teacher survey data, we assess several plausible explanations for the differential effectiveness of SATs and CEBs. 4 SATs have more instructional materials than CEBs, and SAT teachers have received more in-service training that was aligned with those materials. SATs also lost fewer instructional days than CEBs, especially during periods of political unrest and teacher strikes. Given interviews with NGO personnel, we interpret this as evidence that flexible teacher contracts provide an effective mechanism for increasing the amount of instructional time during all-too-common periods of upheaval. We find only small differences in class size across SATs and CEBs, and no differences in average peer ability—as proxied by mean baseline test scores of enrolled students—ruling out either as the main explanation for the measured effects. Finally, we find that per-student costs are at least 10% lower in SATs, suggesting that SATs are a cost-effective alternative for middle school expansion in rural areas.
The article makes two contributions to the growing literature on school improvement in poor countries, which is reviewed more extensively in the next section (Kremer, Brannen, & Glennerster, 2013; McEwan, 2013). First, it evaluates the impact of a new instructional model combined with an incentive-based mechanism—more flexible teacher contracts—to improve its implementation. Recent experiments suggest that instructional improvements in public schools—relying on both teacher training and instructional materials—can improve achievement (e.g., Lucas, McEwan, Ngware, & Oketch, 2013; Friedman, Gerard, & Ralaingita, 2010), but that implementation faces hurdles because of mis-aligned incentives of public schoolteachers (A. Banerjee, Banerji, Duflo, & Walton, 2012). Related research shows that alternative teacher recruitment and flexible contracts can increase test scores when combined with class size reduction (Bold, Mwangi, Mwabu, Ng’ang’a, & Sandefur, 2012; Duflo, Dupas, & Kremer, 2012; Muralidharan & Sundararaman, 2010). However, most evaluations of incentive-based interventions such as contract teachers and teacher performance pay do not focus on improving the relevance or quality of classroom instruction, unless done so as a by-product of modified teacher incentives. This article’s evaluation of the SAT model is one of the few that rigorously examines a “whole-school” reform of instruction—specifically designed to increase teachers’ capacity to deliver effective instruction—implemented with an alternative model of teacher recruitment and contracting.
Second, the article bridges the gap between the emerging use of school-based experiments in poor countries and a larger non-experimental literature on school reforms that continues to inform policy decisions in Ministries of Education and international organizations. The former category of studies has high internal validity, but is often focused on smaller scale pilot programs that are add-ons to traditional public schools (McEwan, 2013). The latter category has weaker internal validity, as discussed in the literature review, but examines scaled-up reforms to school management and finance, such as parent-managed schools in rural communities of Central America, and privately run “charter” schools in Chile (di Gropello & Marshall, 2005; McEwan & Carnoy, 2000).
In Honduras, the SAT model has already expanded to multiple departments within Honduras, and its effects are the subject of considerable interest in the Secretaría de Educación, international organizations, and other countries where SAT is already or might be implemented, including its Colombian birthplace (IDB, 2004; Murphy-Graham, 2012). Although a randomized experiment was not feasible in this instance, we suggest that a well-designed quasi-experiment, building in design elements such as strong falsification tests (Rubin, 2008), strikes a credible and policy-relevant balance between internal and external validity.
School Improvement in Poor Countries
A growing literature identifies the causal impact of school-based treatments on student learning in poor countries (Kremer et al., 2013; McEwan, 2013). Treatments can be roughly divided into (a) interventions that directly improve the quantity or quality of instruction, and (b) interventions that modify the incentives of school personnel to do so. Early experiments in the first category showed that simply delivering textbooks and flipcharts did not improve government exam scores in Kenya (Glewwe, Kremer, & Moulin, 2009; Glewwe, Kremer, Moulin, & Zitzewitz, 2004). Block grants to primary schools, unaccompanied by other interventions, had no effects on achievement in Gambia and Indonesia, and less than 0.1 standard deviations in India (Blimpo & Evans, 2011; Das et al., 2013; Pradhan et al., 2011).
The evidence is more encouraging when interventions combine instructional materials with well-aligned efforts to improve teacher capacity. An early Nicaraguan experiment found that the delivery of math textbooks—accompanied by training in their use—increased scores by 0.4 standard deviations (Jamison, Searle, Galda, & Heyneman, 1981). Recent experiments in India, Liberia, Mali, and Uganda found effects of at least 0.2 standard deviations on early grade literacy assessments when public schoolteachers received instructional materials and training in the delivery of structured reading lessons (Friedman et al., 2010; He, Linden, & MacLeod, 2008; Lucas et al., 2013; Piper & Korda, 2011). However, A. Banerjee et al. (2012) found that instructional interventions faced hurdles to implementation in Indian public schools, perhaps because of weak incentives among public schoolteachers. This result suggests that improved teacher capacity might be a necessary but not sufficient condition for improving learning in some settings.
The second category of interventions modifies incentives of school personnel to improve learning, via flexible contracts and/or school-based management. 5 Despite lower salaries, contract teacher programs administered by NGOs improved test scores in several experiments, though effects of contract status cannot be easily separated from large reductions in class size that accompanied the interventions (Bold et al., 2012; Duflo, Dupas, & Kremer, 2012; Muralidharan & Sundararaman, 2010). Several studies find that intensive tutoring of low-achieving primary students by locally hired community tutors—in addition to regular instruction by public schoolteachers—improved tests scores by at least 0.2 standard deviations in Chile and India (A. Banerjee et al., 2012; A. V. Banerjee, Cole, Duflo, & Linden, 2007; Chay, McEwan, & Urquiola, 2005).
Teacher contract interventions are sometimes accompanied by school-based management, in which decisions about school resource allocation and operations are devolved to parent committees or NGOs (Barrera-Osorio, Fasih, Patrinos, & Santibáñez, 2009; Duflo, Dupas, & Kremer, 2012). Throughout Central America, parent associations have been given authority to hire and pay teachers—mainly in rural primary schools—although the causal effects of these reforms on student test scores are uncertain. 6 Chile’s well-known reforms gave public subsidies to privately run “charter” schools, as well as the authority to hire and dismiss school personnel. There is no experimental evidence on their effects, although non-experimental studies generally find zero to small effects on test scores (see Lara, Mizala, & Repetto, 2011; McEwan & Carnoy, 2000, and the citations therein).
Two Models for Rural Middle Schools
The SAT
The Honduran SAT model combines features of interventions discussed in the last section, including improved instructional materials and teacher training; flexible teacher contracts and an alternative teacher recruitment model; and autonomous management by an NGO, the Asociación Bayán. Students enroll in SATs in the seventh grade, completing successive grades with the same teacher until Grade 12. SATs enroll most of their students from a village primary school, although they may also enroll students from outlying rural schools. At least one class opens each year or every 2 years, if no more than 20 students register in a given year. SATs primarily use borrowed space in local primary schools—if the school has a single morning or afternoon shift—or community-provided facilities such as a church building.
The SAT curriculum is organized in five areas that include language and communication, mathematics, science, technology, and community service. It is contained in 10 texts per grade between Grades 7 and 12. The textbooks emphasize rural and agricultural topics, and require students to develop community projects (e.g., teaching literacy classes or planting crops). Students purchase each textbook for 60 Lempiras (about US$3), and use them as workbooks to complete assigned exercises (for examples of SAT lessons and detail on the curriculum, see Murphy-Graham, 2012). In the typical SAT classroom, students read aloud and discuss textbook lessons with the teacher and then work individually and in small groups to complete written exercises.
In 2003, the Honduran government accredited SAT as an official middle and secondary school program, and agreed to pay the salaries of SAT teachers and field supervisors. To hire teachers—referred to within the program as “tutors”—Bayán advertises in rural communities and screens candidates with an intake interview and competency exam. New teachers, who must have completed secondary school, participate in 2-week in-service training courses that precede each trimester of the academic year. Teachers are public contract employees, or interinos. The temporary status provides more discretion in teacher hiring and dismissal than if teachers were “tenured” civil servants. Teachers receive ongoing monitoring and instructional support from a network of field supervisors, each of whom is responsible for about 10 SATs within a defined geographic area. Field supervisors function as the de facto principals of SATs.
The CEB
Since 1996, the government’s main strategy for expanding middle school access has been the CEB, essentially a converted rural primary school (IDB, 1997, 2000). CEBs employ at least two additional teachers who teach at least two subjects each, guided by a curriculum that identifies standards for traditional subject areas such as mathematics, Spanish, social sciences, and natural sciences (Secretaría de Educación, 2003b). Classrooms of students rotate among teachers, depending on the subjects and grades. In the late 1990s, the earliest CEB conversions had shortages of instructional materials and deficient infrastructure, although subsequent loans from the IDB financed classroom construction in converted schools, textbook and library distribution, and teacher in-service training (IDB, 2000, 2004).
Like SATs, CEBs may hire contract teachers, although the hiring occurs entirely through local offices of the Secretaría de Educación in each department. Unlike SATs, they also employ tenured civil servants with higher wages and substantial job security. CEBs are subject to regular inspections by Department education officials, but this is compliance-based and does not generally focus on improving classroom instruction.
Data and Method
Matched School Sample
In the ideal randomized experiment, one might (a) identify a sample of rural villages with no middle schools, (b) randomly assign a SAT or CEB to each village, and (c) follow sixth-grade graduates who are eligible to enroll in the newly available middle schools. While our study tracked a cohort of eligible sixth graders, it did so in a matched sample of “similar” villages that already had a local SAT or CEB.
The location of both school types is non-random but putatively based on official assignment criteria that include local primary enrollments (and potential demand for secondary grades), stakeholder support, and the local availability of other middle schools. 7 In the population of SATs (79) and CEBs (225) in five departments of Honduras, we identified the primary school that provides each SAT or CEB with the largest proportion of its students. In a SAT, this is the “feeder” primary school in which the SAT often holds its classes. A CEB’s sixth grade serves as a feeder for its own seventh grade. 8 We next identified 37 school- and village-level variables that were plausibly correlated with (a) the official assignment criteria and (b) student outcomes such as academic achievement (see the appendix for variable definitions and descriptive statistics). We obtained school-level variables, such as primary grade enrollment and repetition rates, from 2007 administrative data, the school year prior to the 2008 baseline. We obtained variables corresponding to the village (or aldea) of each school from the 2001 census, including wealth proxies and the stock of adult schooling.
To select a matched sample, we ordered 304 observations by decreasing values of the estimated propensity score (Imbens & Wooldridge, 2008), obtained from a logit regression of a SAT feeder school indicator variable on the variables in the appendix. The SAT feeder with the highest propensity score was matched without replacement to its nearest neighbor, imposing a caliper restriction of 0.1, which yielded a sample of 59 SAT feeders and 59 CEBs. 9 Twelve schools could not participate in the baseline data collection, mainly because of heavy rains and inaccessible roads in the northern departments of Atlántida and Colón. We dropped the 12 schools and their matches, leaving 47 intact pairs of 94 schools (see Figure 1).

SATs and CEBs in the matched school sample.
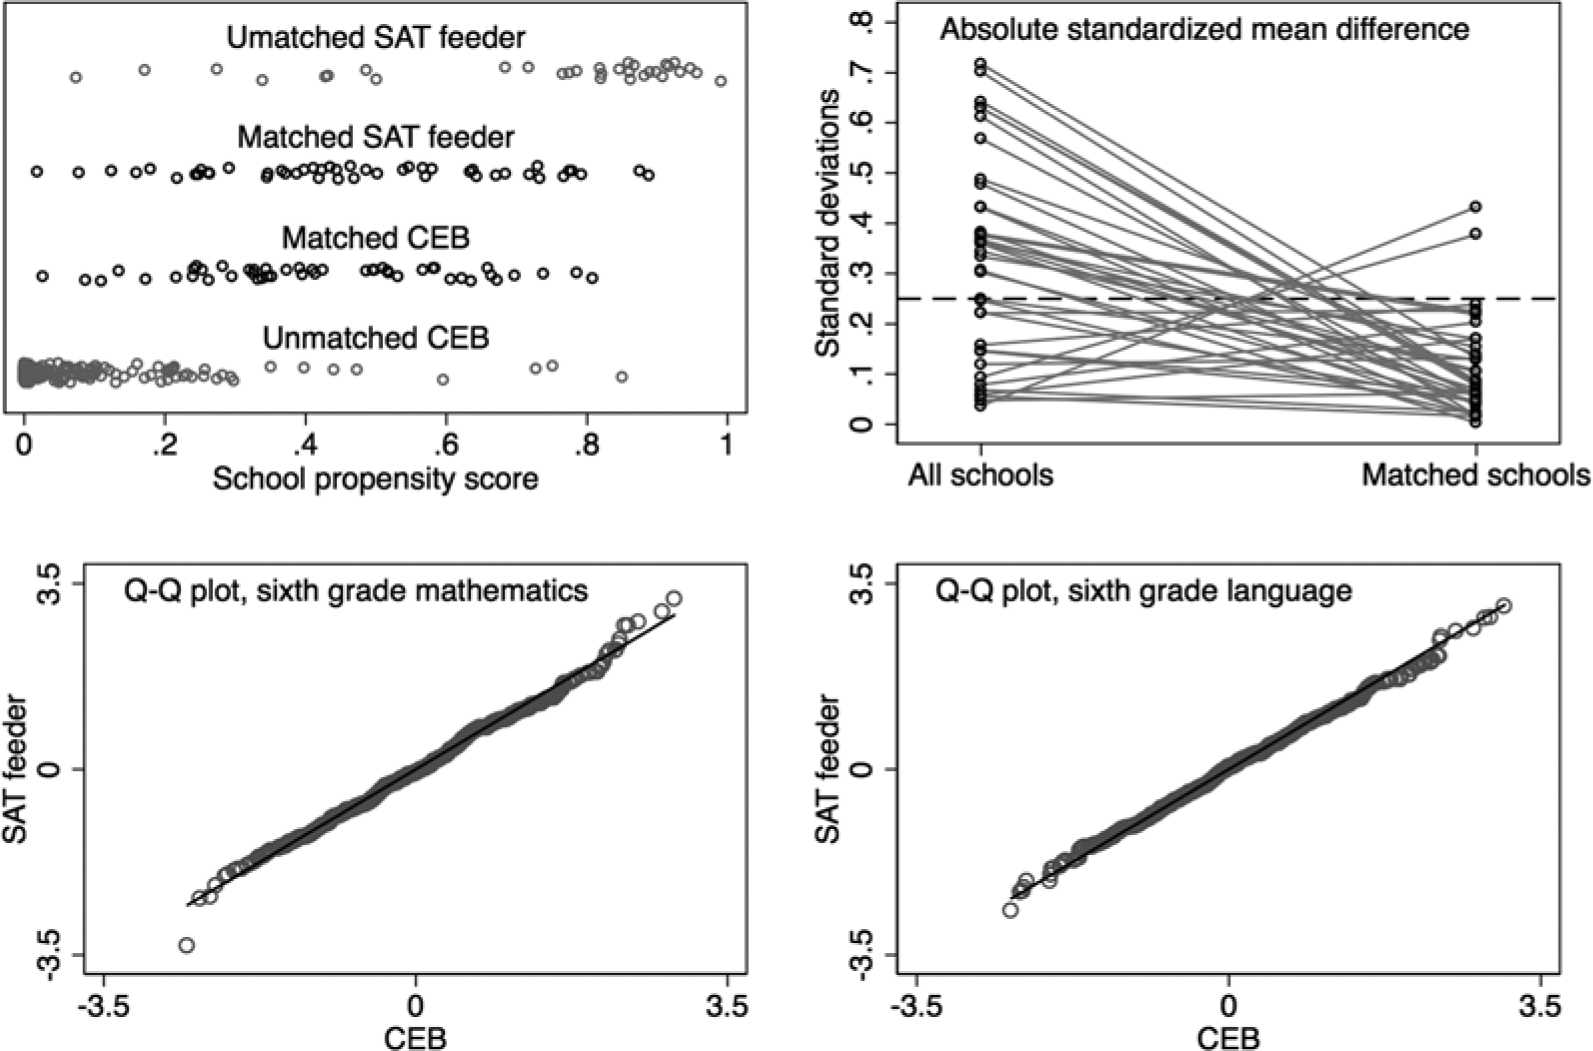
Figure 2 permits a visual assessment of balance in this matched school sample. In the upper-left panel, there is a considerable overlap in the estimated propensity scores of matched SAT feeder schools and CEBs (but not in unmatched schools). The upper-right panel shows that, prior to matching, there were large differences between SAT feeder schools and CEBs on the 37 variables (also see the appendix). The absolute value of mean differences exceeds 0.25 standard deviations for 24 variables, the threshold at which regression adjustment is especially sensitive to specification (Imbens & Wooldridge, 2008; Rubin, 2001; Stuart, 2010). After matching, only 2 of 37 differences exceed 0.25 standard deviations. 10
Balance in matched school sample and baseline student sample.
Student Baseline Data
We conducted baseline data collection in the matched school sample at the end of the 2008 school year, from October 27 to November 8. The 1,426 enrolled sixth graders—identified with schools’ administrative records—constituted the baseline student sample, even if they could not be located at the time of data collection. Students completed background questionnaires and achievement tests in mathematics and language; enumerators applied household surveys to parents or guardians; and principals and teachers completed background questionnaires. We revisited students during October 10 to 30, 2009, and October 10 to 19, 2010. In both follow-ups, we attempted to locate students in the SAT or CEB. If children had dropped out of school, or were absent on the testing day, enumerators located children in their homes and then applied tests and questionnaires.
Achievement Tests
We designed curriculum-based mathematics and language tests for the sixth-grade baseline and for each follow-up.
11
The follow-up tests included anchor items from prior years to facilitate test linking. For each subject-by-year test, we re-ordered items to create long forms A and B, used for testing in schools. We also designed a short form C in each subject, for use in follow-up testing when children could not be located in schools.
12
Upon locating a child in his or her household, the enumerator administered the student questionnaire and then randomly administered form C of either language or mathematics.
13
Regression analyses are weighted to account for this sampling. When using language scores as the dependent variable, for example, we weight observations by
We link tests to a common scale using one-parameter item response theory models, estimating separate models for language and mathematics tests. Each Rasch model is estimated concurrently in the pooled sample of test item data across years (Wright & Stone, 1979). We standardized the logit scale used in language and mathematics scores using the mean and standard deviation of the respective baseline test. Hence, all treatment effects can be interpreted as proportions of a standard deviation on the baseline test.
Other Dependent Variables
In addition to academic achievement, we measured child outcomes related to school enrollment and child labor supply. All students were enrolled in school at the sixth-grade baseline, but some dropped out before each follow-up. We measure enrollment as a dummy variable indicating, at the end of each school year, whether students are currently enrolled in a post-primary grade. We measured child labor supply during the week prior to the survey. Two dummy variables indicate whether children participated in (a) salaried or unsalaried work outside the home, including on family farms, and (b) unsalaried work inside the home on chores, including child care, cooking, or cleaning.
Independent Variables
The independent variables include baseline values of the dependent variables, as well as child and household variables defined in Table 1 (Panel A). 14 Child variables include gender, age, ethnicity, and whether the child has repeated a primary grade. Household variables include parental schooling, household size, and a variety of income and wealth proxies, such as whether a relative lives in the United States, the access of dwellings to public utilities, and an asset index that is the Z score of the first principal component of 10 household assets. Using latitudes and longitudes, we also calculate each household’s straight-line distance to (a) the local schooling option, whether SAT or CEB, and (b) a more distant high school, or Instituto. The distance variables proxy the ease of access and travel costs faced by sixth graders.
Student Variables in 2008, and Attrition in 2009 and 2010
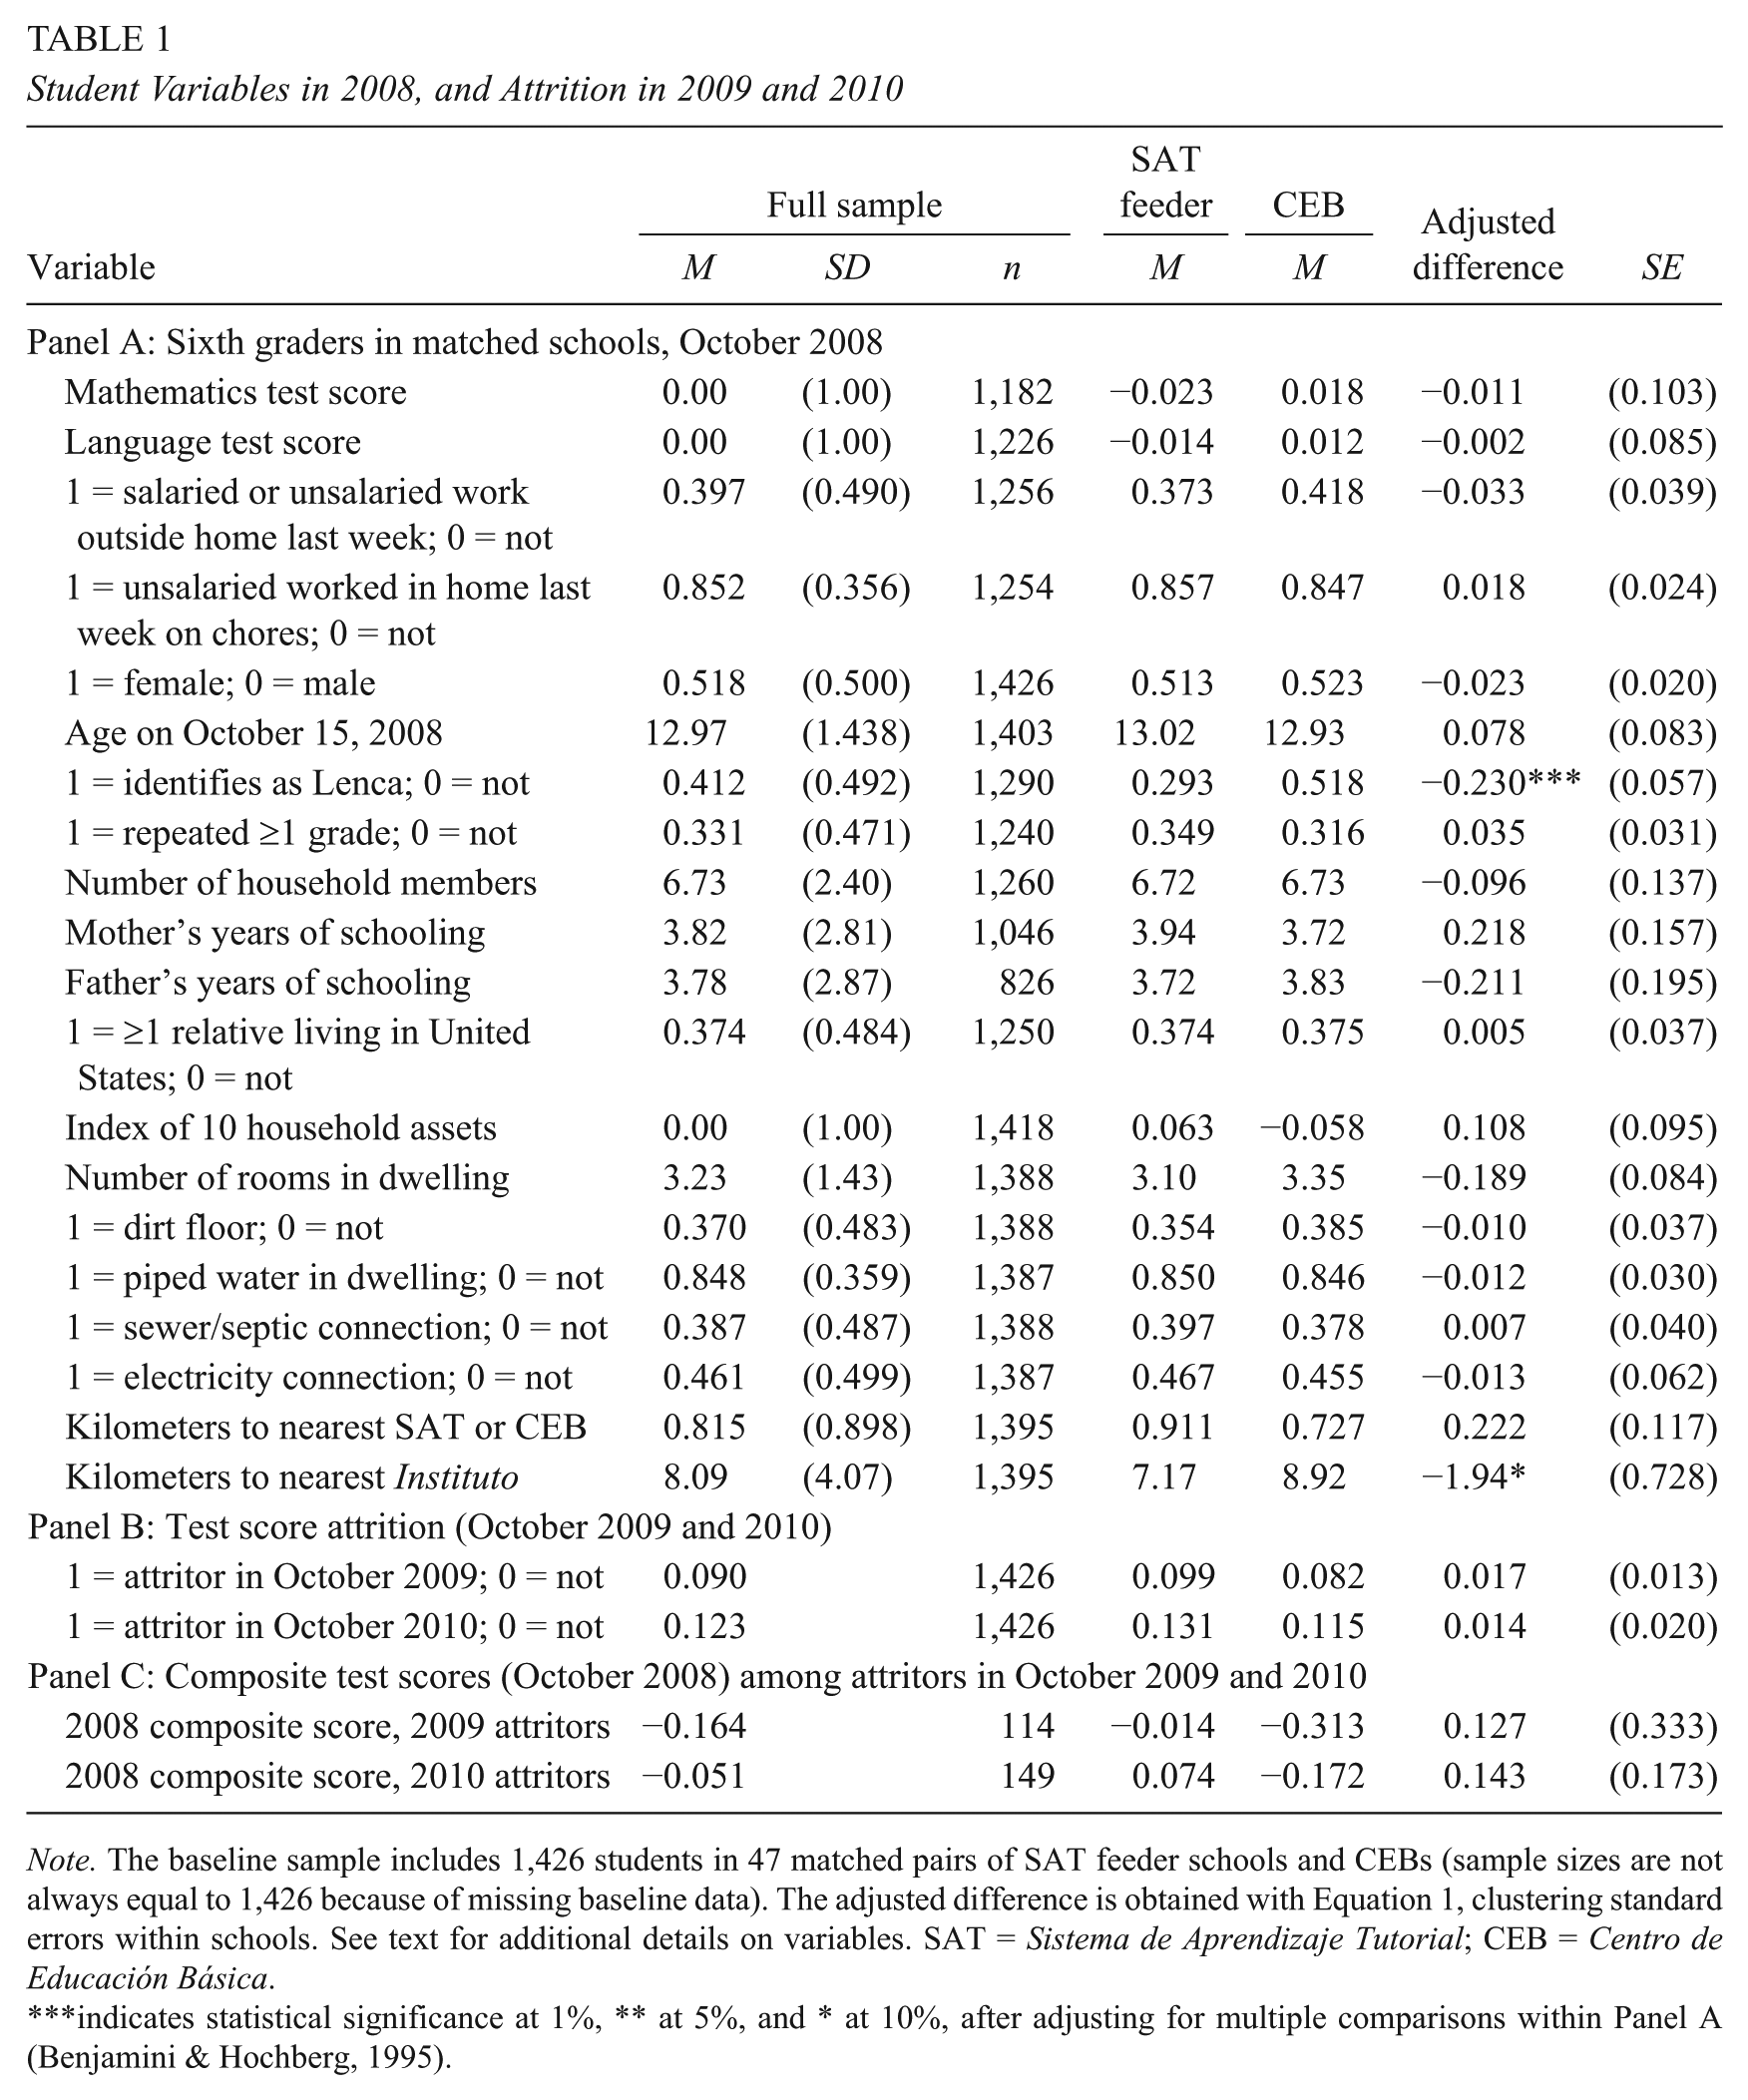
Note. The baseline sample includes 1,426 students in 47 matched pairs of SAT feeder schools and CEBs (sample sizes are not always equal to 1,426 because of missing baseline data). The adjusted difference is obtained with Equation 1, clustering standard errors within schools. See text for additional details on variables. SAT = Sistema de Aprendizaje Tutorial; CEB = Centro de Educación Básica.
indicates statistical significance at 1%, ** at 5%, and * at 10%, after adjusting for multiple comparisons within Panel A (Benjamini & Hochberg, 1995).
Estimation
Given the matched pairs of schools, we estimate the average treatment effect of residing in a SAT village as the average of within-pair differences in student outcomes:

where
We emphasize that the sample includes all children identified at baseline, regardless of their decision to enroll in or drop out of middle school. The inset map in Figure 1 illustrates this for a single SAT. The baseline sample includes 19 sixth graders in the co-located feeder school, and 5 dropped out of school by the first follow-up in 2009. Nonetheless, they are included in the sample used to estimate Equation 1. Thus,
We evaluate the credibility of this assumption by estimating the “effect” of residing in a SAT village on plausibly unaffected variables such as sixth-grade achievement (Imbens & Wooldridge, 2008). From a design perspective, it is notable that baseline data used to conduct these falsification tests—as well as final outcome data used to estimate treatment effects—were not available when the matched school sample was selected (Rubin, 2008). In addition, we estimate two variants of Equation 1. The first controls for the baseline variables in Panel A of Table 1, as well as dummy variables indicating Honduran departments. When an observation for an independent variable is missing, we code it to zero and control for an additional dummy variable that indicates missing values. 15
The second specification combinesregression adjustment with propensity score weighting (Imbens & Wooldridge, 2008; Robins & Rotnitzky, 1995). For each member of the baseline sample, we calculate
Results
Internal Validity
Balance at Baseline
Table 1 (Panel A) confirms that the baseline sample includes many sixth graders at risk of performing poorly in secondary grades or not enrolling. Forty percent of children already work outside the home, one third have repeated a primary grade, the average mother has not completed primary school, and many children live in substandard dwellings (e.g., 37% have a dirt floor, and less than half have electricity).
We assess the magnitude and statistical significance of baseline differences by estimating Equation 1, using each baseline variable as the dependent variable. The mean differences in mathematics and language scores are very small (1% of a standard deviation or less). 17 The quantile–quantile plots in Figure 2 show similar and overlapping achievement distributions in SAT feeder schools and CEBs, and Kolmogorov–Smirnov tests fail to reject the equality of distributions (p values for mathematics and language are 0.71 and 0.94, respectively).
Table 1 shows no statistically significant mean differences in other control variables, with two exceptions. First, children in SAT feeder schools and CEBs live similar distances from their village’s SAT or CEB. However, children in SAT feeders are 7.2 km from a traditional high school (or Instituto), compared with 8.9 in CEBs. Second, the probability that a child in a SAT feeder identifies herself as Lenca—an indigenous group concentrated in southwest Honduras and El Salvador—declines by 0.28 relative to CEBs. The difference is driven by geographic imbalance in the distribution of SATs and CEBs. 18 SATs tend to be more highly concentrated on the northern departments of Atlántida and Colón which are, not coincidentally, closer to the Bayán’s main office. But, as the overlapping baseline achievement distributions suggest, there are not large indigenous test score gaps as in the rest of Central America, in part because the mother tongue of Lenca children is Spanish (McEwan & Trowbridge, 2007).
In addition to student variables, we can compare baseline school and teacher variables in SAT feeder schools and CEBs. Table 2 (Panel A) shows that schools are similar in their sixth-grade class sizes and daily hours of instruction. Essentially all primary schools have a free meal program, although only two thirds of school principals (in both types of schools) report that most primary students have textbooks. 19 Less than 10% of teachers in either type of schools are contract teachers, and university degrees are uncommon among primary grade teachers. Finally, mean peer attributes of sixth graders are similar in both villages, as proxied by baseline composite test scores. Overall, Panel A reinforces evidence from the appendix that sixth graders in both types of villages are exposed to similar primary school environments.
School and Teacher Variables in 2008 and 2009–2010
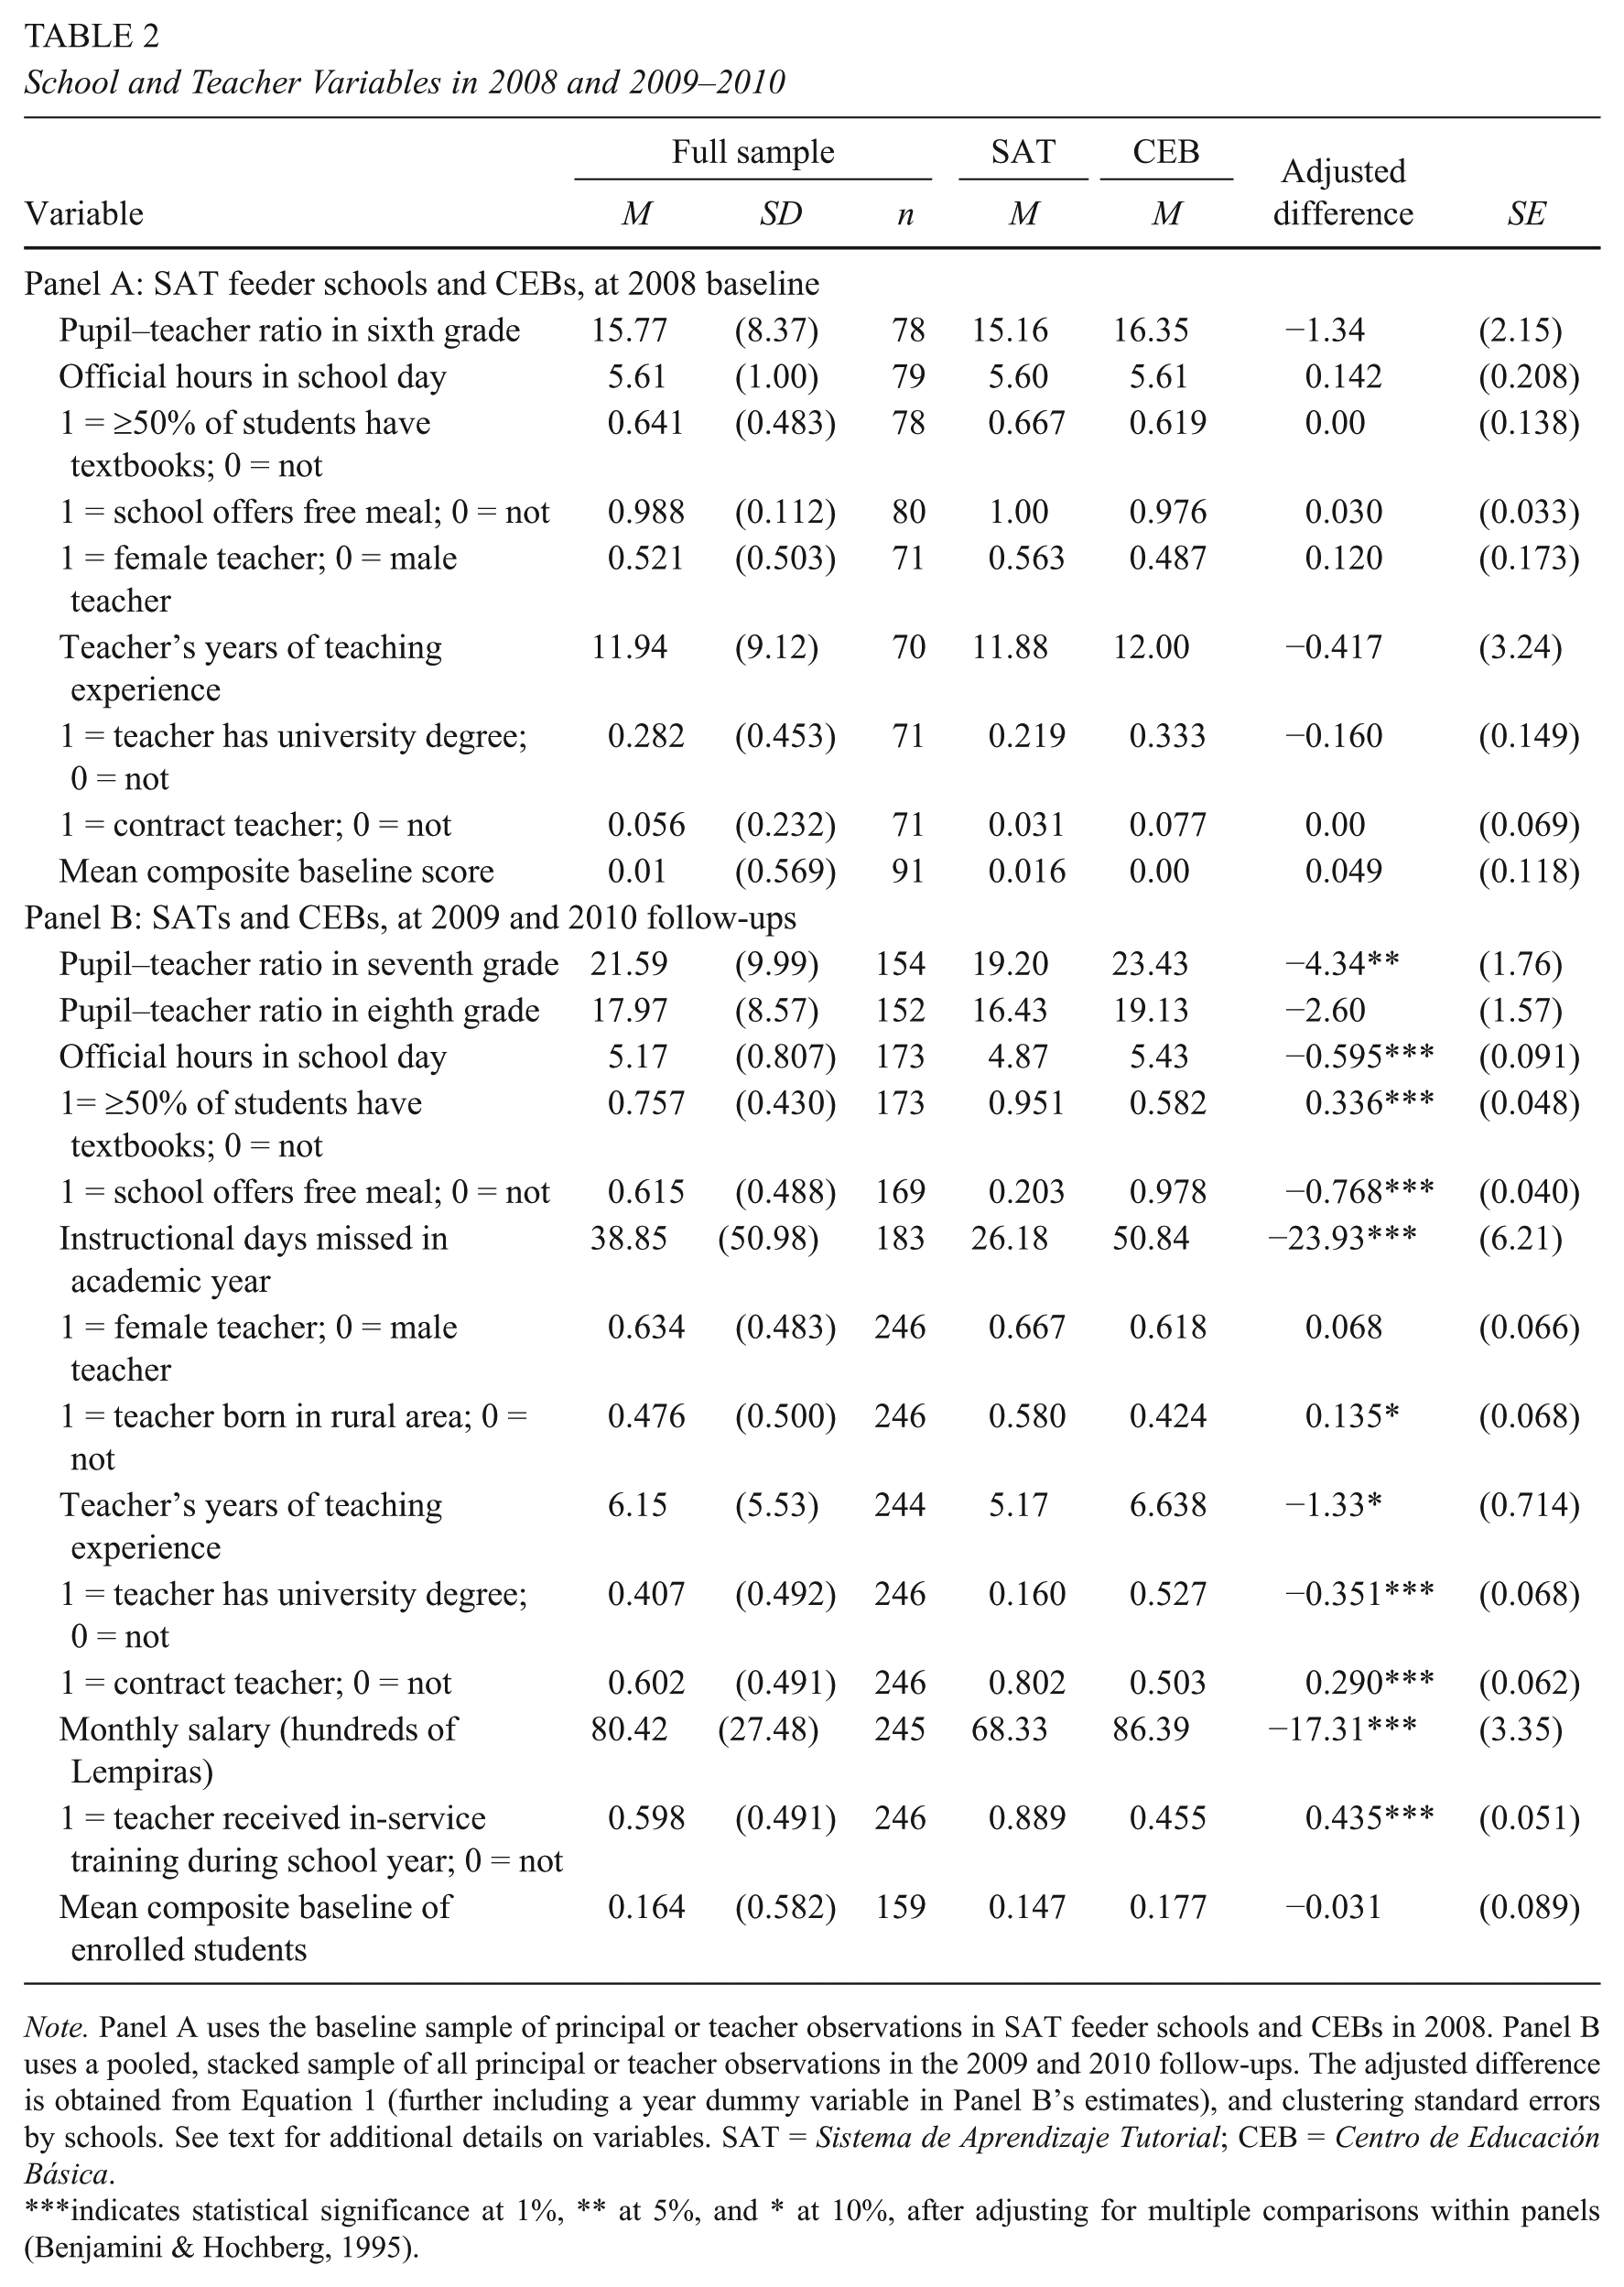
Note. Panel A uses the baseline sample of principal or teacher observations in SAT feeder schools and CEBs in 2008. Panel B uses a pooled, stacked sample of all principal or teacher observations in the 2009 and 2010 follow-ups. The adjusted difference is obtained from Equation 1 (further including a year dummy variable in Panel B’s estimates), and clustering standard errors by schools. See text for additional details on variables. SAT = Sistema de Aprendizaje Tutorial; CEB = Centro de Educación Básica.
indicates statistical significance at 1%, ** at 5%, and * at 10%, after adjusting for multiple comparisons within panels (Benjamini & Hochberg, 1995).
Student Attrition
In the 2009 and 2010 follow-ups, respectively, 9% and 12% of students did not report at least one test score (Table 1, Panel B). 20 Sixth graders in SAT feeder schools are more likely to attrit, although the differences are less than 2 percentage points and not statistically significant. Overall, attritors have lower baseline test scores than non-attriting students, although attritors from SAT feeder schools have relatively higher baseline scores than CEB attritors (Table 1, Panel C). This is suggestive that omitting controls for baseline test scores—as in Equation 1—may bias effects. Even so, the sign of bias is ambiguous, because it also depends on how students of varying baseline abilities may differentially benefit from exposure to a SAT or CEB village.
School Enrollment and Child Labor
In Table 3, column 1 of Panel A shows that residing in a SAT village in 2009 lowers the probability that children are enrolled in any school by a statistically significant 0.1 (controlling only for pair fixed effects). The results are similar in columns 2 and 3, despite the inclusion of student controls and the use of propensity score weights. The effect is a substantial 15% of the 2009 enrollment rate in CEB villages (69%). By 2010, however, the negative enrollment effect is halved—0.05 in the doubly robust specification of column 6—though it is not precisely estimated.
Effect of Residing in a SAT Village on Student Outcomes, 2009 and 2010
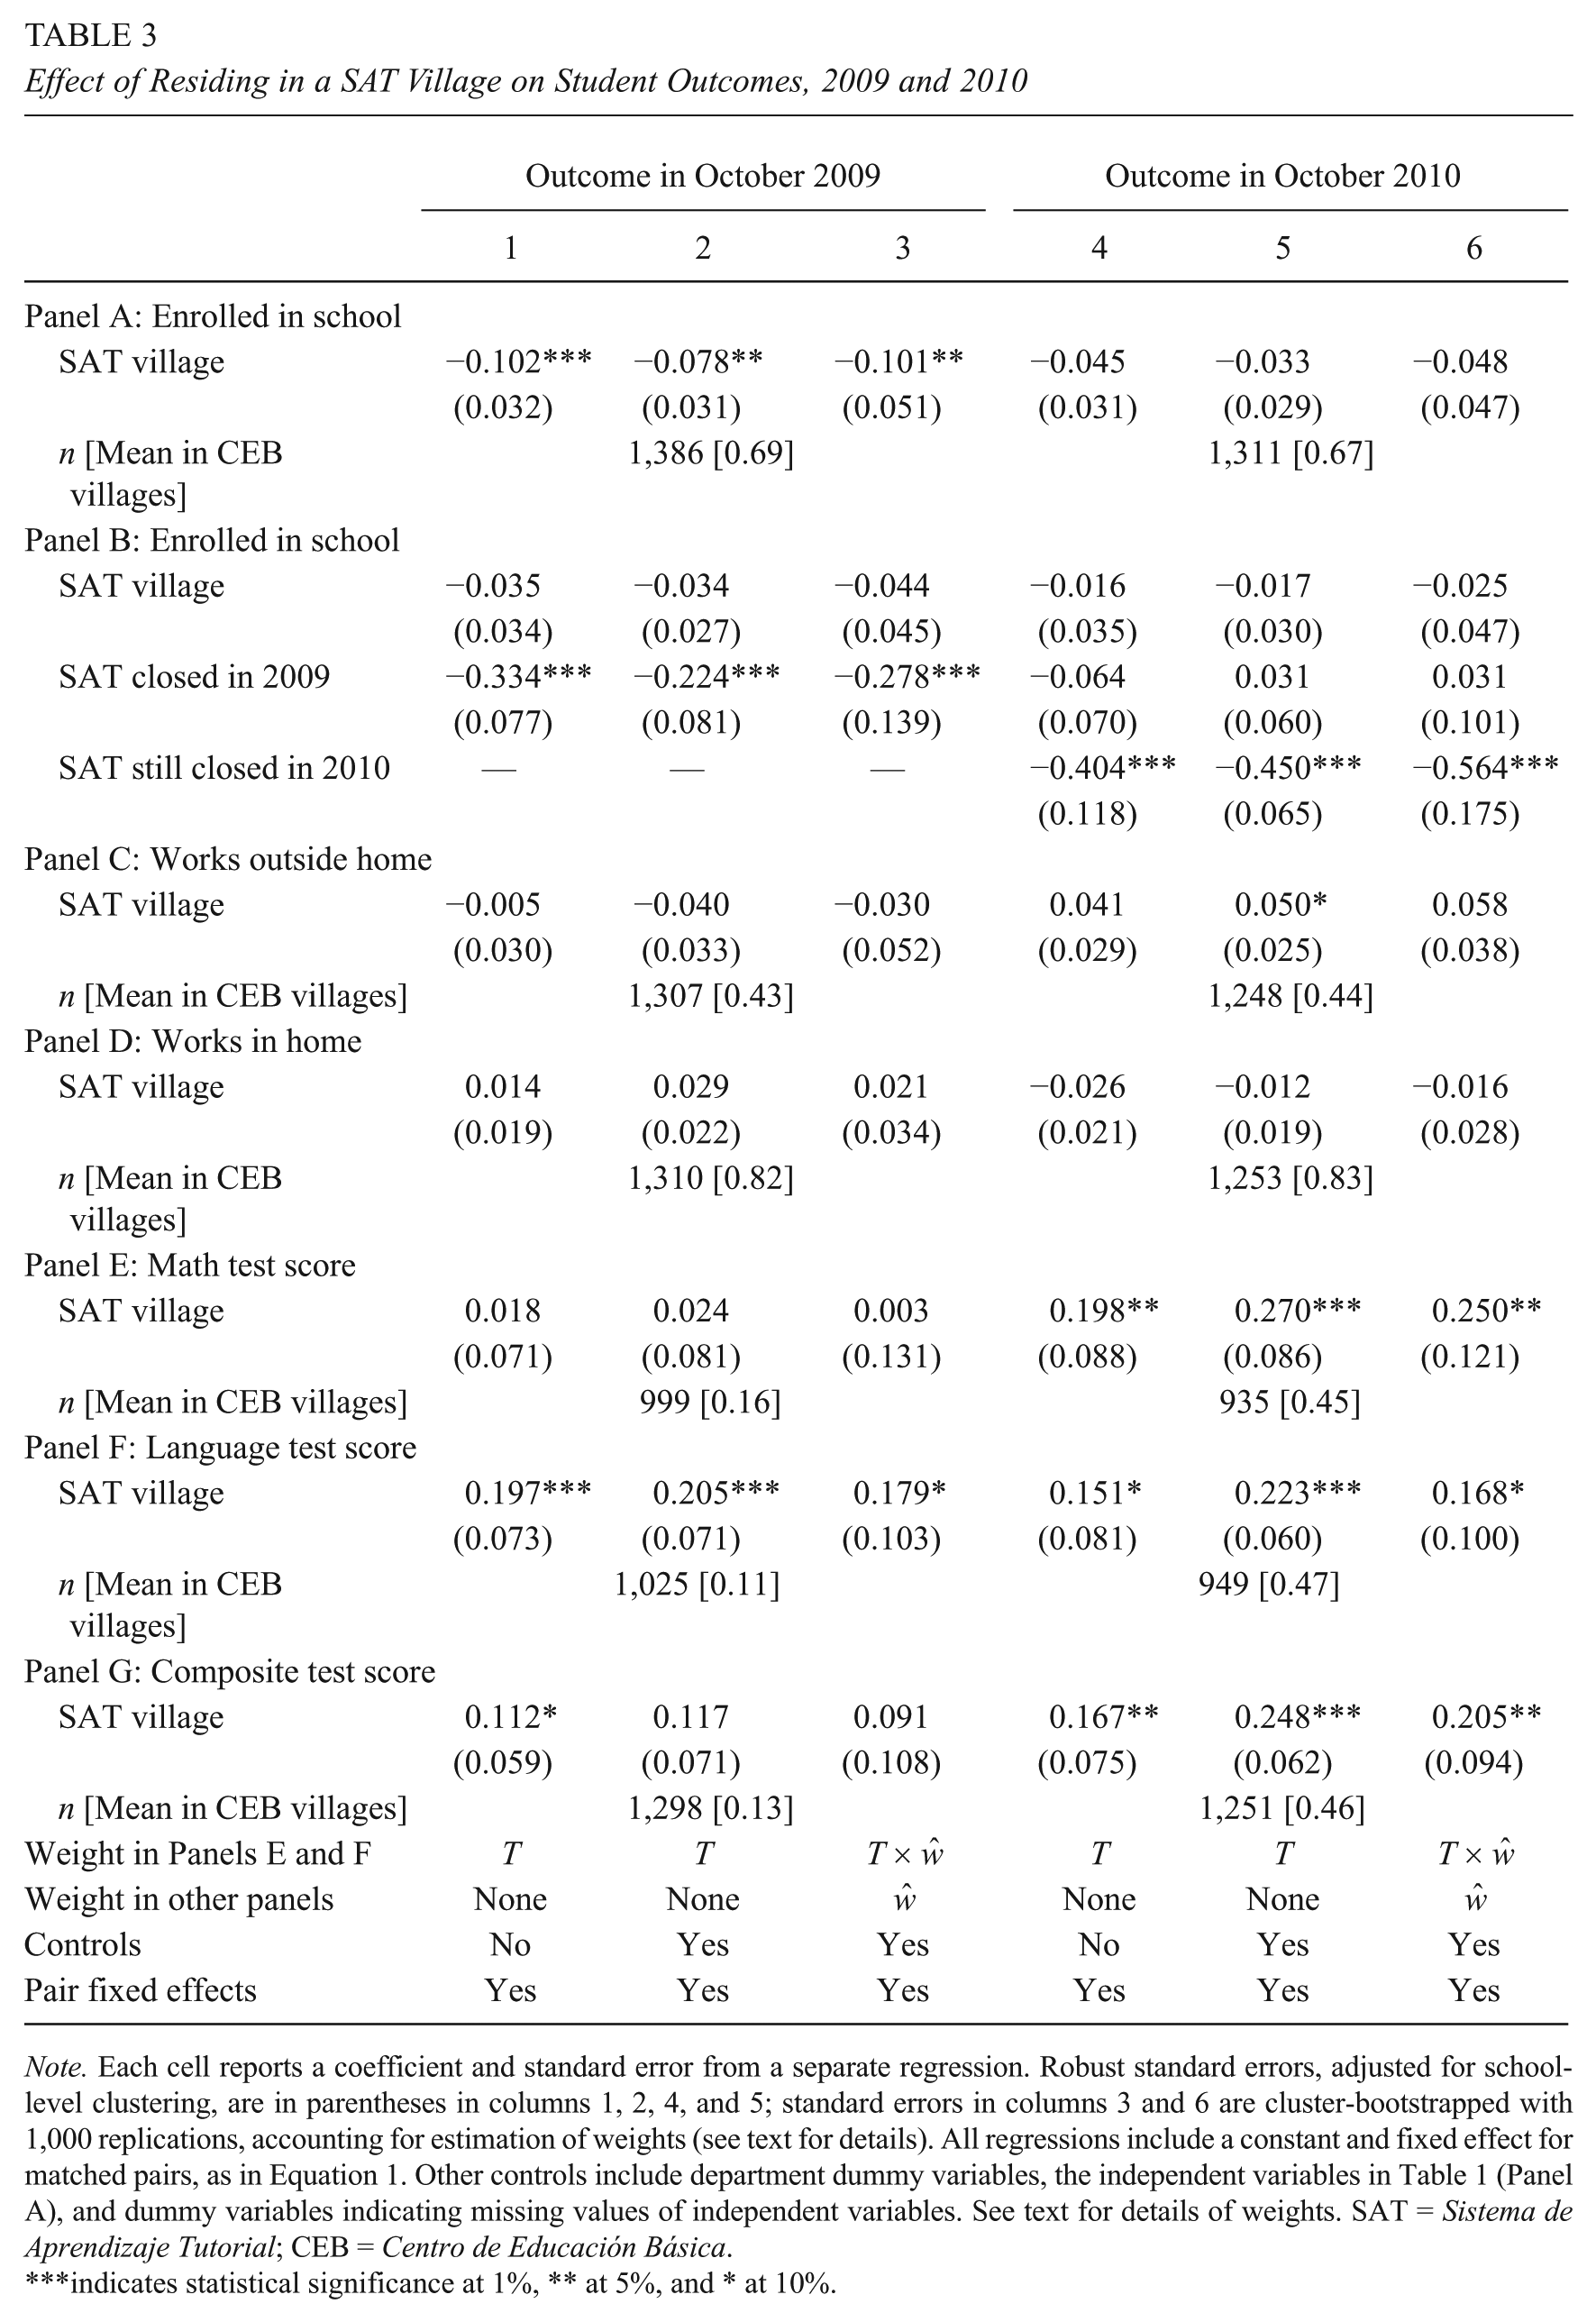
Note. Each cell reports a coefficient and standard error from a separate regression. Robust standard errors, adjusted for school-level clustering, are in parentheses in columns 1, 2, 4, and 5; standard errors in columns 3 and 6 are cluster-bootstrapped with 1,000 replications, accounting for estimation of weights (see text for details). All regressions include a constant and fixed effect for matched pairs, as in Equation 1. Other controls include department dummy variables, the independent variables in Table 1 (Panel A), and dummy variables indicating missing values of independent variables. See text for details of weights. SAT = Sistema de Aprendizaje Tutorial; CEB = Centro de Educación Básica.
indicates statistical significance at 1%, ** at 5%, and * at 10%.
The most plausible explanation for the 2009 difference between SAT and CEB villages is constrained school supply. In SAT villages, a new group does not open in a particular year if fewer than 20 seventh graders register. In the 2009 school year, 12 SATs did not open a new group, although 9 of these opened a group in 2010. In columns 1 to 3 of Panel B, we include a dummy variable indicating villages in which the SAT did not open in 2009. The doubly robust specification in column 3 suggests that children in villages without SATs in 2009 are 0.28 less likely to enroll in 2009, while the main effect is much smaller and insignificant. Column 6 further includes a variable indicating SATs that are still closed in 2010. Its coefficient is large (−0.56) and significant, whereas other coefficients are smaller and statistically insignificant. Taken together, the results suggest that within-pair enrollment differences across SAT and CEB villages are statistically indistinguishable from zero, unless SATs are closed.
The prior results are based on within-pair comparisons of SATs and CEBs. To assess robustness to an alternate control group, we exploit a regression-discontinuity design in the reduced sample of 47 SAT villages. As described earlier, SAT closure was a discontinuous function of “potential” seventh-grade enrollments, as recorded by SAT personnel just before the 2009 school year. We do not observe the original running variable, but instead use the 2007 sixth-grade enrollment in the SAT feeder school (from the appendix data) as a proxy. We estimated
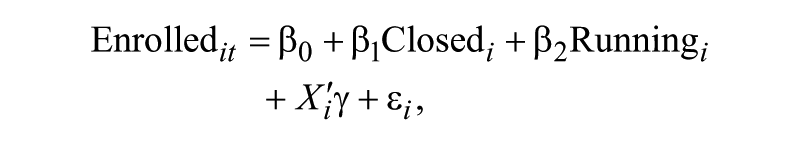
where the dummy dependent variable indicates the enrollment of child i in follow-up year t,
In 2009,
Panels C and D of Table 3 assess whether children in SAT villages are more or less likely to work. Even at the sixth-grade baseline, children had high rates of labor supply, both outside the home (40%) and inside it (85%). The evidence suggests that residing in a SAT village did not affect child labor supply in 2009. In 2010, the coefficient estimates are consistent with increases of 4 to 6 percentage points in work outside the home (see Panel C, columns 4–6), but only one of the coefficients is marginally significant at 10%.
Academic Achievement
Panels E and F report results for mathematics and language test scores, respectively. The specification based on Equation 1 suggests that residing in a SAT village—regardless of school enrollment—increased 2009 language test scores by 0.2 standard deviations of the baseline test score, relative to CEB villages. The magnitude is substantial, considering that language scores of children in CEB villages increased by only 0.11 standard deviations, on average, between 2008 and 2009. It is also robust to alternate specifications, with magnitudes of 0.21 and 0.18 standard deviations in columns 2 and 3. In contrast, the effects on 2009 mathematics scores are uniformly small and statistically insignificant. By 2010, there are effects on both mathematics and language test scores. The doubly robust specification in column 6 shows effects of 0.25 and 0.17 standard deviations on mathematics and language scores, respectively.
The relatively smaller sample sizes in Panels E and F reflect the random sampling procedure used to test children with the short form of a single subject. To increase sample sizes and improve precision, we calculated a composite test score that is the average of mathematics and language scores (or a single test score, if only one is available). In Panel G, there are small (0.09–0.11) and statistically insignificant differences in 2009. Focusing on the doubly robust specification, 2010 composite scores are 0.21 standard deviations higher in SAT villages. Relative to composite test score gains of 0.46 standard deviation in CEB villages, residing in the SAT village increased the rate of learning by 45%.
Alternate Specifications
Robustness of Average Treatment Effects
The main results in Table 3 are robust to three alternate specifications. First, we used a multiple imputation procedure for missing baseline data, instead of dummy variable adjustment. 24 Using the same specification as columns 2 and 5 of Table 3, the coefficients (and standard errors) for mathematics are −0.01 (0.08) and 0.19 (0.08) in each follow-up year, and 0.15 (0.07) and 0.19 (0.06) for language. Second, we re-estimated the prior specification, also using imputed values of the dependent variables. 25 The coefficients (standard errors) for mathematics are −0.02 (0.07) and 0.16 (0.07) in the respective follow-up years, and 0.15 (0.06) and 0.15 (0.05) for language. Third, we used imputed baseline and follow-up data, but further controlled for a quadratic polynomial of the school-level propensity score used to obtain the matched sample. Along with pair fixed effects, this is an added method of controlling for the appendix variables. The coefficients (standard errors) for mathematics are 0.06 (0.11) and 0.40 (0.12) in the respective follow-up years, and 0.25 (0.09) and 0.20 (0.09) for language.
Heterogeneity
There is consistent evidence that sixth graders residing in a SAT village have higher test scores after 2 years, on average, whether or not they enroll in a middle school grade. The results are difficult to explain unless the children who actually enrolled in SATs obtained higher achievement than children enrolled in CEBs. Although coefficients were not reported in Table 3, children are more likely to enroll in middle school if they have higher baseline test scores, lower ages at baseline, and higher socioeconomic status (SES; as proxied by household assets, dwelling quality, and other variables). 26
Table 4 reports regressions in which each independent variable is successively interacted with SATVILLAGE, always using 2010 composite scores as the dependent variable. 27 The table reports the coefficients on SATVILLAGE, the main effect of the independent variable, and the interaction between the two. Two coefficients on interaction terms are statistically significant (after adjusting significance for multiple comparisons, following Benjamini & Hochberg, 1995). They suggest that effects of residing in a SAT village are larger among households with piped water and electricity connections, two proxies of household and community wealth. Other coefficients, while less precisely estimated, have signs and magnitudes consistent with larger effects among higher SES households. For example, the effect of residing in a SAT village is 0.18 for children living in households with the average value of the assets index, and 0.28 if the index is one standard deviation higher.
Heterogeneity of Effects on 2010 Composite Test Scores
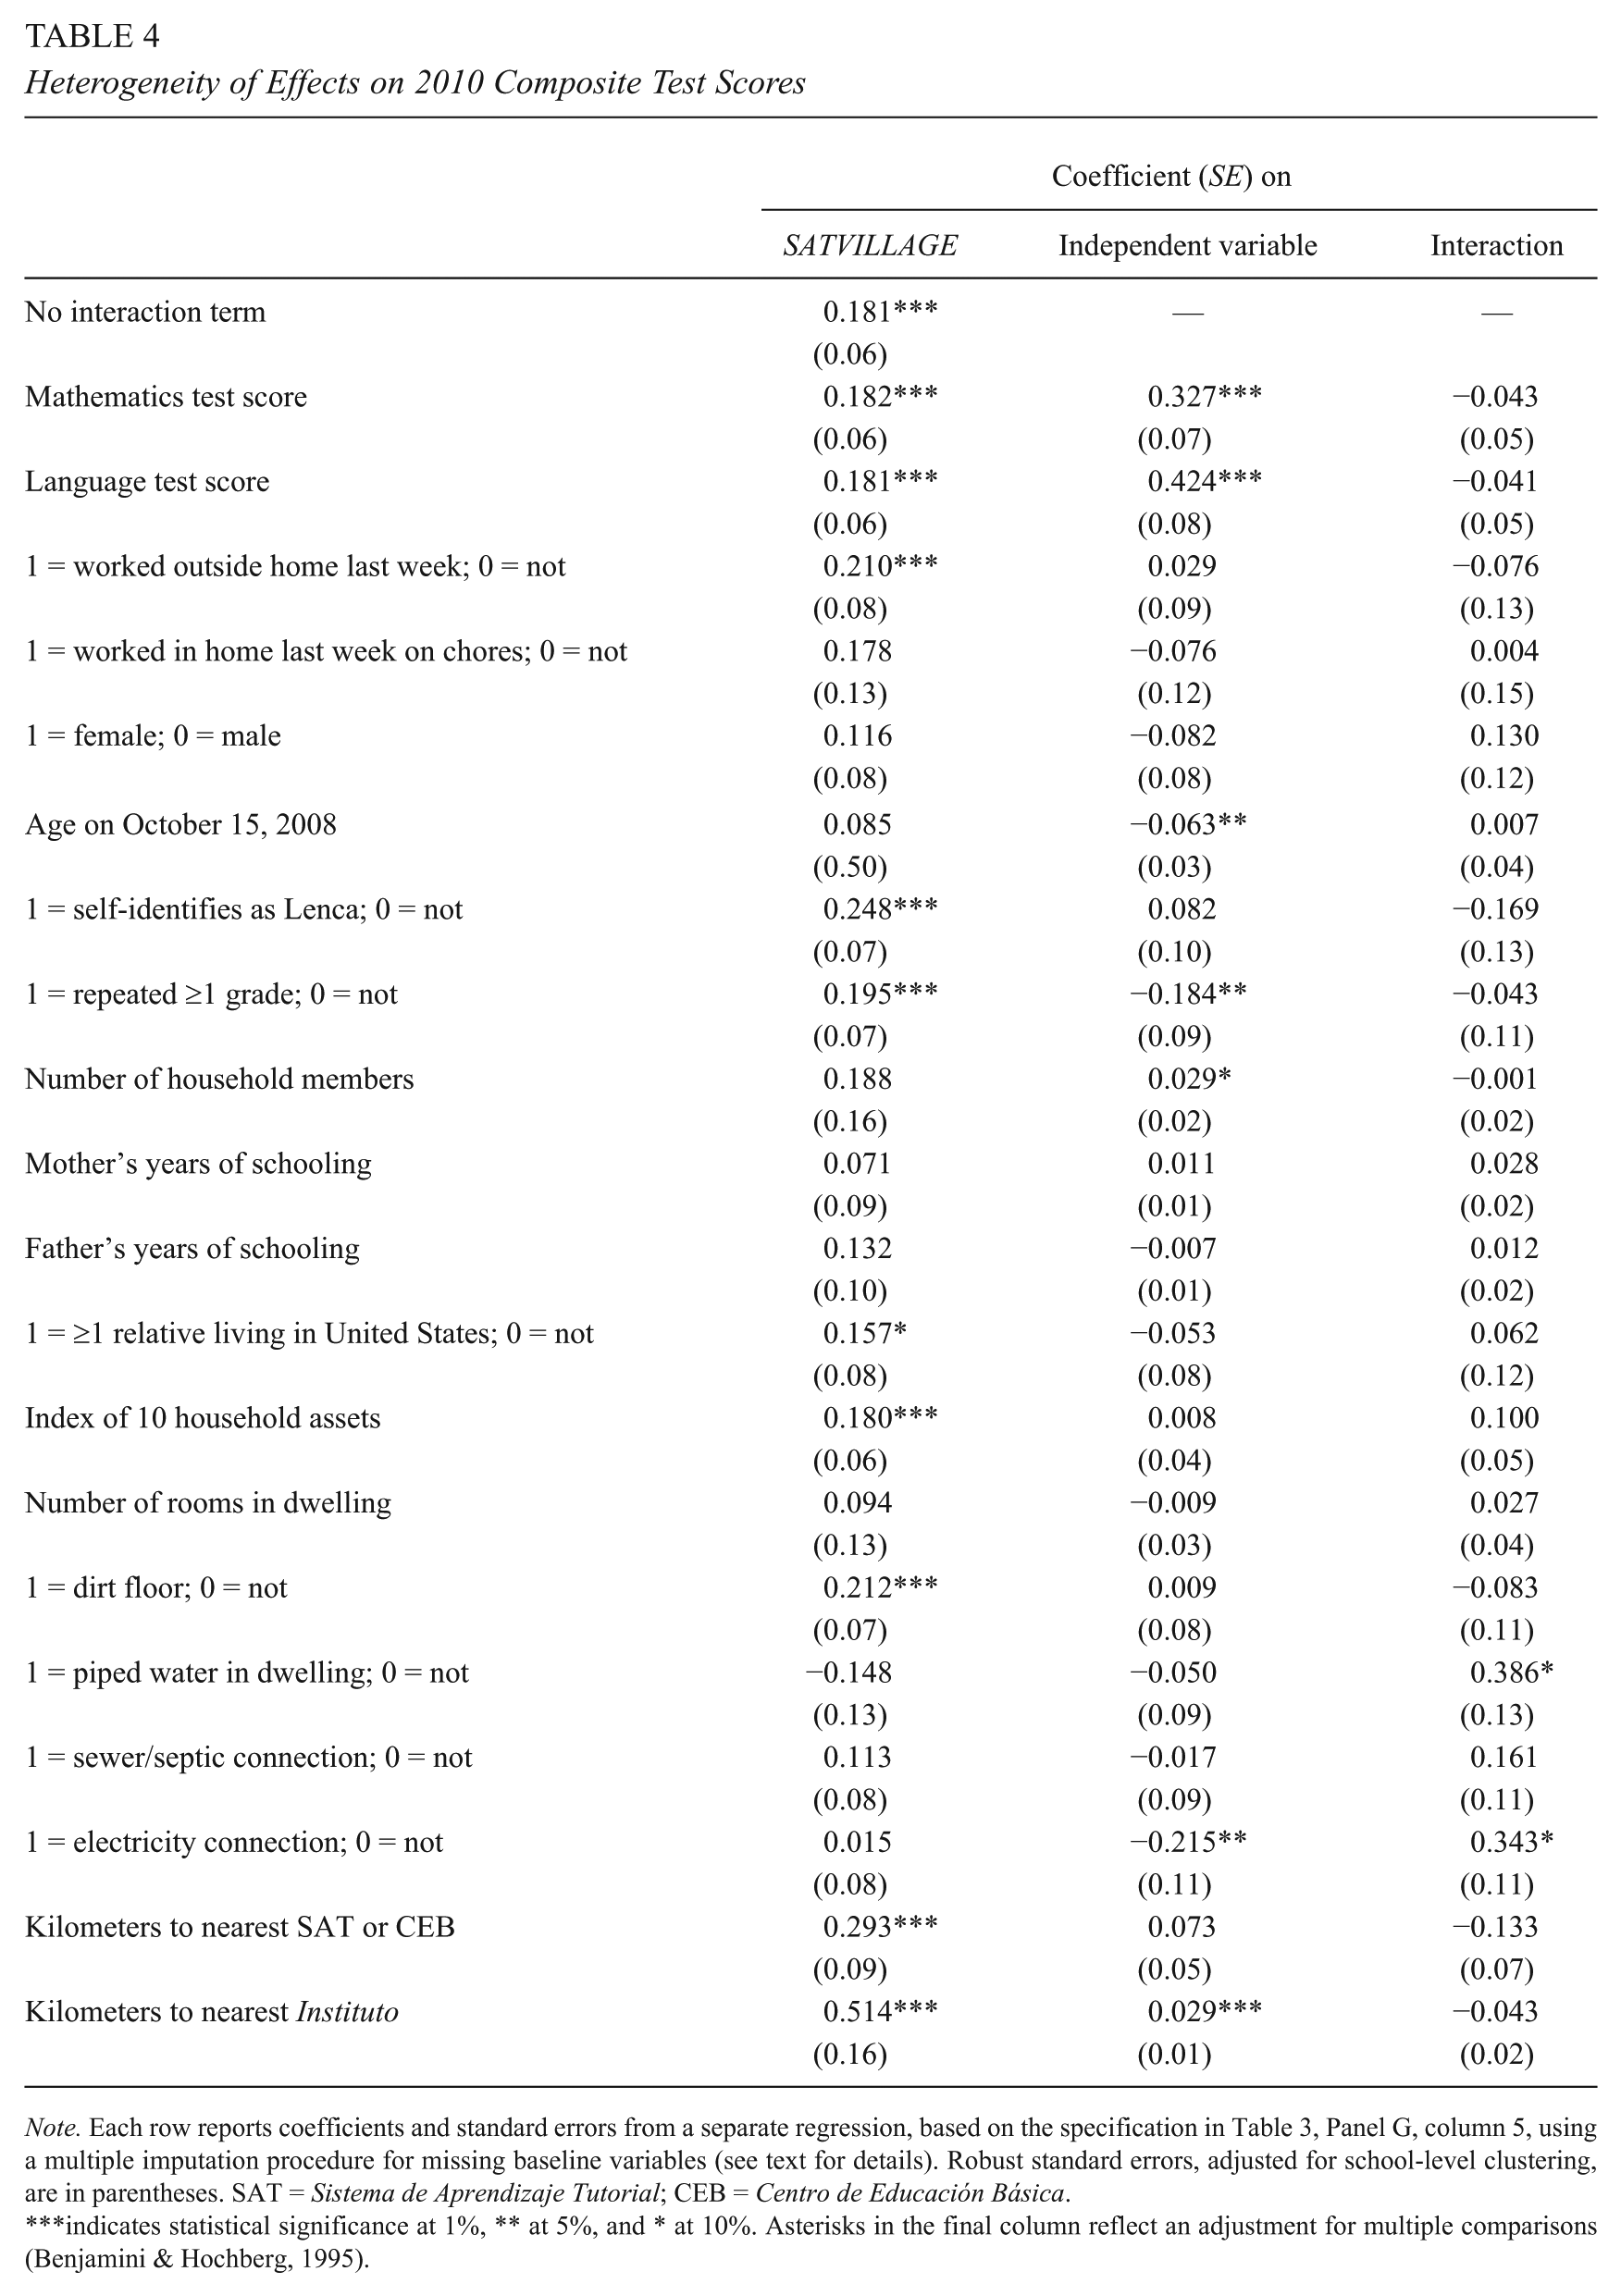
Note. Each row reports coefficients and standard errors from a separate regression, based on the specification in Table 3, Panel G, column 5, using a multiple imputation procedure for missing baseline variables (see text for details). Robust standard errors, adjusted for school-level clustering, are in parentheses. SAT = Sistema de Aprendizaje Tutorial; CEB = Centro de Educación Básica.
indicates statistical significance at 1%, ** at 5%, and * at 10%. Asterisks in the final column reflect an adjustment for multiple comparisons (Benjamini & Hochberg, 1995).
To further explore heterogeneity, we assess whether the magnitude of effects varies at different quantiles of the conditional test score distribution (Koenker & Hallock, 2001). In each panel of Figure 3, solid lines plot coefficient estimates of SATVILLAGE at quantiles of the conditional test score distribution between 0.05 and 0.95. 28 The gray areas indicate 90% confidence intervals, obtained with cluster-bootstrapped standard errors based on 1,000 replications. Horizontal dotted lines indicate ordinary least squares (OLS) estimates, based on a similar regression specification. The OLS estimate for 2009 mathematics is small, as expected, and none of the quantile treatment effects are statistically distinguishable from zero. For other dependent variables, the only statistically significant effects are at higher quantiles of the conditional test score distribution, and these are larger than the OLS treatment effect. At lower quantiles, the estimated effects are closer to zero (especially for 2009 language scores and 2010 mathematics scores).
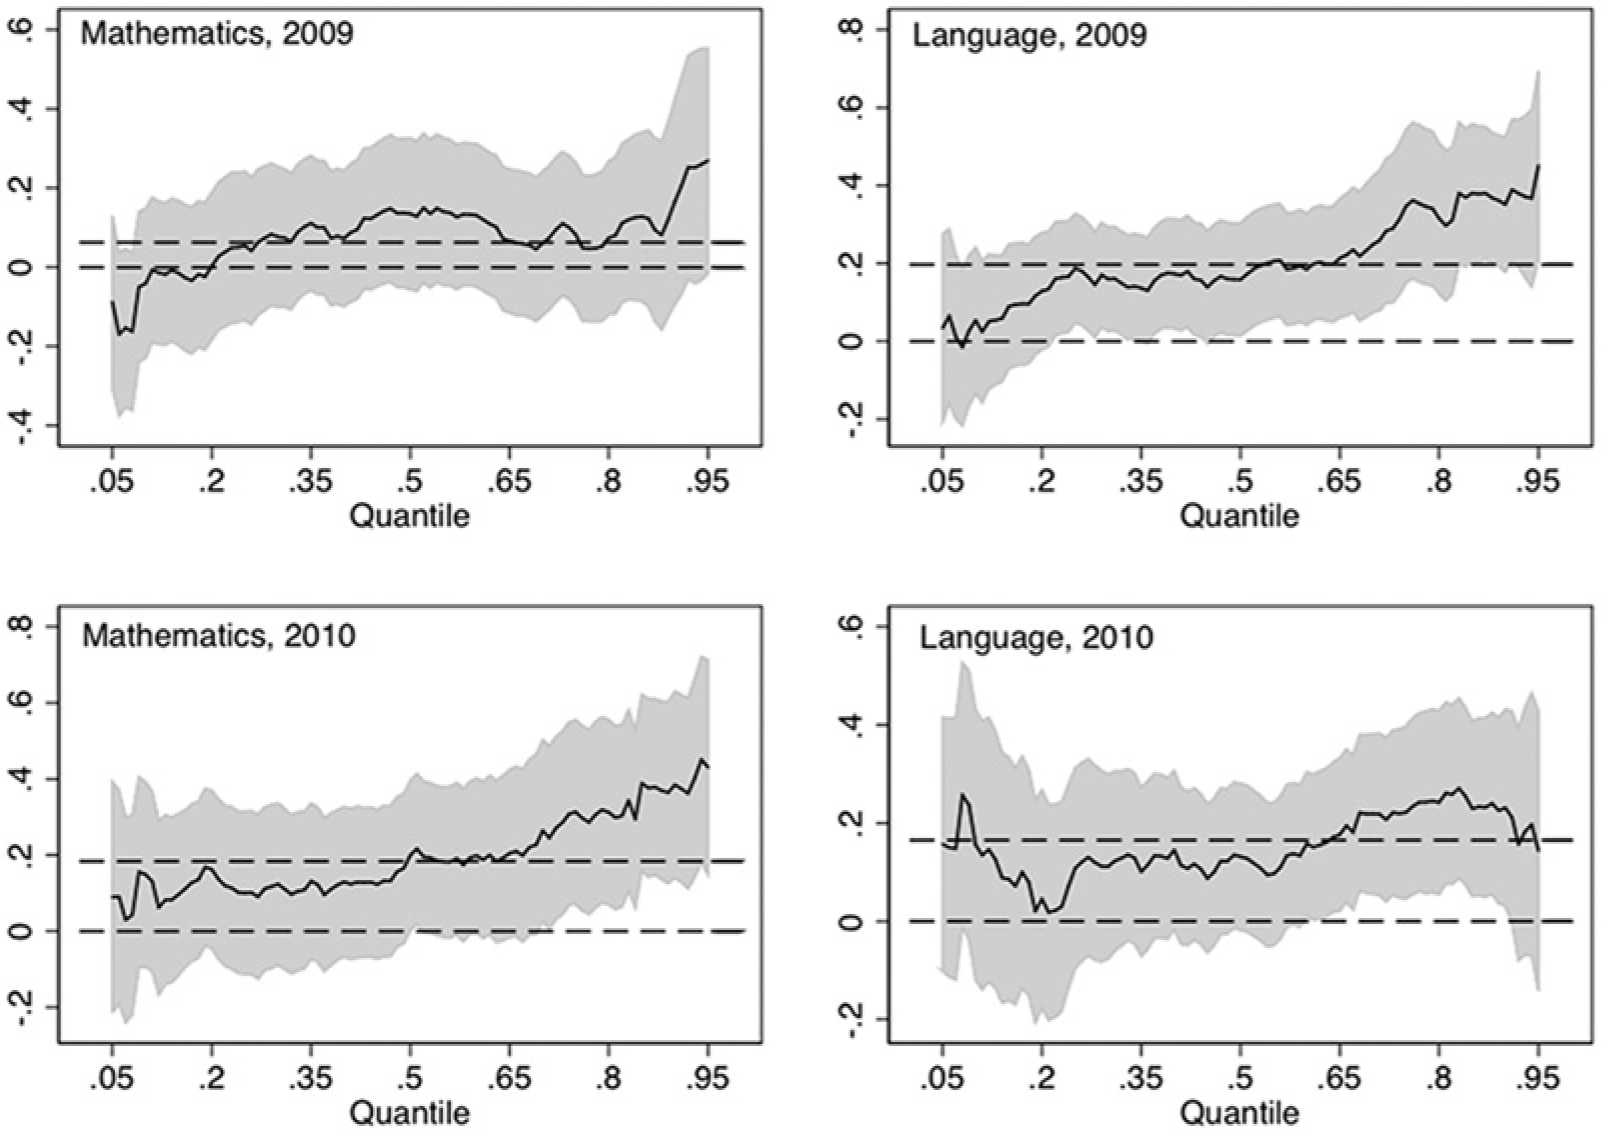
Quantile regressions.
Taken together, the results provide a solid case that SATs are relatively more effective than CEBs. In Table 4, average treatment effects are relatively larger among higher SES students, who happen to be more likely to enroll in schools of each village type. In Figure 3, quantile treatment effects are largest at higher quantiles of the conditional outcome distributions, which may be disproportionately occupied by higher achieving students who continued to attend school after the baseline.
Explanations for Differential Effectiveness
There are at least four plausible explanations why SATs and CEBs might be differentially effective, conditional on enrollment. First, schools differ in the quantity of instructional materials such as textbooks and in how these materials are utilized. Table 2 (Panel B) compares principal-reported data on textbook availability in each type of school. In follow-up data collection, 95% of SATs report that most students have textbooks, compared with 58% of CEBs. This is consistent with Bayán’s insistence that students purchase texts as a condition of enrollment, and with evidence that public schools in the several departments of our sample do not always have a full complement of instructional materials (Secretaría de Educación, 2009). In our observations of SAT and CEB classrooms, we often found that CEB students did not have individual copies of textbooks, and therefore spent a great deal of time copying from dictated lessons or from a shared textbook. 29 In SAT classrooms, students usually read from individual copies of texts (both aloud and silently) and worked on exercises in large and small groups.
A second explanation is that teachers differ in their capacity to deliver effective instruction. On one hand, SAT teachers have fewer years of teaching experience and are less likely to have university degrees, consistent with Bayán’s model of teacher recruitment (Table 2, Panel B). On the other hand, 89% report receiving in-service training during the prior academic year, and these rates are consistently high during both follow-up years. Bayán provides textbook-based workshops prior to each trimester, and this is borne out by the teachers’ written descriptions of the course content on surveys. Less than half of CEB teachers received training, and their self-reports suggest that its length and content varied widely across teachers.
Third, it is possible that teachers differ in their incentives, which could affect the quantity and quality of instructional time (Duflo, Dupas, & Kremer, 2012; Duflo, Hanna, & Ryan, 2012). Although neither type of school explicitly links rewards to objective performance measures, SATs are more likely to employ teachers with flexible contracts (Table 2, Panel B). There is indirect evidence that teachers’ contract status affected teacher effort. Averaging across two school years, CEB principals report that schools missed 51 instructional days per year, about one quarter of the total, and about twice as large as SATs. 30 The differences were largest in several months of political disruptions. President Zelaya was arrested and exiled in June 2009, and a constitutional crisis provoked strikes during July and the rest of the 2009 school year. A teachers’ strike over a salary dispute also led to school closures in August 2010. In these months, the difference in instructional days was as large as 10 days, favoring SATs. Teachers in both types of schools are public employees and members of the union, but our interviews with Bayán staff suggest that SAT teachers were less likely to participate in teacher work stoppages because of the effective persuasion of field supervisors or because of the unwillingness of many SAT teachers to leave their classrooms.
Fourth, SATs and CEBs may differ in the size and peer composition of middle school classrooms. On average, SAT pupil–teacher ratios are 4.3 to 2.6 students lower in the seventh and eighth grades, respectively, though only the first is statistically significant (Table 2, Panel B). Given the limited experimental evidence on class size reduction in developing countries, the modest reductions cannot plausibly explain the full difference across SAT and CEB villages. 31 Finally, as a proxy of peer composition in SATs and CEBs, we calculated the school-level mean of baseline composite test score among students who are enrolled in a SAT or CEB at each follow-up. Across all schools, the peer-quality proxy is larger than zero in the full sample of schools—consistent with positive correlations between baseline scores and enrollment—but the difference between SATs and CEBs is small and statistically insignificant.
Costs
We estimated the per-student costs of SATs and CEBs in the matched sample, considering several categories of costs (to maintain comparability, we focused on middle school Grades 7–9). First, the CEB teacher wage bill per student was 6,449 Lempiras (US$322) per year, on average. 32 It is 22% lower in SATs (p < .01). 33 Per-student wages are lower in SATs because of teacher contract status, experience, and degrees (Table 2, Panel B), despite slightly lower pupil–teacher ratios in SATs. Second, parents of CEB students annually spend an average of 1656 Lempiras per student (US$83) on uniforms, textbooks, and other materials. Expenditures are 15% higher among SAT parents (p < .05), not unexpected given the mandatory annual textbook fees. Third, both types of schools have administrative overhead for training and supervision of classroom teachers. 34 Combining the three cost categories, we estimated an annual per-student cost of 9419 Lempiras (US$471) in CEBs, which is 10% lower in SATs (p < .06).
The difference is probably understated because the estimates do not include government-incurred costs of materials, equipment, or facilities. CEBs provide textbooks to children, while SATs require parent contributions. By design, SATs do not expend resources on classroom instructional equipment such as audiovisual equipment and computers, which are sometimes present in CEBs (and were partly funded by multilateral loans). Finally, SATs use classrooms borrowed from off-shift primary schools or buildings contributed by the community. We were unable to impute a credible rental cost to facilities, but it seems unlikely that SAT infrastructure costs would exceed CEBs, especially given the fact that a loan from the IDB financed new classroom construction and remodeling exclusively in CEBs (IDB, 2000).
Discussion
The Honduran SAT model combines instructional materials and teacher training, flexible teacher contacts, and autonomous management by an NGO. This article evaluates the impact on academic achievement of offering SATs to rural villages instead of CEBs (the traditional, publicly managed alternative). Using census and school administrative data, we obtained a matched sample of 47 pairs of villages with either a SAT or a CEB. We collected baseline achievement data among graduating sixth graders in the matched sample and followed students for 2 years, regardless of whether they enrolled in a middle school grade.
After 2 years, children in SAT villages were similarly likely to enroll in school, but had higher average test scores (by 20% of a standard deviation) than children in CEB villages. We were not able to separately identify the most effective components of the SAT intervention, relative to CEBs, but survey evidence suggests that its classrooms are better endowed with instructional materials, and that teachers have higher levels of in-service training related to instructional methods and miss fewer days of instruction. The evidence does not suggest that SAT schools enroll higher ability peers, on average, or have markedly lower class sizes. Largely because of its use of locally hired contract teachers, the per-student costs in SATs were lower by at least 10%. We conclude that the SAT program is a relatively cost-effective option—relative to traditional models—for expanding middle school education in poor, rural villages of Honduras.
Our findings on the impact of the SAT program join an existing body of qualitative and non-experimental evidence. The present analysis has focused on learning outcomes, although other research suggests that SAT is a promising method of promoting civic responsibility and empowering adolescent girls and women (Honeyman, 2010; Murphy-Graham, 2012). Furthermore, in a study that compared dropout from multiple alternative secondary education programs in Honduras, Marshall, Alas, Aguilar, Rápalo, and Castro (2012) found that rates of dropout from SAT were lower than those of other alternative middle school programs.
Despite the promising results, our research design also showed that about one third of children do not continue their schooling in either type of village, despite the relaxed school supply constraint. Post-primary dropout is highly correlated with sixth-grade test scores and proxies of household SES. It may be due to students’ low perceived returns to middle school education, given their own low achievement, or due to the constraints imposed by poverty and the inability of households to forgo child income, despite high returns to additional schooling. The first implies the need to continue investing in the quality of pre-primary and primary school opportunities, though there is a paucity of rigorous evidence on the relative cost-effectiveness of alternatives in Central America. The second implies the need to relax constraints by offering targeted transfers to poor families. From 2001 to 2002, a Honduran program offered cash transfers to poor families, conditional on children’s primary school enrollment, and a randomized experiment showed large gains in the proportion of children enrolled in primary school (Galiani & McEwan, 2013). The latest version of this policy, currently being evaluated with a randomized experiment, places additional conditions on childrens’ enrollment in middle school grades.
This article’s findings are timely given the increased attention in the international education policy agenda to issues beyond primary school access. The Global Education First Initiative of the United Nations focuses on the goals of expanding educational access, improving quality, and fostering global citizenship, at both primary and post-primary levels. 35 The Global Compact on Learning, an initiative spearheaded by the Brookings Institution Center for Universal Education, identified three policy priorities, one of which is the expansion of relevant post-primary education opportunities. 36 Finally, the Partnership to Strengthen Innovation and Practice in Secondary Education, a group of donors led by the MacArthur Foundation, supports projects that inform the “imminent expansion and transformation of secondary education.” 37 This article’s results help inform the emerging global agenda on improving access to and quality of secondary education in poor countries.
Footnotes
Appendix
Descriptive Statistics on School and Village Variables
| All schools |
Matched schools |
|||||||
|---|---|---|---|---|---|---|---|---|
|
M
|
Standardized difference | Variance ratio |
M
|
Standardized difference | Variance ratio | |||
| Variable | SAT feeder | CEB | SAT feeder | CEB | ||||
| Panel A: School variables from 2007 administrative data | ||||||||
| 1 = rural school; 0 = urban school | 0.97 | 0.83 | 0.43 | — | 0.98 | 0.96 | 0.06 | — |
| 1 = school has ADEL; 0 = not | 0.34 | 0.40 | 0.12 | — | 0.32 | 0.38 | 0.13 | — |
| 1 = school has AECO; 0 = not | 0.28 | 0.26 | 0.04 | — | 0.32 | 0.13 | 0.43 | — |
| 1 = school has student organization; 0 = not | 0.47 | 0.50 | 0.06 | — | 0.45 | 0.36 | 0.17 | — |
| Initial enrollment in Grade 1 | 23.61 | 46.61 | 0.61 | 0.10 | 25.77 | 26.40 | 0.02 | 1.53 |
| Initial enrollment in Grade 2 | 21.35 | 41.94 | 0.72 | 0.19 | 22.79 | 26.55 | 0.13 | 1.43 |
| Initial enrollment in Grade 3 | 18.08 | 38.40 | 0.70 | 0.13 | 19.98 | 22.43 | 0.08 | 1.06 |
| Initial enrollment in Grade 4 | 18.70 | 35.84 | 0.64 | 0.14 | 20.17 | 22.34 | 0.08 | 1.12 |
| Initial enrollment in Grade 5 | 15.10 | 31.39 | 0.63 | 0.10 | 16.98 | 18.96 | 0.08 | 0.97 |
| Initial enrollment in Grade 6 | 14.35 | 28.81 | 0.63 | 0.11 | 15.81 | 17.81 | 0.09 | 0.84 |
| % of primary students who repeated ≥1 grade | 0.06 | 0.08 | 0.38 | 1.00 | 0.07 | 0.06 | 0.22 | 1.40 |
| M age of new first graders | 6.85 | 6.71 | 0.31 | 1.48 | 6.79 | 6.79 | 0.00 | 0.69 |
| 1 = school has morning shift; 0 = not | 0.80 | 0.76 | 0.08 | — | 0.79 | 0.70 | 0.20 | — |
| 1 = school has afternoon shift; 0 = not | 0.03 | 0.25 | 0.57 | — | 0.04 | 0.02 | 0.05 | — |
| Panel B: Village (aldea) variables from 2001 census | ||||||||
| % of dwellings without dirt floor | 0.41 | 0.51 | 0.37 | 0.93 | 0.41 | 0.38 | 0.11 | 0.96 |
| % of dwellings with piped water supply | 0.67 | 0.72 | 0.25 | 1.38 | 0.67 | 0.70 | 0.13 | 1.79 |
| % of dwellings attached with electricity | 0.18 | 0.34 | 0.48 | 0.62 | 0.15 | 0.14 | 0.04 | 0.87 |
| % of homes cooking with electricity or gas | 0.06 | 0.15 | 0.36 | 0.38 | 0.06 | 0.05 | 0.07 | 2.38 |
| % of homes connected to sewer or septic | 0.39 | 0.43 | 0.15 | 0.89 | 0.42 | 0.41 | 0.06 | 0.76 |
| % of homes with ≥1 car | 0.05 | 0.07 | 0.33 | 0.59 | 0.05 | 0.04 | 0.17 | 1.28 |
| % of homes with refrigerator | 0.09 | 0.17 | 0.38 | 0.64 | 0.08 | 0.07 | 0.06 | 1.10 |
| % of homes with radio | 0.68 | 0.68 | 0.07 | 1.58 | 0.69 | 0.69 | 0.02 | 1.48 |
| % of homes with television | 0.11 | 0.22 | 0.43 | 0.55 | 0.09 | 0.09 | 0.02 | 0.95 |
| % of homes with computer | 0.00 | 0.01 | 0.36 | 0.19 | 0.00 | 0.00 | 0.02 | 1.10 |
| % of homes with telephone | 0.01 | 0.04 | 0.34 | 0.32 | 0.02 | 0.01 | 0.10 | 13.8 |
| % of owned homes | 0.86 | 0.84 | 0.22 | 0.73 | 0.86 | 0.87 | 0.04 | 1.23 |
| M number of household members | 5.52 | 5.25 | 0.49 | 0.98 | 5.54 | 5.46 | 0.14 | 1.11 |
| % born in surveyed municipality | 0.75 | 0.77 | 0.16 | 1.22 | 0.79 | 0.83 | 0.24 | 1.09 |
| % of individuals identifying as Garífuna | 0.00 | 0.03 | 0.25 | 0.003 | 0.00 | 0.00 | 0.02 | 205 |
| % of individuals identifying as indigenous | 0.19 | 0.16 | 0.09 | 1.16 | 0.18 | 0.27 | 0.38 | 0.99 |
| % of males ≥21 that can read and write | 0.68 | 0.68 | 0.05 | 0.73 | 0.67 | 0.66 | 0.06 | 0.92 |
| M years of schooling among males ≥21 | 2.92 | 3.36 | 0.30 | 0.48 | 2.93 | 2.86 | 0.05 | 1.13 |
| % of males ≥21 that worked last week | 0.68 | 0.66 | 0.06 | 1.13 | 0.66 | 0.66 | 0.02 | 0.84 |
| % of females ≥21 that can read and write | 0.62 | 0.65 | 0.22 | 0.62 | 0.62 | 0.59 | 0.23 | 0.80 |
| M years of schooling among females ≥21 | 2.78 | 3.31 | 0.36 | 0.49 | 2.84 | 2.62 | 0.15 | 1.25 |
| % of females ≥21 that worked last week | 0.08 | 0.12 | 0.38 | 0.41 | 0.07 | 0.09 | 0.22 | 0.25 |
| Net enrollment rate, ages 6–11 | 0.76 | 0.78 | 0.15 | 0.89 | 0.77 | 0.77 | 0.05 | 0.74 |
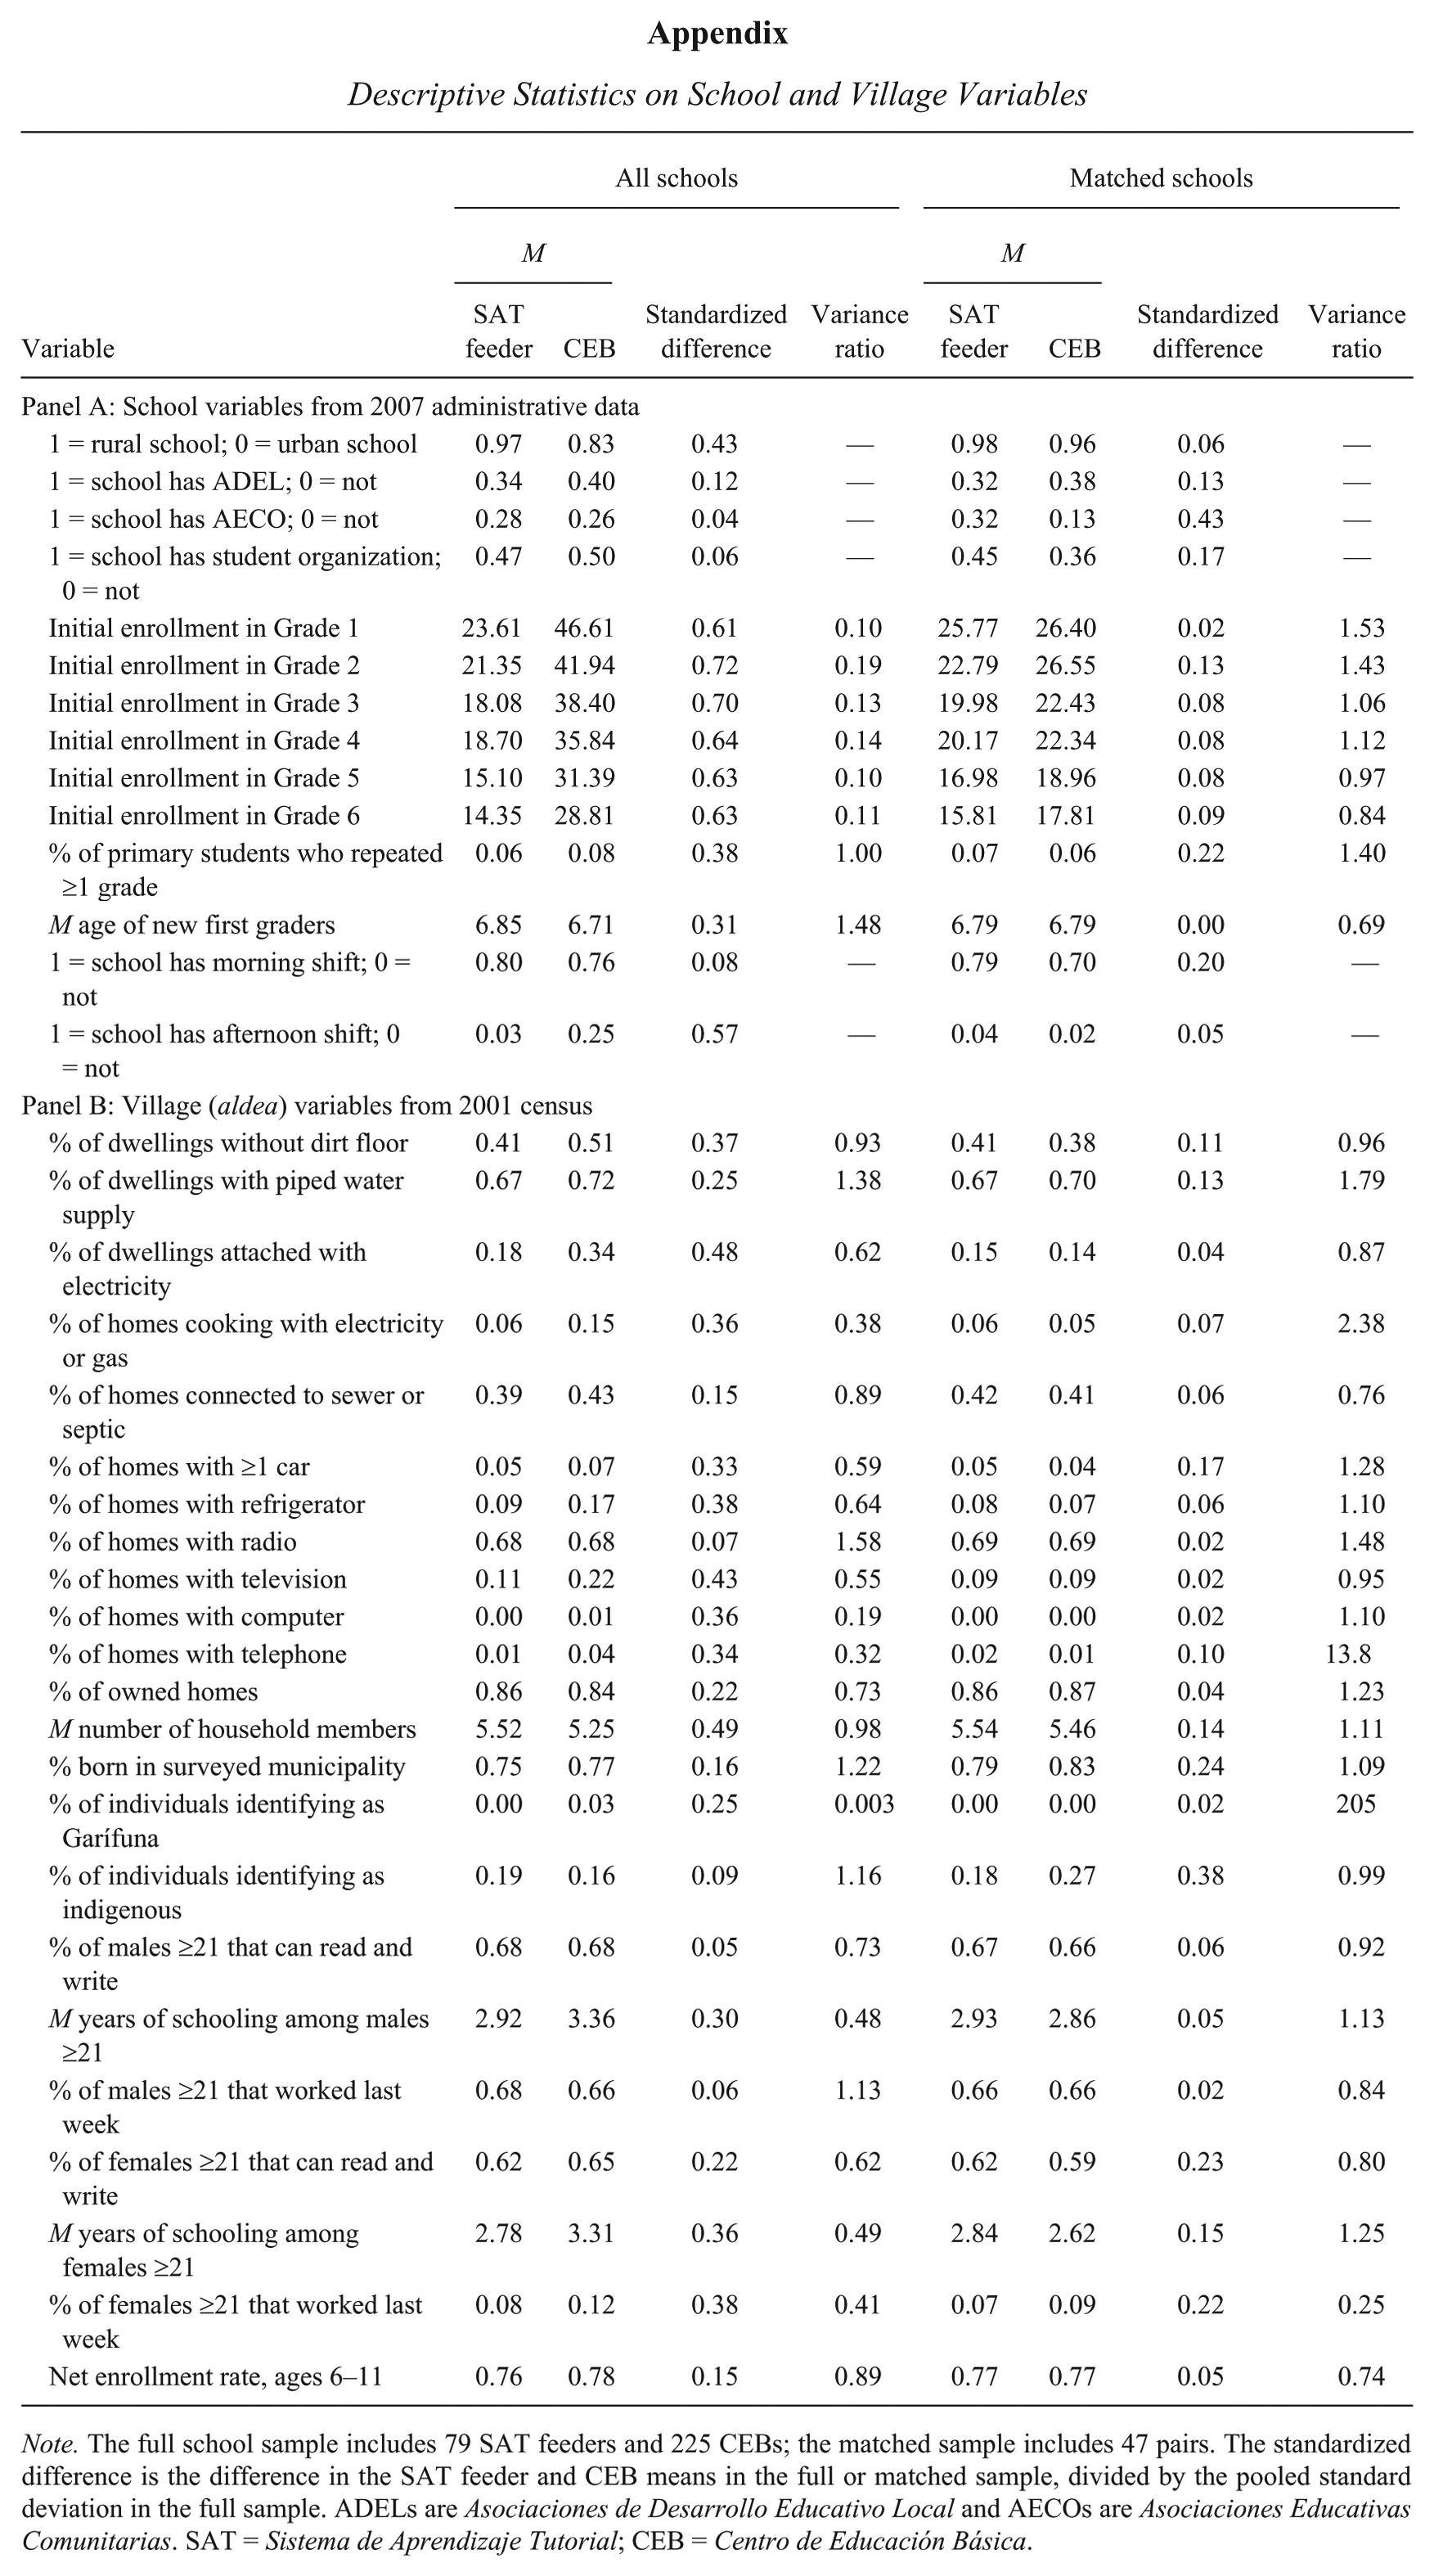
Note. The full school sample includes 79 SAT feeders and 225 CEBs; the matched sample includes 47 pairs. The standardized difference is the difference in the SAT feeder and CEB means in the full or matched sample, divided by the pooled standard deviation in the full sample. ADELs are Asociaciones de Desarrollo Educativo Local and AECOs are Asociaciones Educativas Comunitarias. SAT = Sistema de Aprendizaje Tutorial; CEB = Centro de Educación Básica.
Acknowledgements
The Asociación Bayán enthusiastically supported our research, especially Soheil Dooki, as did teachers and students in many Honduran primary and middle schools. Rebecca Cannon, Joseph Lample, Lena McCauley, Rachel Snyderman, Rebecca Tarlau, Keila Torre, and Kimberly Vinall provided excellent research assistance. Kristin Butcher, Pascaline Dupas, Dan Fetter, Bryan Graham, Felipe Martinez, Ted Miguel, Lynn Murphy, and many seminar participants provided helpful comments, without incurring responsibility for interpretations or errors.
Declaration of Conflicting Interests
The author(s) declared no potential conflicts of interest with respect to the research, authorship, and/or publication of this article.
Funding
The author(s) disclosed receipt of the following financial support for the research, authorship, and/or publication of this article: We gratefully acknowledge financial support from the William and Flora Hewlett Foundation.
1.
On the 2011 Progress in International Reading Literacy Study (PIRLS) reading assessment, the average Honduran sixth grader scored 1.1 standard deviations below a U.S. fourth grader. On the 2011 Trends in International Mathematics and Science Study (TIMSS) mathematics assessment, sixth graders scored 1.5 standard deviations below U.S. fourth graders, on average. In Honduras, students in remote rural areas score more than half a standard deviation below the national mean.
2.
Toward addressing low primary school quality, the government has invested in parent-run, autonomous primary schools (di Gropello & Marshall, 2005) and the distribution of textbooks and teacher guides aligned with a national curriculum (Secretaría de Educación, 2003a, ![]() ).
).
3.
A randomized experiment using cluster assignment of villages was not practical, because neither the Honduran Secretaría de Educación nor the non-governmental organization (NGO) were willing to implement their respective models in a randomly assigned group of villages. As an alternative, we might have leveraged the non-random roll-out of Sistema de Aprendizaje Tutorial (SAT) and Centro de Educación Básica (CEB) in rural villages during the past decade (using a difference-in-differences framework). However, there is no administrative test score data on Honduran children, and existing samples do not regularly include SATs.
4.
We also conducted in-depth interviews and classroom observations in a subset of the sample. Although these data are not reported in this article, they are consistent with results from the paper-and-pencil surveys of teachers and principals that are discussed in this article.
5.
Two studies also find that directly linking compensation with objective performance measures, such as teacher attendance and student test scores, improves test scores (Duflo, Hanna, & Ryan, 2012; Muralidharan & Sundararaman, 2011), but a third finds that effects are mainly on incentivized tests and driven by test preparation activities (Glewwe, Ilias, & Kremer, 2010).
6.
In Honduras, di Gropello and Marshall (2005) find some test scores effects of the primary school PROHECO (Programa Hondureño de Educación Comunitaria [Honduran Community Education Program]) program, but the results are sensitive to the exact sample, and there is no pre-test measure. In El Salvador, the effects of the EDUCO (Educación con Participación de la Comunidad [Education with Community Participation]) program are sensitive to model specification, and rely on potentially endogenous variables as exclusion restrictions in a Heckman correction (Sawada & Ragatz, 2005). Nicaragua’s autonomous schools program had mixed effects on student test scores that were also sensitive to model specification (Parker, 2005).
7.
The agreement between Bayán and the Honduran government specifies conditions for a SAT center to open in a village (República de Honduras, 2009). These include (a) at least 35 students in the sixth grade from the primary school(s) of the rural village and neighboring communities, and no other secondary school within 7 km; (b) community support, including the provision of land to use in the agricultural activities; and (c) support of local educational authorities including the local primary schoolteachers. To be eligible for conversion to a CEB, primary schools must (a) offer six primary grades; (b) have a minimum of 20 graduates from sixth grade and a minimum of 15 students preregistered in seventh grade; (c) serve a population that does not have access to another CEB or secondary institution; and (d) have adequate land to accommodate the expansion of the school facilities (Inter-American Development Bank [IDB], 2000). In both cases, there is no empirical data on the exact criteria that guided the final selection.
8.
We conducted a separate survey to identify the main feeder school of each SAT. In May 2008, we surveyed 79 SATs and identified the primary school attended by students in Grade 7 (or 8, if Grade 7 was not open in that year). The mean (median) proportion of primary schools represented in each SAT is 4.5 (4). The mean (median) proportion of students who attended the most common feeder school is 63% (64%), ranging from 33% to 100%. This school is the feeder primary school that we surveyed in the baseline data collection.
9.
We conducted the same matching exercise without the caliper restriction, leading to a matched sample of 158 schools. Besides exceeding the budget constraint for data collection, this sample was substantially unbalanced along many observed characteristics of schools and villages (largely because it included SAT feeders with the highest propensity scores that had no close CEB counterpart).
10.
The appendix also compares the ratio of variance across both groups. Prior to matching, 13 of 31 continuous variables had variance ratios outside the range of 0.5 and 2 (Rubin, 2001; Stuart, 2010), declining to 4 after matching.
11.
Guided by the national curriculum (Secretaría de Educación, 2003a, ![]() ), we gathered items from existing Honduran assessments, as well as publicly released items from achievement tests in Chile and Mexico. A Honduran panel of curriculum and testing experts reviewed the items to ensure curricular coverage and item accuracy. We piloted sixth-grade items in August 2008 in a sample of primary schools not included in this study. We piloted seventh- and eighth-grade items in August 2009 in a sample of SATs and CEBs not included in this study. The selection of baseline test items was based on the items’ difficulty, discrimination, and curricular coverage. Across all test forms used in the study, Cronbach’s alpha ranged from .79 to .85. The development of the assessments privileged validity, especially in the representation of the Honduran curriculum, instead of focusing on maximizing reliability. The latter could have been achieved by eliminating content areas. As inference is conducted at the group level, we opted in this instance to accept lower reliability in exchange for higher validity.
), we gathered items from existing Honduran assessments, as well as publicly released items from achievement tests in Chile and Mexico. A Honduran panel of curriculum and testing experts reviewed the items to ensure curricular coverage and item accuracy. We piloted sixth-grade items in August 2008 in a sample of primary schools not included in this study. We piloted seventh- and eighth-grade items in August 2009 in a sample of SATs and CEBs not included in this study. The selection of baseline test items was based on the items’ difficulty, discrimination, and curricular coverage. Across all test forms used in the study, Cronbach’s alpha ranged from .79 to .85. The development of the assessments privileged validity, especially in the representation of the Honduran curriculum, instead of focusing on maximizing reliability. The latter could have been achieved by eliminating content areas. As inference is conducted at the group level, we opted in this instance to accept lower reliability in exchange for higher validity.
12.
The short forms were created by selecting a subset of items from the sixth grade test that accommodated the following three constraints: (a) difficulty (medium to low part of the item distribution), (b) discrimination (selecting among the items with higher biserial correlation), and (c) coverage of a variety of content from the sixth-grade curriculum.
13.
Overall, 254 (255) students took language (mathematics) form C in 2009; 316 (301) students took language (mathematics) form C in 2010. In the subsample of children taking form C in each year, there were no statistically significant correlations between baseline variables and whether they took a language or mathematics test.
14.
Child and parent variables are from the baseline questionnaires. When baseline data are missing, they are imputed with observations from follow-up surveys when variables are plausibly time invariant (e.g., gender and parental schooling).
15.
Jones (1996) shows that dummy-variable adjustment for missing data yields biased estimates unless the key independent variable (e.g., a treatment indicator) is uncorrelated with the independent variable that is missing data (e.g., a baseline test score). Consistent with this, the simulations in Puma, Olsen, Bell, and Price (2009) show that such adjustments perform well in settings in which independent variables with missing values are balanced across treatment and control groups. In addition to dummy-variable adjustment, we also report estimates using a multiple imputation procedure.
16.
When the dependent variable is a test score, the weight is
17.
18.
After controlling for department dummy variables, the difference declines to 0.05 and is not statistically significant.
19.
This is disappointing in light of a nationwide textbook distribution campaign, but is consistent with a national teacher survey showing that primary schools in the departments of Atlántida, Intibucá, and Lempira still had relatively lower endowments of resources just before this article’s 2008 baseline (Secretaría de Educación, 2009).
20.
Students are not identified as attritors if they competed one test of the short form C, as these students were randomly chosen to do so; regression analyses include weights to account for sampling, as described in the text. Attrition rates are lower for child enrollment (3% and 8% in 2009 and 2010, respectively) and child work (8% and 12%), largely because of efforts to contact the baseline sample by cell phone.
21.
The sample included 661 baseline students in 2009 and 613 in 2010. Standard errors are clustered within schools. The results are similar if quadratic or cubic polynomials of the running variable proxy are included.
22.
One could estimate the causal effect of enrolling in a SAT (vs. not enrolling at all) on test scores, by instrumenting enrollment with Closed in a two-stage least squares analysis, and controlling for Running in both stages. We did so, but the imprecise estimates had confidence intervals consistent with large positive or negative effects of enrollment on test scores.
23.
The dependent variable in Table 3 indicates enrollment in any school, primarily the local SAT or CEB located in a village. However, students may choose to enroll in a more distant option such as an Instituto (see Table 1, Panel A). In 2009, 16% of children in SAT villages enrolled in a non-local option, compared with 5% in CEB villages, and these figures were unchanged in 2010. As families likely face higher opportunity costs of enrolling in more distant schools, it is plausible that some households in SAT villages perceive a larger quality differential between local and non-local alternatives than their counterparts in CEB villages, although this may or may not be consistent with the true causal effects of each school type on learning. ![]() (Panel B) presents descriptive statistics on schools and teachers in SATs and CEBs, and these suggest lower observed quality for some variables (e.g., teachers’ formal schooling) and higher quality for others (e.g., availability of textbooks).
(Panel B) presents descriptive statistics on schools and teachers in SATs and CEBs, and these suggest lower observed quality for some variables (e.g., teachers’ formal schooling) and higher quality for others (e.g., availability of textbooks).
24.
We imputed missing values for all baseline and follow-up variables using ICE (imputation using chained equations), as implemented in Stata 12.1. We used all student variables, as well as SATVILLAGE and department dummy variables, to obtain 20 imputations. The estimates reported in the text apply ![]() combination rules.
combination rules.
25.
We only use imputed values of the dependent variable when missing test scores are due to attrition, and not the random sampling procedure described previously. Estimates are still weighted by T.
26.
In the regression in ![]() (Panel A, column 5), a one standard deviation increase in baseline language scores is associated with a 0.06 increase in the probability of 2010 enrollment, all else equal. Other statistically significant effects include an additional year of age at the baseline (−0.05), a one standard deviation increase in a household asset index (0.05), a year of mothers’ schooling (0.01), another room in the dwelling (0.03), a dirt floor in dwelling (−0.07), and a sewer/septic connection (0.07). Although these coefficients do not necessarily have a causal interpretation, they are consistent with the idea that household socioeconomic status and students’ baseline achievement are strongly associated with the decision to enroll in a post-primary grade.
(Panel A, column 5), a one standard deviation increase in baseline language scores is associated with a 0.06 increase in the probability of 2010 enrollment, all else equal. Other statistically significant effects include an additional year of age at the baseline (−0.05), a one standard deviation increase in a household asset index (0.05), a year of mothers’ schooling (0.01), another room in the dwelling (0.03), a dirt floor in dwelling (−0.07), and a sewer/septic connection (0.07). Although these coefficients do not necessarily have a causal interpretation, they are consistent with the idea that household socioeconomic status and students’ baseline achievement are strongly associated with the decision to enroll in a post-primary grade.
27.
28.
The quantile regressions and the ordinary least squares (OLS) regression in each panel control for a subset of independent variables that are strong predictors of test scores in the specifications of ![]() , including baseline test scores, any repeated primary grade, mother’s schooling, the household asset index, and department dummy variables.
, including baseline test scores, any repeated primary grade, mother’s schooling, the household asset index, and department dummy variables.
29.
We conducted approximately 40 hours of classroom observation and took extensive field notes at four CEB and four SAT sites. These observations were informed by a classroom observation guide designed by our research team, focusing on classroom climate, pedagogical considerations, and classroom management. The full results from the qualitative data will be reported in a separate article.
30.
According to principals, SATs offer about half an hour less of instructional time per day, although this includes time devoted to the school meal. Essentially all CEBs offer this, while only one fifth of SATs do.
31.
In the only pure class size reduction experiment in a developing country, reducing class sizes by 50% (from a base of 80 students) did not affect test scores (Duflo, Dupas, & Kremer, 2012).
32.
The teacher costs impute a fringe benefit cost of 10% of annual wages to all teachers who are “tenured” civil servants.
33.
The mean difference in costs is estimated in a pooled, stacked sample of 2009 and 2010 school-level observations. The dependent variable is the log of the cost variable. The regression includes pairs fixed effects in addition to dummy variables for school type and the follow-up year. Standard errors are adjusted for school-level clustering.
34.
In SATs, this is mainly the wage bill of personnel who conduct training and supervision. This includes field supervisors (1 for every 10 SAT groups) and coordinators (1 for every 30 groups). Overall, it is 22% of the teacher wage bill. In CEBs, it includes a more amorphous category of administrative expenses in local department offices. We conservatively assume it is 20% of the teacher wage bill.
Authors
PATRICK J. MCEWAN is an associate professor of economics at Wellesley College. His research interests include the economics of education, education policy in Latin America, and applied econometrics.
ERIN MURPHY-GRAHAM is an associate adjunct professor at the Graduate School of Education, University of California, Berkeley. Her research interests include alternative secondary education in Central America, education and women’s empowerment, and program evaluation.
DAVID TORRES IRRIBARRA is a PhD candidate in quantitative methods and evaluation at the Graduate School of Education, University of California, Berkeley, and the ad interim IT director at the BEAR Center. His research interests include latent variable modeling and the theoretical foundations of assessment in the social sciences.
CLAUDIA AGUILAR is an associate professor of mathematics education at the Universidad Pedagógica Nacional Francisco Morazán in Honduras. Her research interests include curriculum development, mathematics education, and the assessment of student learning.
RENÁN RÁPALO is an associate professor of education at the Universidad Pedagógica Nacional Francisco Morazán in Honduras. His research interests include development economics, education policy in Latin America and program evaluation.