



Abstract
In this districtwide scale-up, we randomly assigned seventh-grade students within 11 schools to receive a series of writing exercises designed to promote values affirmation. Impacts on cumulative seventh-grade grade point average (GPA) for the district’s racial/ethnic minority students who may be subject to stereotype threat are consistent with but smaller than those from prior smaller scale studies. Also, we find some evidence of impact on minority students’ standardized mathematics test scores. These effects address a substantial portion of the achievement gap unexplained by demographics and prior achievement—the portion of the gap potentially attributable to stereotype threat. Our results suggest that persistent achievement gaps, which may be explained by subtle social and psychological phenomena, can be mitigated by brief, yet theoretically precise, social-psychological interventions.
Indeed, of the numerous theories that have been advanced in the literature to explain the persistent inequalities in academic achievement between African American and Hispanic students and their White peers, stereotype threat (C. M. Steele & Aronson, 1995) simultaneously offers a compelling explanation for these achievement gaps and an avenue to intervene and narrow them. Stereotype threat systematically undermines the performance of negatively stereotyped individuals, such as African Americans and Hispanics in academic subjects or women in mathematics. In this way, individual psychological processes in response to socially constructed stereotypes may contribute to persistent social inequalities (C. M. Steele & Aronson, 2004). A number of interventions have been developed to mitigate the harm produced by stereotype threat in real-world settings, including schools (Cohen et al., 2006; Good, Aronson, & Inzlicht, 2003; Walton & Cohen, 2007; Yeager & Walton, 2011). One of the most promising of these interventions focuses on student self-affirmation (Liu & Steele, 1986; C. M. Steele, 1988; C. M. Steele & Liu, 1983) through expressive writing. Prior research conducted in three classrooms in a single school found that values affirmation reduced the gap in grade point average (GPA) between Black and White students by 40% (Cohen et al., 2006), an effect that persisted over 2 years (Cohen et al., 2009).
In this article, we report on the initial findings from the first districtwide evaluation of a values-affirmation writing intervention developed by Cohen and his colleagues. This study offers two major advances to literature on the social-psychological dimensions of racial/ethnic achievement gaps. First, the intervention was conducted in all of the middle schools in a single school district, making it the most expansive single test of such interventions among secondary students to date. The scale of this initiative offers a realistic field-based appraisal of the potential impacts of self-affirmation on racial/ethnic minority students. Some but not all of these students suffer from stereotype threat, which is likely to result in a lower bound estimate of the impact of stereotype threat and self-affirmation on non-White students. Second, in addition to GPA, we investigate the potential impacts of self-affirmation on standardized achievement tests administered at the beginning and the end of the school year. These additional outcomes illustrate how stereotype threat and self-affirmation can influence test performance in real-world settings and how the impacts of self-affirmation may unfold during the school year.
We find that students who may be subject to racial/ethnic stereotype threats respond positively to self-affirmation. We find evidence that self-affirmation positively influences cumulative student GPA among potentially threatened students, which is consistent with the original study findings (Cohen et al., 2006; Cohen et al., 2009). There is no evidence of an impact on reading achievement, but self-affirmation does show promise for improving the achievement of students who may suffer from stereotype threat in mathematics.
Background
A Pattern of Disengagement
GPA, motivation, academic engagement, and achievement goals appear to decline during middle school for all students, and African American and Latino students appear to suffer steeper declines in school performance than their Asian and White peers (Anderman, 2003; Borman, Stringfield, & Rachuba, 2000; Cook, Purdie-Vaughns, Garcia, & Cohen, 2012; Sherman et al., 2013; Shim, Ryan, & Anderson, 2008). 1 Student achievement appears to mirror this trend. Although there are empirical exceptions (see Reardon & Galindo, 2009), substantial evidence suggests that achievement gaps between White and non-White students persist and even grow as they progress through school (Benson & Borman, 2010; Downey, von Hippel, & Broh, 2004; Fryer & Levitt, 2004; Jencks & Phillips, 1998). The National Assessment of Educational Progress (NAEP) shows that achievement gaps persist between Black and White students (Vanneman, Hamilton, Baldwin Anderson, & Rahman, 2009) and between Hispanic and White students (Hemphill, Vanneman, & Rahman, 2011) and that differences in mathematics (but not reading) achievement appear to grow between age 9 and age 13. Recent work in social psychology suggests that stereotype threat may contribute to these patterns of disengagement and inequality.
Stereotype Threat
Claude Steele and Joshua Aronson coined the term “stereotype threat” in a seminal article published in 1995. As they originally described,
[W]henever African American students perform an explicitly scholastic or intellectual task, they face the threat of confirming or being judged by a negative societal stereotype—a suspicion—about their group’s intellectual ability and competence. . . . And the self-threat it causes—through a variety of mechanisms—may interfere with the intellectual functioning of these students, particularly during standardized tests. (p. 797)
Stereotype threat also has been shown to affect stereotyped individuals’ performance in a number of domains beyond academics, such as White men in sports (e.g., Stone, Lynch, Sjomeling, & Darley, 1999), homosexual men in providing child care (Bosson, Haymovitz, & Pinel, 2004), and women in negotiation (Kray, Galinsky, & Thompson, 2002), but within the academic realm, it is thought to depress the performance of women in mathematics and related fields and African Americans and other non-Asian racial/ethnic groups in all academic areas. Students who are aware that they belong to a group that is perceived to perform poorly academically often fear behaving in a way that fits the negative cultural image associated with a group stereotype, thereby marking them as inferior. This largely unconscious fear elicits anxiety and other counterproductive responses that can severely interfere with thinking and performance on standardized tests or other evaluative activities in the classroom.
Although evidence continues to accumulate regarding the specific mechanisms through which stereotype threat depresses academic performance, most researchers agree that physiological and psychological mechanisms such as stress responses, self-monitoring, and self-regulation are at play (Schmader, Johns, & Forbes, 2008), which are in turn manifest in test-taking behaviors (Scherbaum, Blanshetyn, Marshall-Wolp, McCue, & Strauss, 2011). In addition, Aronson (2002) noted that perceptions of negative stereotypes lead many individuals to engage in activities such as self-handicapping (Smith, 2004), challenge avoidance (Good et al., 2003), and self-suppression (Pronin, Steele, & Ross, 2004; C. M. Steele, 1997). Beyond these correlates with poor academic performance, stereotype threat has also been linked to high blood pressure among African Americans (Blascovich, Spencer, Quinn, & Steele, 2001) and social distancing, particularly from the stigmatized social group of which the participants are members (Pronin et al., 2004). Meta-analyses of dozens of laboratory experiments suggest that standard measures of ability underestimate the true abilities of Black and Latino students by about one quarter of a standard deviation (Nguyen & Ryan, 2008; Walton & Cohen, 2003). A meta-analysis of field experiments suggests that the psychological threats that African American and Hispanic students suffer while taking standardized tests cause them to underperform by one fifth of a standard deviation (Walton & Spencer, 2009).
Recent work has extended the initial concern with performance to address how stereotype threat might implicate ongoing learning. In other words, stereotype threat may be a form of “double jeopardy” that interferes with both short-term performance and long-term knowledge acquisition (Taylor & Walton, 2011). Boucher, Rydell, Van Loo, and Rydell (2012) found that the mathematics learning of women—but not men—was compromised by negative stereotypes about women’s math ability. Also, Taylor and Walton (2011) found that African American students—but not White students—who studied under threatening conditions fared worse on a follow-up assessment that was conducted under nonthreatening conditions. The implication of these findings is that removing threats during evaluative situations alone will not be sufficient if negative stereotypes are pervasive. Short-term underperformance due to stereotype threat may lead students to alter their career and/or professional aspirations and their sense of belonging in academic domains and contexts (J. Steele, James, & Barnett, 2002) and to “protectively disidentify” from academics (Aronson, 2002; Major, Spencer, Schmader, Wolfe, & Crocker, 1998; C. M. Steele, 1997), which in turn could lead to increasing learning deficits (Appel & Kronberger, 2012). In this way, disengagement with the task or the context in which the task is to be performed can lead to growing disadvantages among negatively stereotyped students and may play a prominent role in the patterns of disengagement and widening achievement gaps.
Members of nonstereotyped groups may also respond to stereotypes, although in their case their performance is boosted by “stereotype lift,” the converse of stereotype threat (Walton & Cohen, 2003). Introducing negative stereotypes about other groups—which happens “more or less automatically” during evaluative tests (Walton & Cohen, 2003, p. 456)—may improve performance unless the negative stereotype is removed. This phenomenon has been observed in laboratory settings but not in field experiments. Although it is possible that removing the effect of stereotype threat could negatively affect the performance of White and Asian students, field experiments have not revealed a trade-off between the performance of White students and African American or Latino students (Cohen et al., 2006; Cohen et al., 2009; Sherman et al., 2013). The possibility, however, suggests that we should evaluate whether an intervention to reduce stereotype threat influences all student subgroups.
Self-Affirmation
Self-affirmation (Liu & Steele, 1986; C. M. Steele, 1988; C. M. Steele & Liu, 1983) is one way in which students may be able to cope with stereotype threat in a productive way. Closely related to “compensatory self-inflation” (Greenberg & Pyszczynski, 1985), self-affirmation helps individuals bolster other dimensions of their self-worth to compensate for the harm done by stereotype threat (Sherman & Cohen, 2006; C. M. Steele, 1988). In the absence of a means to repair their self-image, students may respond to stereotype threat in defensive and unproductive ways, such as disidentification with academics (Appel & Kronberger, 2012; Sherman & Cohen, 2006).
Values affirmation—in which individuals focus on things that are important to them—is an especially promising form of self-affirmation that has been shown to have beneficial effects on numerous outcomes in laboratory experiments, mostly involving undergraduate students in the United States (McQueen & Klein, 2006). 2 Because self-worth is multidimensional (Crocker & Wolfe, 2001), individuals can compensate in one area—that is, values—for a deficit in another—that is, group identity—and thereby maintain a positive overall sense of themselves (Sherman & Cohen, 2006). There are a number of ways to engage in values affirmation, but expressive writing is the most commonly used approach, especially among large groups of students as one would find in a school setting (Yeager & Walton, 2011).
One field-based trial of self-affirmation exercises, in particular, is of key policy and evaluative concern; because of its relatively brief and simple administration yet remarkably positive results, it has garnered a great deal of both positive attention and skepticism. In results published in Science, Geoffrey Cohen and his colleagues (Cohen et al., 2006; Cohen et al., 2009) reported that brief self-affirmation tasks aimed at affirming students’ personal values reduced the Black–White GPA gap by as much as 40%. Specifically, having middle school students write a series of brief essays affirming their personal values over the course of the school year improved the performance of African American students in four core academic subjects: science, social studies, math, and English. The three classrooms in a suburban northeastern middle school in which the research took place were composed of approximately half African American and half European American students. The seventh-grade students were placed at random into intervention and comparison groups near the start of the school year. Both groups were given structured 15-min writing assignments a total of 3 to 4 times during the academic year. These assignments primed the students to think about important qualities and values; students selected three values (e.g., sports talent, family, sense of humor) and explained in writing why they were personally important. Compared with control group students (who wrote about other non-self-affirming topics, such as why values they considered unimportant might be important to others), the African American students in the affirmation group had substantially higher GPAs, both during the school year in which the interventions were deployed (Cohen et al., 2006) and 2 years later (Cohen et al., 2009).
How might a relatively small and inexpensive intervention lead to such substantial changes in academic performance? As proximal, relatively “quick wins” accumulate, the researchers note that recursive processes acting like chain reactions then carry forward the initial effects of the intervention (Cohen et al., 2009). As Purdie-Vaughns and her colleagues (2009) argued, a small improvement early in the year due to the intervention might, for example, give children a little extra confidence, and this confidence might lead to further gains in performance in a repeating cycle. Teachers may also play a role. Even though they do not know the experimental condition to which students were randomized, small early improvements may cause teachers to see students as more able and worthy of attention and mentoring, thus amplifying the effects of the invention via teacher expectancy effects (Purdie-Vaughns et al., 2009).
Indeed, the greatest impacts of self-affirmation came in the final term of the school year, which Cohen and his colleagues offer as evidence of a beneficial recursive process for students exposed to the self-affirmation intervention: “Findings suggest that because initial psychological states and performance determine later outcomes by providing a baseline and initial trajectory for a recursive process, apparently small but early alterations in trajectory can have long-term effects” (Cohen et al., 2009, p. 400). By enhancing students’ feelings of personal worth, the authors surmised, the exercise changed their perception of bias at school and shifted how they interpreted their academic successes and failures. These steps particularly protected African American students who had been struggling in school. Instead of feeling discouraged and falling into a pattern of disengagement, it as though the psychologists gave Black students an inoculation against the threat presented by negative stereotypes.
This research—which was reviewed by the What Works Clearinghouse (WWC) and deemed consistent with WWC evidence standards (WWC, 2010)—demonstrated that African American students who completed the writing exercises about their values increased their average seventh- and eighth-grade GPA by a quarter of a letter grade (0.24 points), a change that was statistically significant and equivalent to an effect size of approximately d = 0.30. Among low-achieving African American students, the effect was somewhat larger, with an increase in average seventh- and eighth-grade GPA of 0.41 points. In addition, the intervention reduced the likelihood that low-achieving African American students would be assigned to a remedial program or retained in grade (5% vs. 18%). The intervention did not have a statistically significant effect on the academic outcomes of White students.
More recently, Sherman et al. (2013) reported on a similar long-term field experiment of self-affirmation conducted with Latino and White students. The authors reported findings from two studies from two schools in which they randomly assigned values-affirmation writing exercises to White and Latino students and treated GPA as the outcome of interest (by term and cumulatively). The authors observed no treatment effect for GPA among the White students, but affirmed Latino students had higher GPAs than nonaffirmed, control Latino students. In Study 1, the cumulative GPA of affirmed Latino middle school students (Grades 6–8) was 0.22 points higher than nonaffirmed Latino students at the end of the first year, representing a 22% reduction in the initial White/Latino GPA gap, a difference that persisted for the 3-year duration of the study (Sherman et al., 2013). At the end of the first year of Study 2, the cumulative GPA among affirmed Latino seventh-grade students was 0.38 points higher than that of nonaffirmed Latino control students, which represents approximately a 30% reduction in the White–Latino GPA gap (Sherman et al., 2013). The direction and magnitude of the impacts of self-affirmation found by Sherman and his colleagues (2013) among Latino students are similar to those found by Cohen and his colleagues (2006, 2009) among African American students. Stereotype threat appears to influence both African American and Latino students, and interventions to address stereotype threat appear to benefit both African American and Latino students similarly (Cohen et al., 2006; Cohen et al., 2009; Good et al., 2003; Sherman et al., 2013).
Scaling Up Self-Affirmation
Our districtwide sample includes both African American and Latino students, and we have little theoretical or empirical reason to believe that the two groups will respond to self-affirmation significantly differently from one another, on average. Consequently, in our analyses, we contrast two groups of students: those who are potentially subject to stereotype threat and those who are not potentially subject to stereotype threat. We deliberately use the word potentially because we recognize that these racial/ethnic classifications are merely proxies for students who are suffering from stereotype threat. Not all students who could experience stereotype threat in fact do experience it. Stereotype threat includes a number of boundary conditions that we cannot identify in the field, such as awareness of the stereotype (C. M. Steele & Aronson, 1995) or identification with the domain (Aronson et al., 1999). Laboratory experiments can screen participants on these conditions, but field experiments cannot do so as readily. The students we identify as being potentially subject to stereotype threat—and therefore potentially benefiting from self-affirmation—will vary substantially in their susceptibility to stereotype threat and their responses to the self-affirmation treatment. We can, however, evaluate the extent to which self-affirmation benefits, on average, a sample of students who are potentially suffering from stereotype threat and evaluate whether they benefit from being assigned self-affirmation writing exercises in school. As a result, our results offer a conservative estimate of the impact of self-affirmation on students who are subject to stereotype threat because, presumably, the larger effects of self-affirmation on threatened students may be diluted by the null effects on nonthreatened students.
This estimate, however, offers a realistic expectation of what a district with large achievement gaps might expect if it introduces these activities to its curriculum. Recent evidence from the NAEP suggests that the academic achievement gaps between Whites and Blacks (Vanneman et al., 2009) and Whites and Hispanics (Hemphill et al., 2011) in Wisconsin—where the experiment was conducted—are among the largest in the United States. If the results from this remarkably inexpensive and relatively simple intervention can be replicated and better understood, it could hold tremendous potential for closing persistent achievement gaps both in Wisconsin and in the United States.
Our overarching research question—Can self-affirmation mitigate the effects of stereotype threat on non-White students in a real-world setting?—is applied to several standard measures of students’ academic performance. Three measures of school success provide distinct evidence concerning how self-affirmation may affect both learning and test performance. As our literature review suggested, stereotype threat may operate through two distinct mechanisms: by increasing test anxiety and thus lowering the validity of test scores and by provoking academic disengagement and thus reducing actual learning. Our analyses of the cumulative effects of self-affirmation on year-end GPA assess the potential for self-affirmation to operate recursively—potentially affecting learning—as suggested by the work of Cohen et al. (2009), Sherman et al. (2013), and Taylor and Walton (2011). In separate analyses, we assess impacts on a fall standardized test given after a low dosage of treatment and a spring standardized test after a higher dosage. Specifically, we ask (a) to what extent two doses of the affirmation intervention affect reading and mathematics scores on a state standardized test; (b) the extent to which four doses affect reading, language use, and mathematics scores on a different standardized test; and (c) the extent to which four doses affect the cumulative GPA of seventh-grade students. We test two hypotheses for each of these three outcome measures.
Prior research generally finds no impact of self-affirmation on these students (primarily White; Cohen et al., 2006; Cohen et al., 2009; Sherman et al., 2013), but the possibility of “stereotype lift” suggests that the impact of self-affirmation could be negative for White and Asian students (Walton & Cohen, 2003). Our null hypothesis is that there is no difference associated with affirmation for students who are not potentially subject to stereotype threat. We evaluate this hypothesis with the “self-affirmation” estimates in the statistical models that interact an indicator of students’ status as a potentially threatened racial/ethnic minority with assignment to self-affirmation. A related question is whether self-affirmation affects all students on average regardless of their racial/ethnic background, which we evaluate in models that do not include interaction terms.
Prior research suggests that African American and Latino students respond differently to self-affirmation than White students (Cohen et al., 2006; Cohen et al., 2009; Sherman et al., 2013). Our null hypothesis is that all students respond equivalently to self-affirmation regardless of their racial/ethnic background. We evaluate this hypothesis with a statistical interaction term between treatment condition and an indicator of students’ status as a potentially threatened racial/ethnic minority. We also ask a closely related question: Is there a self-affirmation treatment effect for the subgroup of students who are potentially subject to stereotype threat? Prior research indicates self-affirmation positively affects the GPA of African American and Latino students (Cohen et al., 2006; Cohen et al., 2009; Sherman et al., 2013). Our null hypothesis is that there is no impact of self-affirmation on African American and Latino students. We evaluate this hypothesis by using a postestimation strategy to compute marginal effect estimates from our statistical interaction model, thereby providing estimates of the effects of self-affirmation for students who are potentially subject to stereotype threat.
Method
Madison Writing and Achievement Project (MWAP)
To evaluate these hypotheses, we use data from the MWAP, a multiyear, districtwide randomized field trial of self-affirmation writing conducted in the Madison Metropolitan School District (MMSD). The study involved the entire seventh grade in 2011–2012, which consisted of 80 classrooms taught by more than 50 teachers in 11 middle schools. To our knowledge, MWAP is the first evaluation of self-affirmation writing to be conducted across an entire school district. The design of the study is shown in Figure 1.
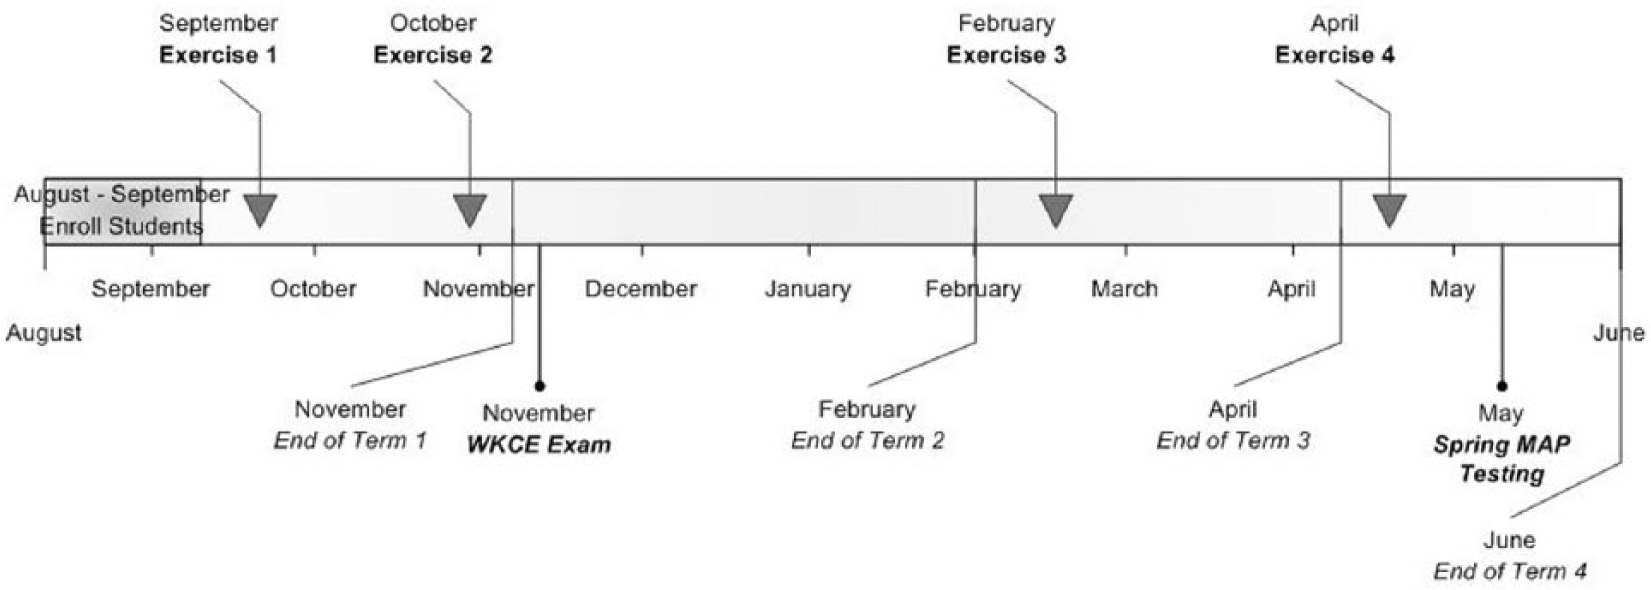
MWAP study design and data collection.
The intervention consisted of a sequence of four writing exercises students completed in school over the course of the school year. Following Cohen and his colleagues (2006, 2009; Sherman et al., 2013), one half of the students was randomly assigned to complete a self-affirmation writing exercise while the other half was assigned to a similar, but nonaffirming control writing exercise. We implemented a randomized block design, in which the 11 schools served as blocks, and randomization was conducted at the student level within each of the blocks. We randomized students after securing parental consent and student assent. The self-affirmation assignments varied slightly over the course of the year to maintain student interest. The first exercise took place as close to the beginning of the school year as was feasible (Cook et al., 2012; Critcher, Dunning, & Armor, 2010). The remaining exercises were intended to take place prior to assessments: the Wisconsin Knowledge and Concepts Exam (WKCE) in November and the Measures of Academic Progress (MAP) in February and May. Nonconsented students completed an expository writing exercise provided by the research team so that all students were writing at the same time.
The first two writing exercises were structured, the third was open-ended, and the fourth exercise was tailored to the student based on his or her choices in the first or second exercise (see Sherman et al., 2013). The structured exercises asked students to choose two or three items that are most important to them from an 11-item list, and the comparison students were offered an identical list and asked to identify the two or three least important items and write about how they might be important to someone else. 3 Both structured exercises included follow-up questions to reinforce their reflection. The open-ended exercise presented students with a paragraph summarizing the kinds of things that can be important to people, using examples from the structured exercise list. Students in the affirmation condition were then asked to describe something that is important to them. Students in the comparison condition were presented with a paragraph summarizing the kinds of things students do in the morning before they go to school and were asked to describe what they did that day before school. The tailored exercise presented an item that the student had chosen in the first two structured exercises and asked the student to reflect on it and describe how it is now important to them later on in the school year. The item we selected to present to each student in the tailored exercise was identified as the selection about which the student wrote most extensively in the second exercise. Students in the comparison condition wrote an expository essay describing what they do after school.
Our methods were intended to replicate, as closely as possible, the trainings and implementations conducted by Cohen and colleagues (Cohen et al., 2006, 2009). We worked with principals and teachers to develop final versions of the prompts, with the intention of offering intervention materials that resembled those that they would assign their students as normal instructional routine. The instructions and script provided to teachers were further intended to frame the writing activities as typical classroom activities, and our trainings and materials urged teachers to present the exercises as such and avoid any mention of the activity as an external research project. MMSD has adopted social-emotional standards, and schools and teachers may adopt strategies to raise attention to concerns similar to those addressed by self-affirmation, yet our anecdotal observations and continued interactions with the participating schools and staff revealed no other systematic efforts underway to address stereotype threat.
At the beginning of the school year, administrators at each school (principal and/or learning coordinator) decided which classrooms the intervention would be fielded in; seven schools elected for English/language arts classrooms and four chose homeroom classes. We provided brief training sessions (no more than 1 hour) with the corresponding teachers at each school. The training provided teachers with the instructions necessary to administer the exercises as intended and provided them with a script and responses to students’ frequently asked questions.
Teachers distributed the writing exercises to students during the school day as part of normal classroom activities, and each administration took 15 to 20 minutes. Students were provided with personalized copies of the exercises to maintain fidelity of the random assignment. Each exercise included an identical cover sheet to disguise the condition to which students were assigned, and all versions of the exercises were designed to have a similar appearance. Students completed the assignments quietly and independently; teachers collected completed exercises and eventually returned them to the research staff without reviewing student responses. Exchanges of materials were conducted via school administrators or, in the few cases in which research staff interacted directly with classroom teachers, when students were not present. Classroom teachers were not informed of the condition to which their students were assigned or of the study’s hypotheses (including any mention of stereotype threat). 4
Data
All student demographic and outcome data were provided to us by MMSD. We evaluate the impact of self-affirmation on three outcomes, each consistent with a different strain of stereotype threat theory. First, consistent with the original formulation of stereotype threat (C. M. Steele & Aronson, 1995), the evaluative, high-stakes nature of standardized tests may prove to be especially threatening to students (C. M. Steele & Aronson, 1995), which may curtail the performance of racial and ethnic minorities subject to stereotype threat. If self-affirmation buffers students from the impact of stereotypes and allows them to demonstrate their true abilities, this effect should be apparent on the WKCE. 5
Second, we can evaluate the potential “recursive” nature of self-affirmation (Cohen et al., 2009) by investigating impacts on students’ cumulative GPAs in seventh grade. GPA represents how classroom teachers feel students are meeting their expectations, and can reward not only knowledge and skill but also classroom participation, homework completion, attendance, and behavior (Coleman, 1997; Sizer, 1984). Grades, therefore, reveal how well students negotiate “both the social and pedagogical aspects” of a school (Schiller, 1999). MMSD provided student transcript data from sixth and seventh grade; the transcripts include each course the student was enrolled in and the letter grade the student earned in each of the four quarters of the school year. As shown in Figure 1, the report cards are filed at the end of each term, in November, February, April, and June. Following MMSD protocol, we compute a student’s GPA by translating the letter grade into a score (e.g., A = 4, B = 3, etc.) and then creating a weighted average based on the number of credits earned per course and quarter. 6
MMSD seventh graders also take the Northwest Evaluation Association MAP, a computer adaptive test administered at multiple time periods during the school year. 7 In practice, teachers may use the information from these formative assessments to help tailor instruction to individual students or classrooms. Students take three MAP tests (Reading, Language Usage, and Mathematics) in the fall and spring, and one MAP test (Reading) in the winter. Reading and Mathematics are self-explanatory; Language Usage covers writing and grammar. MAP scores are produced using a Rasch measurement model, which yields an equal-interval scale. The 2011–2012 school year was the first year of MAP adoption in MMSD, and some students in our analytical sample were randomized to self-affirmation after their fall MAP tests. For these two reasons, we use the spring 2012 MAP Reading, Language Usage, and Mathematics scores as outcomes. These scores inform both the original and recursive theories of stereotype threat; by the time of the spring assessment, the students had completed multiple self-affirmation exercises over the course of the year, including a final one shortly before the spring MAP testing. In addition, we believe that to the extent that self-affirmation buffers potentially stereotyped students and allows them to exhibit their true abilities on the earlier fall and winter formative assessments, that teachers using the data for formative purposes could develop more realistic insights into potentially stereotyped students’ academic capacities and, as a result, hold higher expectations for the students’ future performances in the classroom and on later standardized tests.
The most important variable for this analysis is an identifier of students who are potentially subject to stereotype threat, which we construct using administrative race/ethnicity data. We do not expect that all students will be affected by self-affirmation equally. In fact, prior research in middle schools has found no impact of self-affirmation on White students and substantial impacts on GPA for Black (Cohen et al., 2006; Cohen et al., 2009) and Latino students (Sherman et al., 2013). Our sample includes students identified as White, Asian, American Indian, African American, Hispanic, Pacific Islander, and students who identified with multiple groups. We expect that White and Asian American students are not threatened by academic stereotypes (and could benefit from stereotype lift) and that American Indian, African American, Hispanic, and Pacific Islander students may be subject to stereotype threat. 8
We divide the sample into two groups: students potentially subject to stereotype threat (American Indian, African American, Hispanic, and Pacific Islander) and students not subject to stereotype threat (White and Asian). Multiracial students are assigned to one of the two groups based on the racial/ethnic categories they identify. For example, multiracial students identified as African American and White or Asian and Hispanic are assigned to the group that is potentially vulnerable to stereotype threat, but multiracial students identified as White and Asian are not. 9 We also include indicators of student gender, free/reduced-price lunch status, limited English proficiency status, and disability status as statistical controls to improve the precision of our analytical models.
Sample
The official count on the third Friday of September 2011 tallied 1,706 seventh-grade students, all of whom were invited to participate in the study. Student enrollment began during student registration at each of the 11 middle schools in August 2011 prior to the start of the academic year. We obtained parental consent and student assent for 1,048 students (61%) by the end of October, prior to the administration of the second of the writing exercises. 10 These students constitute the baseline for our attrition analyses. The small number of students who enrolled in the study after the second writing exercise are not included in the analysis.
We conduct analyses on two samples, a GPA sample and a test score sample. The GPA sample includes 1,012 students with a GPA recorded in the fourth and final term of sixth grade (preintervention) and at least the first three terms of GPA data in seventh grade. 11 These students constitute 97% of the consented sample of 1,048 and 59% of the entire MMSD seventh-grade population of 1,706. The test score sample consists of 926 students with complete seventh-grade test scores (WKCE Reading, WKCE Mathematics, and spring MAP scores in Reading, Language Usage, and Mathematics) as well as sixth-grade outcomes for WKCE Reading and Mathematics. All students in both the GPA sample and test score sample also had complete demographic information. The number of consented students omitted due to missing data is relatively small and well-defined, namely, it is restricted to current MMSD students who moved into the district after November of their sixth-grade year and a small number of students who did not take both tests in seventh grade. Overall, missing data claimed 3% of the consented students for the GPA analysis and 12% of the students for the test score analysis. The rates of attrition due to missing data are equivalent by experimental condition, as well as by the experimental condition and potentially threatened status, in both the GPA and test score samples. 12
Descriptive statistics for the GPA sample are reported in Table 1 (an equivalent report for the test score sample is shown in Table A1 in the online appendix, available at http://epa.sagepub.com/supplemental). The first column of Table 1 shows the overall sample means and, for the prior measures of achievement, standard deviations. Fifty percent of the sample is female, 16% has been identified as having limited proficiency in English, 14% has been identified as requiring services for some form of disability, and 43% of the sample is eligible for free/reduced-price lunch. 13 Thirty-seven percent of the GPA sample is composed of students from racial/ethnic groups that could be subject to stereotype threat (Black, Hispanic, American Indian, Pacific Islander, or a Multiracial student identified as belonging to one of these categories). The standard deviations of the sixth-grade achievement test scores for the 926 students with available measures are 54.45 in Reading and 56.49 in Mathematics. Finally, the mean sixth-grade GPA in the sample is 3.24, with a standard deviation of 0.65.
Demographic and Prior Achievement Variables for Overall Sample and by Experimental Condition
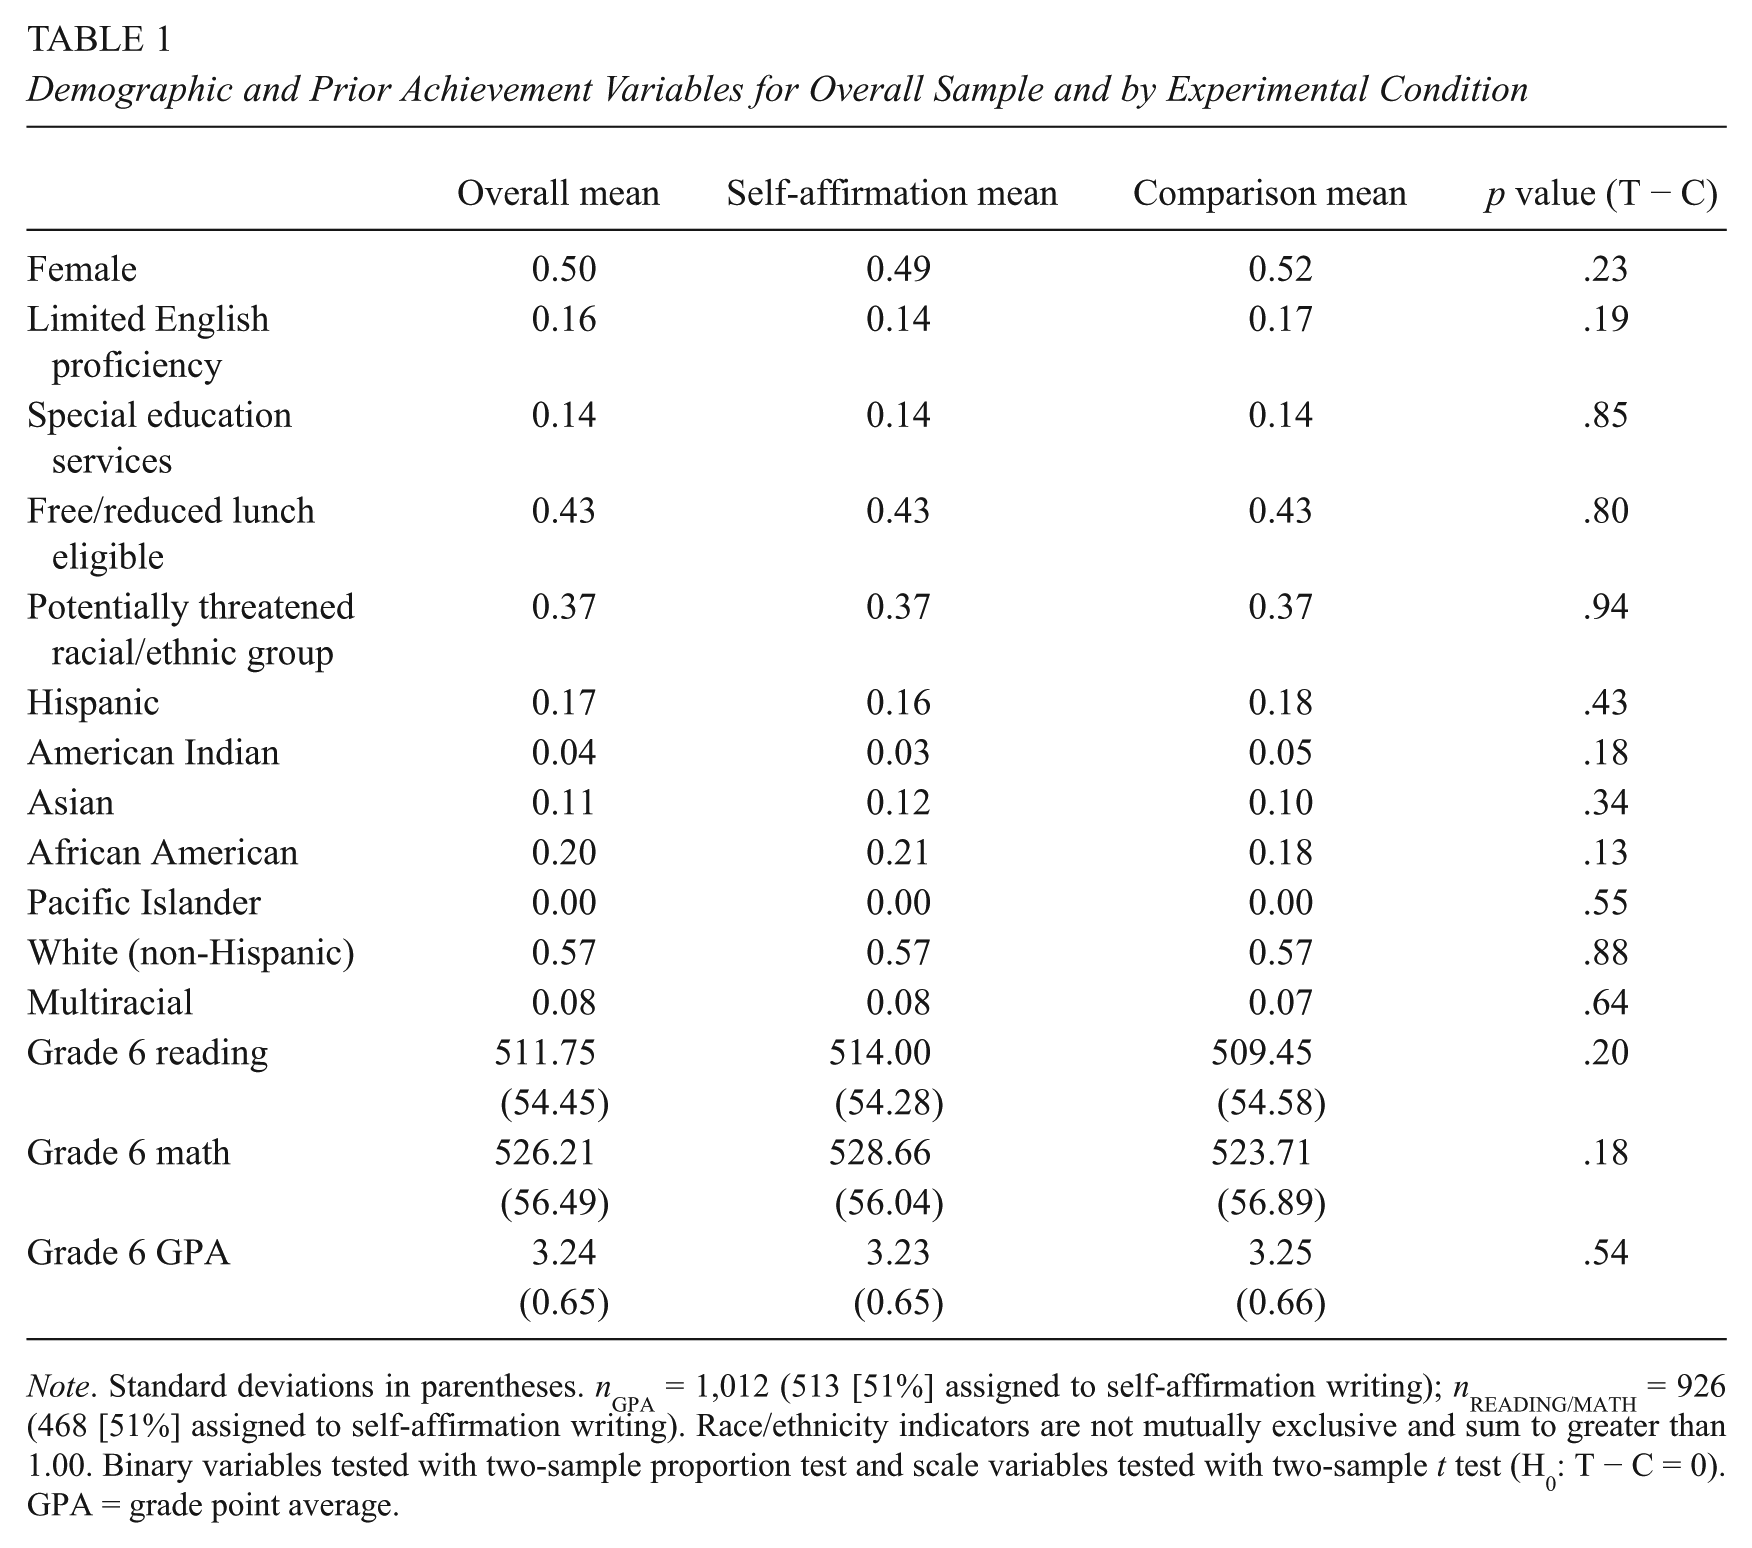
Note. Standard deviations in parentheses. nGPA = 1,012 (513 [51%] assigned to self-affirmation writing); nREADING/MATH = 926 (468 [51%] assigned to self-affirmation writing). Race/ethnicity indicators are not mutually exclusive and sum to greater than 1.00. Binary variables tested with two-sample proportion test and scale variables tested with two-sample t test (H0: T − C = 0). GPA = grade point average.
As Table 1 also shows, the experiment has good internal validity: The two experimental groups are balanced on demographics and prior achievement. The second and third columns show the means for the experimental conditions (self-affirmation vs. comparison) and the p values testing the differences between the experimental conditions. This information provides an indication of the baseline equivalence of the two groups and, thus, the internal validity of the experiment. None of the differences were statistically significant (see Tables 1 and A1). The self-affirmation group scored higher on the sixth-grade standardized tests, but the differences are not statistically significant and we use sixth-grade achievement as a control variable in our statistical models to address any potential imbalance in prior achievement and to increase statistical precision. The two groups were comparable with respect to sixth-grade GPA.
We also examine how similar the MWAP sample is to the population of MMSD seventh-grade students to evaluate the external validity of the sample. Demographic characteristics available for Grades 6 to 8 in MMSD suggest that the MWAP sample has a higher proportion of White students (55% vs. 44%) and a smaller proportion of students identified as Black (18% vs. 23%) and eligible for free/reduced-price lunch (43% vs. 52%). With respect to prior achievement, 53% and 49% of the MWAP sample scored at an “advanced” level on the Reading and Mathematics WKCE, respectively, as compared with the districtwide means of 43% and 40%. A comparable proportion of students scored at the “proficient” level, with 34% of the MWAP sample and 36% of the MMSD population achieving this performance level. A substantial proportion of the MWAP sample scored at the “minimal” or “basic” level in Reading and Mathematics, with 5% minimal in Reading, 12% minimal in Mathematics, 8% basic in Reading, and 9% basic in Mathematics. These rates were higher in MMSD overall, with 8% minimal in Reading, 19% minimal in Mathematics, 13% basic in Reading, and 11% basic in Mathematics. On the whole, the MWAP sample is somewhat more advantaged than the districtwide MMSD middle school population, but it still includes substantial numbers of poor students (as indicated by free or reduced-price lunch status), students with disabilities, English-language learners, and students at the low end of the achievement distribution.
As is shown in Table 2, membership in a potentially threatened racial/ethnic group is strongly associated with prior achievement. In other words, there is strong evidence of an unconditional racial/ethnic achievement gap in the MWAP sample. Potentially threatened students lag behind Asian and White students on all measures of preintervention, sixth-grade academic performance, including Reading and Mathematics test scores, and GPA. Specifically, potentially threatened groups score lower than Asian and White students by 50 scale score points in Reading, 52 points in Mathematics, and 0.66 GPA points. The nonthreatened students have an average GPA of 3.5 (B+/A–) and the potentially threatened students have an average GPA of 2.8 (B–). These unconditional gaps on measures of prior academic performance are equivalent in size to nearly one standard deviation.
Prior Achievement Gaps by Stereotype Threat Vulnerability
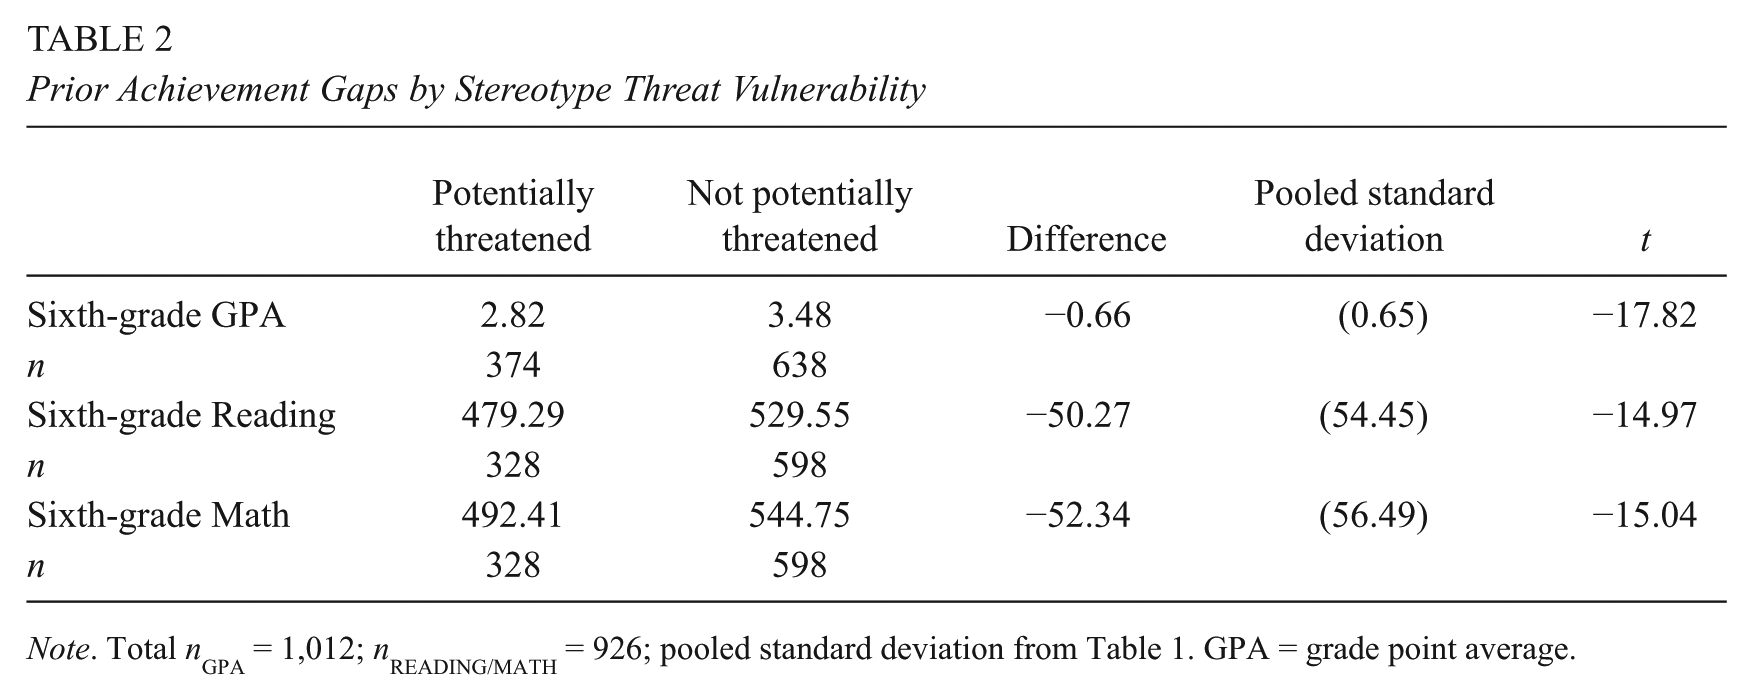
Note. Total nGPA = 1,012; nREADING/MATH = 926; pooled standard deviation from Table 1. GPA = grade point average.
Descriptive statistics for the seventh-grade outcome variables are shown in Table 3. As shown in Figure 1, the WKCE data were collected in November of the seventh-grade year and the GPA measures were collected at the end of each term. Cumulative seventh-grade GPA is shown along the top row, the WKCE scale scores in Reading and Mathematics are shown next, followed by the spring MAP scores in Reading, Language Usage, and Mathematics. A few features of these variables are worth noting. First, the mean values of the scale scores in Reading and Mathematics increased from sixth to seventh grade, but the mean GPA in the sample decreased from 3.24 in sixth grade (see Table 1) to 3.13 in seventh grade. 14 Data from each of the four terms comprising cumulative GPA show a slight decrease over the course of the year, from 3.20 and 3.22 in the first and second terms to 3.16 in both the third and fourth terms. This decline in mean GPA during middle school and during the academic year is both concerning and consistent with prior research (e.g., Anderman, 2003; Cook et al., 2012; Sherman et al., 2013).
Student Achievement Outcomes
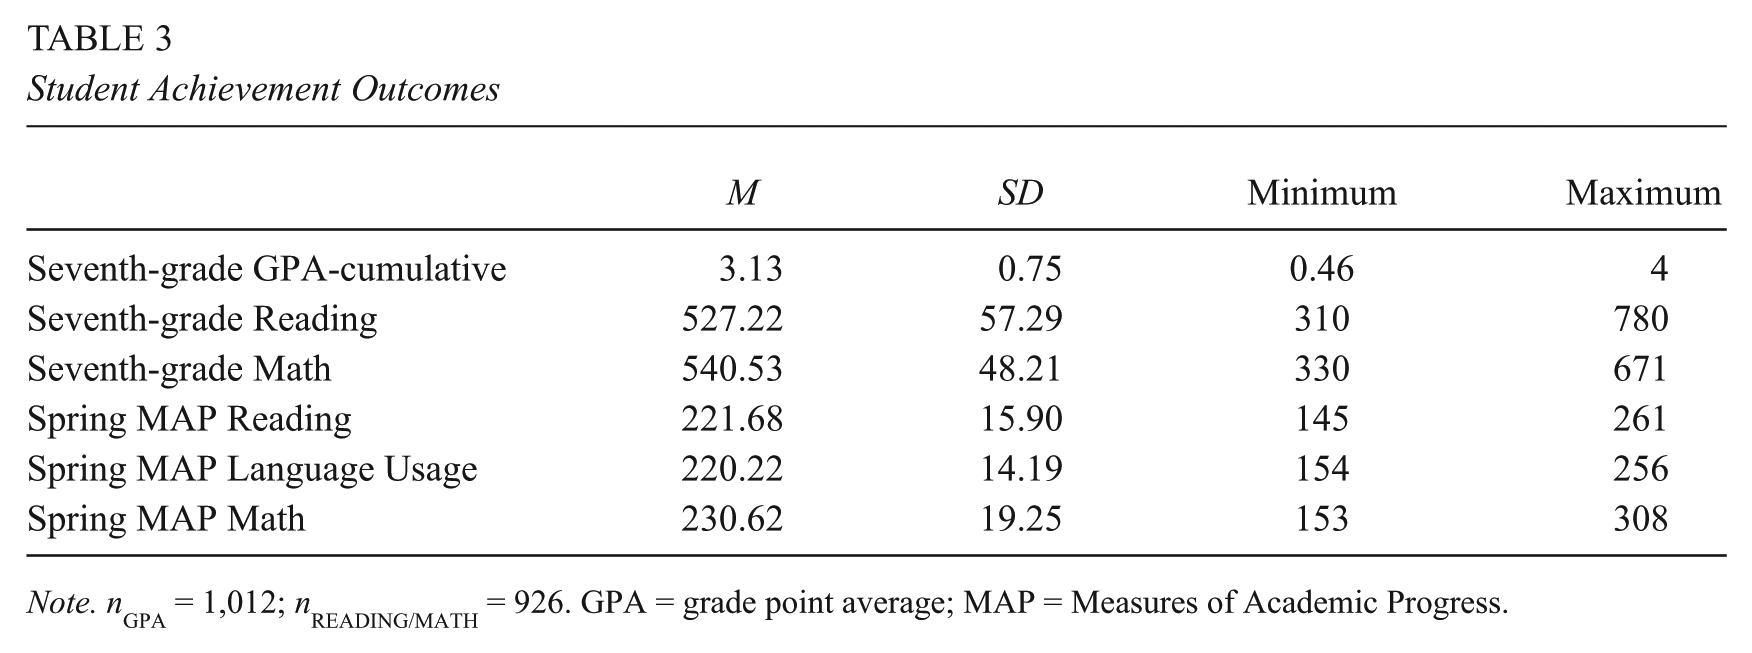
Note. nGPA = 1,012; nREADING/MATH = 926. GPA = grade point average; MAP = Measures of Academic Progress.
Analysis
To evaluate whether self-affirmation affected student achievement differentially by student racial/ethnic background, we estimated the following multilevel model in which assignment to self-affirmation interacts with student membership in a racial/ethnic group that is potentially subject to stereotype threat:

In this model,
The coefficient δ tells us whether potentially threatened students responded to self-affirmation differently than majority students responded. The coefficient γ for membership in a potentially threatened group tells us whether there is an achievement gap between majority and potentially threatened students net of the other covariates and absent the intervention. To determine whether self-affirmation has an impact on potentially threatened students, we estimate marginal effects of self-affirmation. We transform the parameter estimates from the impact model to estimate the average effect of self-affirmation for the students who are potentially subject to stereotype threat and the students who are not subject to stereotype threat, at the average values of each racial/ethnic group’s covariates. 15 We estimate these margins at the group means because the preexisting differences on some of the covariates—namely, prior achievement—are large. Given that potentially threatened students lag nonthreatened students by approximately one standard deviation, there are few examples of potentially threatened students with prior achievement at the sample mean. The full results from our statistical models are presented in the online appendix (Tables A2–A4 in the online appendix, available at http://epa.sagepub.com/supplemental); we present the marginal effect estimates and effect sizes in Table 4 and the GPA results in Figure 2. We calculated effect sizes using the overall standard deviations of the outcomes reported in Table 3.
Estimated Interactions Between Assignment to Self-Affirmation and Student Membership in a Racial/Ethnic Group That Is Potentially Subject to Stereotype Threat
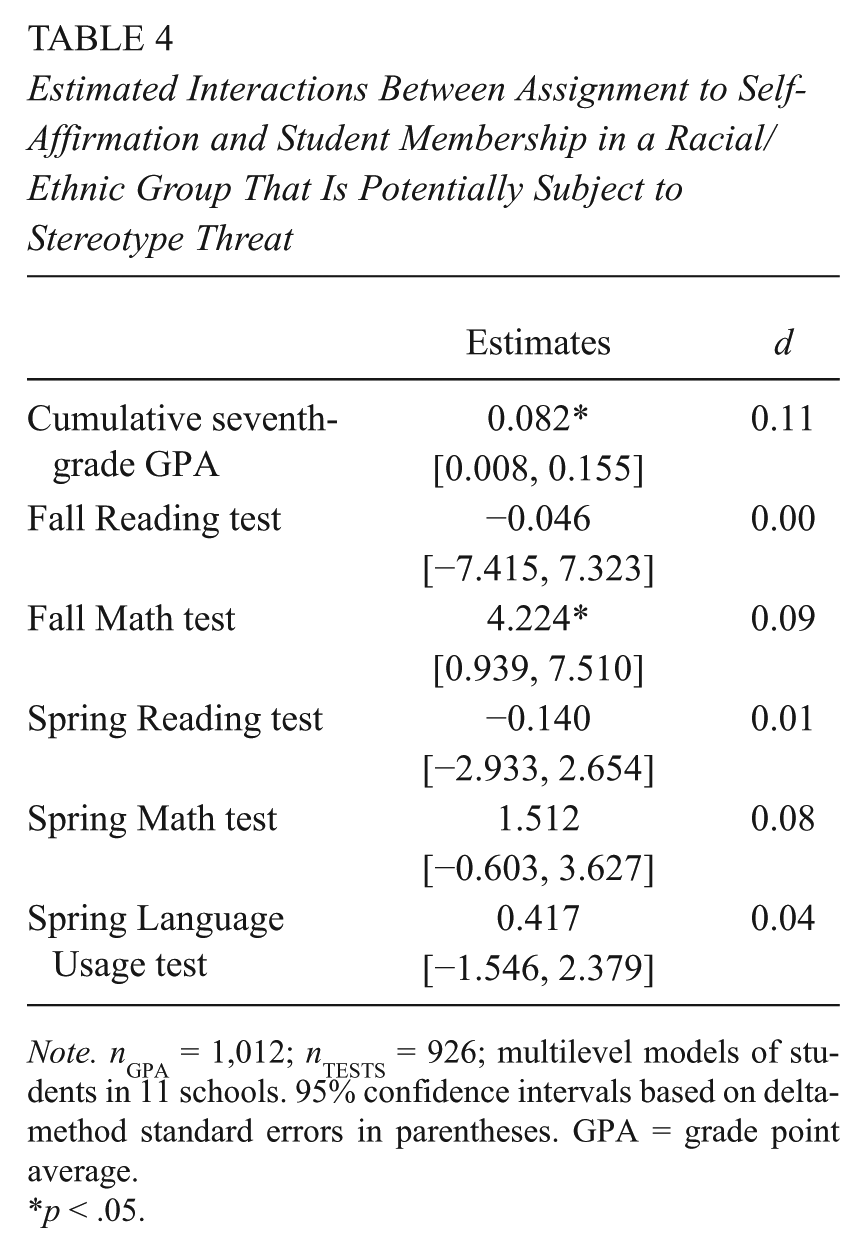
Note. nGPA = 1,012; nTESTS = 926; multilevel models of students in 11 schools. 95% confidence intervals based on delta-method standard errors in parentheses. GPA = grade point average.
p < .05.

GPA estimates by term, threat status, and experimental group.
Results
Our first set of research questions addressed whether self-affirmation affected all students, on average, as well as White and Asian students who were not potentially subject to stereotype threat. With one exception, the academic outcomes of affirmed and nonaffirmed students overall and of affirmed and nonaffirmed White and Asian students were statistically indistinguishable (see Tables A2–A4 in the online appendix, available at http://epa.sagepub.com/supplemental). The single exception was a positive and statistically significant impact estimate for all students on the spring Language Usage test (1.113; 95% confidence interval [CI] = [0.214, 2.012]). This is as we expected and is consistent with prior research as the response of self-affirmation is typically localized among students who are vulnerable to stereotype threat.
Our second set of questions investigated whether the impact of self-affirmation differed for students who were and were not potentially subject to stereotype threat and whether there was evidence of a net impact among the potentially threatened subgroup. Table 4 summarizes the interaction terms, δ, that test the differential responses to treatment by racial/ethnic background; the full results are shown as Model 2 in Tables A2 to A4 (in the online appendix, available at http://epa.sagepub.com/supplemental). Table A5 (in the online appendix, available at http://epa.sagepub.com/supplemental) reports the conditional margins—estimated at the group mean values of the covariates to recognize the large differences in prior achievement between the two groups—to evaluate the impact of self-affirmation among the potentially threatened subgroup.
GPA is the primary outcome examined and reported in prior research (Cohen et al., 2006; Cohen et al., 2009; Sherman et al., 2013). Consistent with prior research, we find differential impacts of self-affirmation on cumulative seventh-grade GPA. As shown in Table 4, the estimated interaction between self-affirmation and students’ potentially threatened racial/ethnic background is 0.82 (95% CI = [0.008, 0.155]), which corresponds to an effect size of 0.11. The marginal effect—the estimated impact of self-affirmation among the potentially threatened subgroup—is also statistically significant and of a similar magnitude (0.065; 95% CI = [0.001, 0.128]; see Table A5 in the online appendix, available at http://epa.sagepub.com/supplemental). Supplemental analyses show that—also consistent with prior research—most of this cumulative difference is manifested later in the school year. Figure 2, which shows the estimated margins for each of the four subgroups of interest, reveals the estimated marginal effect is largest in the final term of seventh grade (0.130; 95% CI = [0.039, 0.220]). As Figure 2 also shows, this difference is produced by a decline in GPA in the second half of the year, and especially in the fourth quarter, among students who were potentially vulnerable to stereotype threat and assigned to the control condition. If self-affirmation benefited students who were potentially vulnerable to stereotype threat, it did so by maintaining their GPA and heading off this decline. This is similar to the result noted by Sherman and his colleagues: The apparent benefit of self-affirmation is that it prevents the declines in performance that many students—especially those subject to stereotype threat—suffer (Sherman et al., 2013). Figure 2 also starkly illustrates the large differences in school performance across groups in the sample.
We extend the analysis of the potential effects of self-affirmation on academic outcomes to include standardized tests, both at the beginning and the end of seventh grade. We find suggestive evidence of impacts of self-affirmation for potentially threatened students on Mathematics standardized tests but not for the Reading or Language Usage outcomes. We begin with the state reading and mathematics tests, which students took in November 2011, shortly after the second writing exercise. The estimated interaction effect for Reading test scores is essentially zero (−0.046; 95% CI = [−7.415, 7.323]). For the fall Mathematics test outcome, though, we find that students identified as potentially subject to stereotype threat responded differently to self-affirmation; the estimated interaction is positive and statistically significant (4.224; 95% CI = [0.939, 7.510]). This interaction corresponds to an effect size of 0.09. The estimated marginal effect on the fall Mathematics standardized test is smaller and not statistically significant, however (2.948; 95% CI = [−0.043, 5.938]; d = 0.06). In other words, we find a statistically significant differential response to self-affirmation on fall Mathematics achievement but marginal evidence of a net impact of self-affirmation within the potentially threatened subgroup.
We also evaluate the impacts of self-affirmation on the spring 2012 MAP test outcomes for those students who may be vulnerable to stereotype threat. As with the fall Reading test, the estimated interaction effect for the spring Reading outcome is close to 0 (−0.140; 95% CI = [−2.933, 2.654]). The estimated interaction effect for Language Usage is also small and not statistically significant (0.417; 95% CI = [−1.546, 2.379]). The marginal effect estimate for Language Usage—the combination of two estimates—is positive but not statistically significant (1.386; 95% CI = [−0.209, 2.980]; d = 0.10). Recall that there was evidence of a main effect for treatment (1.113) for the entire sample on this outcome. Finally, there is marginal evidence of a treatment impact on spring MAP scores in Mathematics for potentially threatened students. The estimated interaction is 1.512 (95% CI = [−0.603, 3.627]; d = 0.08) and the estimated marginal effect is similar (1.578; 95% CI = [−0.128, 3.284]; d = 0.08).
Interpreting the Impacts
In addition to quantifying effects as standardized mean differences, or effect sizes, as reported in the previous section, one can interpret the impacts as a proportion of the preexisting unconditional achievement gap (see Cohen et al., 2006; Cohen et al., 2009; Sherman et al., 2013) or relative to the residual or “unexplained” gap in achievement by race/ethnicity. The unconditional or “raw” achievement gap represents the accumulation of disadvantages that accrued to students over the course of their lives, including early childhood influences, nutrition, poverty, and so on. The “unexplained” gap adjusts for the fact that students from different racial/ethnic backgrounds have different circumstances and experiences that produce different achievement levels. Observable student characteristics and their performance on preintervention measures of academic performance account for most—but not all—of the achievement differences we observe in seventh grade. These differences in achievement observed among the comparison students constitute the “unexplained” gap and may be due to social and psychological experiences that unfold during seventh grade.
To illustrate, the estimated interaction term (0.082) and marginal effect (0.065) for the cumulative GPA outcome correspond to effect sizes of 0.11 and 0.09, respectively. As sixth graders, students who were potentially subject to stereotype threat had GPAs that were 0.66 lower than those of their peers (see Table 2); the marginal effect estimate of 0.065 is equivalent to 10% of this gap. Finally, the residual achievement gap in seventh-grade cumulative GPA that is not explained by demographic characteristics or a student’s sixth-grade WKCE Mathematics test score is 0.101 (see Table A2 in the online appendix, available at http://epa.sagepub.com/supplemental). This estimate demonstrates that stereotype-threat-vulnerable students who had been equal to their White and Asian peers perform worse a year later. By this standard, self-affirmation reduced the “unexplained” achievement gap by 64% (0.065 / 0.101 = 0.64). Relative to the overall raw gap in achievement, the impact of self-affirmation is modest, but it accounts for a substantial portion of the achievement gap that cannot be accounted for by demographic characteristics other than race/ethnicity and prior sixth-grade achievement.
Our estimate of the net impact of self-affirmation on cumulative GPA, which is equivalent to a 0.065 advantage on seventh-grade GPA, is smaller than the previously reported impacts, which range from 0.22 (Sherman et al., 2013, Study 1) to 0.38 (Sherman et al., 2013, Study 2). 16 The authors of the prior research found larger unadjusted gaps in sixth-grade GPA (e.g., Sherman et al., 2013, observed a GPA gap of 1.02), and reported that the impact of self-affirmation corresponds to 22% to 38% of the raw gap, which is substantially larger than the 10% we found. It is common among social-psychological interventions to find evidence of larger treatment impacts on GPA as time goes on (e.g., see Aronson, Fried, & Good, 2002; Wilson & Linville, 1982, 1985). Evidence from our study suggests a similar result but, again, our end-of-year impact estimate (d = 0.13) is smaller than similar estimates from prior research, such as an effect size of d = 0.57 reported by Sherman et al. (2013).
The suggestive marginal effect estimates on the Mathematics tests (2.948 and 1.578 in the fall and spring, respectively) represent standardized effect sizes of 0.06 in the fall and 0.10 in the spring. The fall math impact estimate represents 6% of the unconditional achievement gap on the sixth-grade test (2.948 / 52.34 = 0.06) and 56% of the “unexplained” achievement gap (2.948 / 5.311 = 0.56). Spring MAP scores are not available from the prior year, but the marginal effect estimate represents 54% of the “unexplained” achievement gap (1.578 / 2.927 = 0.54).
Discussion
In this article, we report on a randomized field trial of self-affirmation writing conducted at unprecedented scale. Self-affirmation did not influence White and Asian students’ school outcomes, which confirmed our expectations and is consistent with prior research. Students potentially vulnerable to stereotype threat respond differently to self-affirmation than White and Asian students, though, and self-affirmation positively affects the academic performance of students who may be vulnerable to stereotype threat, particularly as measured by GPA. The magnitudes of these impact estimates are smaller than those found in earlier studies, but the direction is consistent with theory and prior research. We also found some support for the hypothesis that self-affirmation influences student academic performance over time.
The fact that we found smaller impacts than previous research is not surprising. Scaling up educational interventions and reform models is difficult and often unsuccessful (Elias, Zins, Graczyk, & Weissberg, 2003; Glennan, Bodilly, Galegher, & Kerr, 2004). We have taken the steps to take an important social-psychological intervention to scale across an entire school district—the first such effort at scale-up. It is extremely valuable to understand if the effects of the original small-scale field studies replicate when they are scaled up to serve a large number of students, classrooms, and schools. As Bryk, Gomez, and Grunow (2011) contended, “[T]he history of educational innovation is replete with stories that show how innovations work in the hands of a few, but lose effectiveness in the hands of the many” (p. 130). Thus, the most basic evidence of whether or not these interventions can produce impacts when implemented at scale is a crucial and fundamental question that was previously without an answer.
Self-affirmation writing is arguably easier to implement and replicate with fidelity than a comprehensive schoolwide reform model, but correct implementation is still essential to its success (Yeager & Walton, 2011). Prior field research was conducted in one school at a time with a handful of teachers; our current study was conducted in 11 schools with more than 50 teachers in 80 classrooms. It is not surprising that small-scale field experiments conducted by the developers of these materials yielded larger impacts than those found in our study. School districts may expect impacts on the order of what we report here if they adopted self-affirmation as part of their curricula: modest impacts on GPA for non-White and non-Asian students, without harming the performances of White and Asian students, along with the possibility of additional impacts on standardized tests within the mathematics domain. This is not an estimate of self-affirmation or stereotype threat under ideal conditions, but rather what one might expect in a real-world setting at scale with minimal teacher training and curricular integration.
No one claims that stereotype threat accounts for the entirety of the achievement gap (Sackett, Hardison, & Cullen, 2004; C. M. Steele, 1997; C. M. Steele & Aronson, 2004) or that self-affirmation can close it completely (Yeager & Walton, 2011), but self-affirmation may help narrow the gap at little to no additional cost to districts as part of an overall strategy to achieve equity. Our findings show that self-affirmation can substantially narrow the residual achievement gap that cannot be explained by demographic characteristics or prior achievement, and this is the portion of the achievement gap implicated by stereotype threat (Cohen & Sherman, 2005; C. M. Steele & Aronson, 1995). If implementing a series of brief expressive writing exercises can covertly address this gap by substituting for other in-class writing activities, it would appear well worth it to do so.
We found suggestive evidence of an impact of self-affirmation on mathematics tests but not on reading and language tests. Self-affirmation writing does not plausibly develop mathematics ability, but there are two reasons why self-affirmation might affect math achievement and not reading. First, stereotyped students may not find a reading test to be as threatening as a mathematics test. The residual achievement gaps in reading are smaller than in mathematics, and, in fact, we did not find a statistically significant residual gap along race/ethnicity for the fall reading test (see Table Al in the online appendix, available at http://epa.sagepub.com/supplemental). Perhaps taking a mathematics test is more stressful for students, which compounds the self-monitoring and other harmful processes that stereotype threat induces in vulnerable students. Many laboratory experiments, after all, use mathematics tests to create an evaluative situation in which stereotype threat can thrive. At least 25 of the 43 dependent variables in the studies reviewed by Walton and Cohen (2003) are mathematics tests. If mathematics tests are more threatening than reading tests for seventh-grade students, then self-affirmation is more likely to help students demonstrate their true abilities in mathematics than in reading.
Second, there is some evidence from research on summer learning (Cooper, Charlton, Valentine, & Muhlenbruck, 2000) and teacher quality (Aaronson, Barrow, & Sander, 2007) that mathematics performance is more responsive to school inputs than reading, perhaps because students have alternative venues for learning to read (e.g., the family). Affirmed students could be more receptive to mathematics instruction and therefore could be learning more mathematics. In this fashion, self-affirmation may indirectly cultivate learning.
Although most education research has relied on standardized achievement tests to measure intervention impacts, recent work suggests that grades and attendance—not test scores—are the middle-grade factors most strongly connected with both high school and college success (Allensworth, Gwynne, Moore, & de la Torre, 2014). These authors concluded that a one-point difference in eighth-grade GPAs, which is similar to the self-affirmation impact of seven-tenths of a point that we observed for cumulative seventh-grade GPA, corresponds to a 20 percentage point difference in the likelihood of passing ninth-grade math. We also find larger GPA impacts at the end of the year, which Sherman and his colleagues (2013) cited as evidence of a recursive process, or learning, as the impact of self-affirmation builds over time. However, a single year of data may not be sufficient to settle this question, and Cohen et al. (2009) and Study 1 from Sherman et al. (2013) used multiple years of data. Recall that students were assigned as many as four writing exercises, with the final “tailored” exercise near the end of the school year (see Figure 1). Although the early affirmations appear to be most important (Cook et al., 2012; Critcher et al., 2010), the effects at the end of the year could be evidence of a recursive process, a “dosage” effect that depends on the accumulation of the impacts of the exercises over the course of the year, or the impact of each “booster” exercise along the way. Although our exploratory analyses revealed the largest quarterly GPA impact in the final quarter of the year, further analyses of future outcomes for these students across later grades will offer stronger tests of the hypothesis that the impact of self-affirmation grows steadily over time.
Conclusion
Our primary question was whether self-affirmation affects the academic performance of students who are identified as belonging to racial/ethnic groups that may be subject to stereotype threat. We find evidence of positive impacts of self-affirmation for these students—particularly on mathematics tests—that are consistent with but smaller than those found in prior field research on self-affirmation. Self-affirmation writing appears to be a replicable and extremely cost-effective strategy for reducing achievement gaps. Recent syntheses of research on the impacts of more complex and costly curricular and instructional interventions on elementary and middle school students have suggested that typical impacts on broad-scope standardized achievement tests range from an effect size of about d = .08 to d = .15 (Lipsey et al., 2012). As another example, a meta-analysis of the achievement impacts of 29 widely replicated whole-school reform models suggests that typical impacts from independently conducted evaluations using experimental or quasi-experimental comparison groups yielded effect sizes of d = .09 (Borman, Hewes, Overman, & Brown, 2003). Understood in this context, observed self-affirmation impacts for potentially threatened minority students of d = .11 for cumulative GPA and d = .09 for fall Mathematics achievement are within the range of effect sizes observed for other educational interventions. The delivery mechanism for the self-affirmation treatment relies on several sheets of paper on which the self-affirming writing prompt is provided to students, a brief teacher training session to help teachers administer the intervention, and the 15 to 20 min of class time during which students engage in self-affirmation writing. Although a comprehensive cost-effectiveness analysis is beyond the scope of this article, it is clear that the impacts of self-affirmation can be achieved at a small fraction of the cost of whole-school reforms, which, more than 10 years ago, Borman et al. (2003) estimated to cost approximately US$86,000 during the first year of implementation.
The impacts also account for a substantial amount of the racial/ethnic achievement gap that cannot be explained by demographics and prior achievement, which is the portion of the achievement gap for which stereotype threat is believed to be the culprit. Our results suggest that a nonzero proportion of the achievement gap in middle school is explainable by seemingly subtle psychological factors that affect African American and Latino students within their school climates. Our intervention work further suggests that such psychological factors appear to be malleable and that we can effectively buffer students from stereotype threat. We find suggestive evidence that self-affirmation functions “recursively” to influence learning but cannot rule out that cumulative GPA impacts are a result of the sequence of exercises distributed over the course of the school year. Perhaps more intensive efforts to reduce racism and prejudice, by transforming schools to make them places that are less identity-threatening for young students of color, might reduce achievement gaps even more powerfully. Given how easily self-affirmation writing can be integrated into everyday classroom practice, though, it appears that self-affirmation through expressive writing can be a viable strategy for narrowing achievement gaps between sterotype-threatened minority students and their White and Asian peers.
Footnotes
Authors’ Note
The findings and conclusions are those of the authors and do not necessarily reflect the views of the supporting agencies.
Declaration of Conflicting Interests
The author(s) declared no potential conflicts of interest with respect to the research, authorship, and/or publication of this article.
Funding
The author(s) disclosed receipt of the following financial support for the research, authorship, and/or publication of this article: Research on this article was supported by grants from the Institute of Education Sciences, U.S. Department of Education (R305A110136 and R305C050055) and Spencer Foundation (201500044).
1.
We use the word “Latino” to refer to Latino/a Americans and Hispanic Americans. We refer to students of “Hispanic” race/ethnicity when they are identified as such in federal data (such as National Assessment of Educational Progress [NAEP]) and in the data we receive from the school district. We use the words “White” and “European American” as well as the words “Black” and “African American” interchangeably. We generally use the words “Latino,” “African American,” and “White” in our own writing to refer to different racial/ethnic classifications, but when we refer to the work of others, we use the terms the original authors used (e.g., “Black/White achievement gap”). We recognize that all of these groups are heterogeneous and that individual student experiences vary substantially within these groups.
2.
Another form of self-affirmation focuses on personal characteristics or attributes (e.g., “I am good at basketball”) rather than values (e.g., “I like playing basketball”); values affirmation is more widely used (McQueen & Klein, 2006).
3.
The list of items for the first exercise included Enjoying Sports, Being Good at Art, Being Creative, Being Independent, Living in the Moment (or Enjoying Today), Belonging to a Social Group (such as your community, racial group, or school club), Listening to Music or Playing Music, Following Politics or Government, Being with Friends or Family, Being Religious, and Having a Sense of Humor. The second exercise re-sorted the list and added Being Smart or Getting Good Grades (see Cohen, Garcia, Apfel, & Master, 2006; Sherman et al., 2013).
4.
Classroom teachers were told that the study evaluated how expressive writing contributed to academic learning.
5.
Students take the Wisconsin Knowledge and Concepts Exam (WKCE) in early November of each year; Madison Metropolitan School District (MMSD) provided us with each consented student’s scale score on the WKCE in Reading and Mathematics in both sixth and seventh grade. The scores follow a normal distribution.
6.
Academic courses that meet daily are given a weight of 0.25 per quarter; elective courses are included in the weighted grade point average (GPA), but most electives meet less often (either fewer days per week or fewer quarters per year). For example, an elective such as Chorus that meets 2 days per week is given a weight of 0.10 for the purpose of calculating GPA. The GPA values have a minimum of 0.0 for a student who failed every class and a maximum of 4.0 for a straight-A student. The distribution of GPA values is censored at 4.0. Our approach is consistent with MMSD practice but differs from prior research (e.g., Cohen et al., 2006; Cohen, Purdie-Vaughns, Apfel, & Brzustoski, 2009; Sherman et al., 2013), which computes GPA for “core” subjects (math, science, language arts, and social studies; see Sherman et al., 2013, p. 597); we include grades from all classes and provide greater weight to core subjects. Recalculating the GPA to “core” subjects only does not substantively change the results.
8.
We empirically assessed the legitimacy of our coding of students’ potentially threatened status by investigating reported eligibility for free/reduced lunch and prior (preintervention) academic achievement across each racial/ethnic group. In these data, Asian students resemble White students academically and economically, whereas American Indian and Pacific Islander students resemble Black and Hispanic students.
9.
We conducted a number of sensitivity analyses to test this classification decision. We did not find meaningful differences within the potentially threatened group (e.g., African Americans vs. Hispanic students). We also reclassified multiracial students by, for instance, assigning students identified as African American and White to the group that is not potentially vulnerable to stereotype threat and found substantively similar results. As one might expect, the magnitudes of the impacts of self-affirmation for multiracial students were between those of the potentially threatened and not potentially threatened groups, which yielded larger impact estimates for the potentially threatened group when the multiracial students were reassigned. These supplemental sensitivity analyses are available from the authors on request.
10.
A total of 988 students (58% of 1,706) were enrolled prior to the first writing exercise and 60 students were enrolled between the first and second writing exercise.
11.
Term 4 GPA is missing for 20 seventh graders; the results without them are substantively and statistically similar.
12.
In the GPA sample, the rate of attrition was 3% in the self-affirmation group and 4% in the comparison group, χ2(1, N = 1048) = 0.06, p = .81. Among the potentially threatened students, the rate of attrition was 5% for those assigned to self-affirmation and 4% for the comparison group, χ2(1, N = 390) = 0.46, p = .50. In the test score sample, the rate of attrition was 12% in the self-affirmation group and 12% in the comparison group, χ2(1, N = 1048) = 0.02, p = .88. Among the potentially threatened students, the rate of attrition for the test score sample was 17% for those assigned to self-affirmation and 15% for the comparison group, χ2(1, N = 390) = 0.31, p = .58.
13.
Students with “severe and profound” disabilities did not participate in the study. MMSD practices “full inclusion,” in which all students are served together in regular classrooms to the greatest extent possible. By virtue of delivering the writing exercises in classrooms during the school day, accommodations were available to all students with disabilities.
14.
Recall that the test score samples included only students with both sixth- and seventh-grade scores and that the GPA sample included only students with GPAs recorded in the last term of sixth grade and at least the first three terms of seventh grade.
15.
We conducted this analysis using the margins command in Stata Version 12. The command takes the derivative of the self-affirmation estimate at fixed values of the other covariates in the model. Postestimation of standard errors was conducted using the delta method (Oehlert, 1992). See Greene (2012) or  for more information.
Authors
References
Supplementary Material
Please find the following supplemental material available below.
For Open Access articles published under a Creative Commons License, all supplemental material carries the same license as the article it is associated with.
For non-Open Access articles published, all supplemental material carries a non-exclusive license, and permission requests for re-use of supplemental material or any part of supplemental material shall be sent directly to the copyright owner as specified in the copyright notice associated with the article.
