



Abstract
We investigated teacher effects (magnitude, predictors, and cumulativeness) on primary students’ achievement trajectories in Chile, using multilevel cross-classified (accelerated) growth models (four overlapping cohorts, spanning Grades 3 to 8; n = 19,704 students, and 851 language and 812 mathematics teachers, in 156 schools). It was found that teacher effects on achievement growth are large, exceeding school effects. Also, the contribution of teachers to student achievement growth was found to accumulate over time. The study advances the field by exploring teacher effects in the context of an emerging economy, contributing further evidence on the properties of teacher effects on student achievement growth and demonstrating the combined use of accelerated longitudinal designs, growth curve approaches, and cross-classified and multiple membership models.
Keywords
Introduction
A growing number of studies have investigated the effect of teachers on a range of cognitive and noncognitive student outcomes (Blazar & Kraft, 2017; Muijs et al., 2014; Sammons, Davis, & Gray, 2016). In this literature, the term “teacher effect” usually refers to the proportion of variance in student outcomes that is attributable to the assigned teacher. Thus, teacher effects are an estimation of how much the teacher matters in predicting differences in student outcomes compared with other sources of variation (such as, the student and school). Small teacher effects indicate a weak contribution of teachers to variation on student outcomes and can be interpreted as homogeneity among teachers (this could be due to, for example, similarities in terms of their initial training, knowledge and skills, and pedagogical practices, among other factors). Researchers have used a variety of analytic procedures to estimate the size of teacher effects, and these alternative procedures have produced markedly different conclusions. There is growing recognition of the relationship between methodological advances and increased theoretical understanding in educational effectiveness research (EER) and teacher effects research (TER; Creemers, Kyriakides, & Sammons, 2010). This article illustrates how using a combination of statistical modeling approaches provides robust new evidence on the size and importance of teacher effects in Chile.
In Latin America, the study of teacher effects has been hampered by the scarceness of suitable longitudinal data on students’ achievement that can be linked to the teacher(s) that taught them during the period of time under study. Furthermore, very few studies have been designed that permit the estimation of these effects on student achievement growth, that is, that have measured student achievement on at least three occasions during their school trajectories and that provide equated achievement scores. As it has been stressed in previous reviews of the Latin American literature, more longitudinal evidence is needed to understand the effect of schools and teachers on children’s cognitive growth over time in the region (Murillo, 2007).
This study examines teacher effects in Chile, with a focus on their magnitude, predictors, and the extent to which they accumulate over time. The following research questions are addressed:
Conceptual Framework
Measuring Teacher Effects
When studying teacher effects in real life contexts using a nonexperimental research approach, it is important to consider that teachers are neither distributed randomly among schools nor within schools. This selection effect implies that if better-qualified teachers tend to teach in more affluent schools, for example, due to the possibility of experiencing better working conditions, then a simple analysis based on unconditional models and cross-sectional data would yield an overestimation of teacher effects on student achievement.
Because research based on cross-sectional data is not likely to overcome this issue (Clotfelter, Ladd, & Vigdor, 2006; Hanushek, 1997), more recent studies analyze the impact of teachers in promoting student academic achievement using longitudinal data. Under this approach, data that follow students’ achievement over time and identifies the teachers who taught them in each stage are used, allowing researchers to separate and identify the contribution of schools, teachers, and students to student achievement over school years (Rivkin, Hanushek, & Kain, 2005).
When estimating educational effects, two of the most common empirical approaches to value-added estimates of teacher effects on student achievement are the covariate-adjustment model (i.e., models with current scores regressed on prior scores and other control variables, such as student background variables) and the gain scores model (i.e., current year score less prior year score as the dependent variable in the model, with adjustment for background variables; McCaffrey, Lockwood, Koretz, Louis, & Hamilton, 2004). However, these models do not capture the complex structure of relationships between students and teachers, as pupils can be taught by a different teacher each year and the effects of these teachers might accumulate over time. When this situation occurs (i.e., students change teachers during the period of time under study), data on student outcomes do not follow a traditional nested design of hierarchical models (i.e., students’ achievement scores are not perfectly nested within students, who are in turn are not perfectly nested within teachers), and alternative model formulations are necessary. Estimating the proportion of variance in students’ achievement growth rate that lies among teachers, when students change teachers over time, requires the use of cross-classified random effects models (Raudenbush, 1995).
The development of cross-classified multilevel modeling techniques, and its implementation in statistical packages, has allowed the expansion of TER in recent years (Creemers et al., 2010). However, these models are still only rarely used in education research (Beretvas, 2008; Luo & Kwok, 2012), often because of the lack of longitudinal data on students and teachers over several time points.
Although there have been a few applications and methodological studies using schools as clustering units to model longitudinal cross-classified data (e.g., Choi & Wilson, 2016; Goldstein & Sammons, 2006; Grady, 2010; Grady & Beretvas, 2010; Leckie, 2009; Leroux & Beretvas, 2018; Luo & Kwok, 2012), in this article, we focus on research that has modeled longitudinal cross-classified data with teachers as clusters. As shown in Table 1, only four studies (to the best of our knowledge) have applied models that account for the crossed grouping factors in longitudinal data with teachers as clusters (i.e., the student classification crossed with the teacher classification).
Synthesis of Studies Estimating Teacher Effects on Student Achievement Growth Using Cross-Classified Random Effects Models
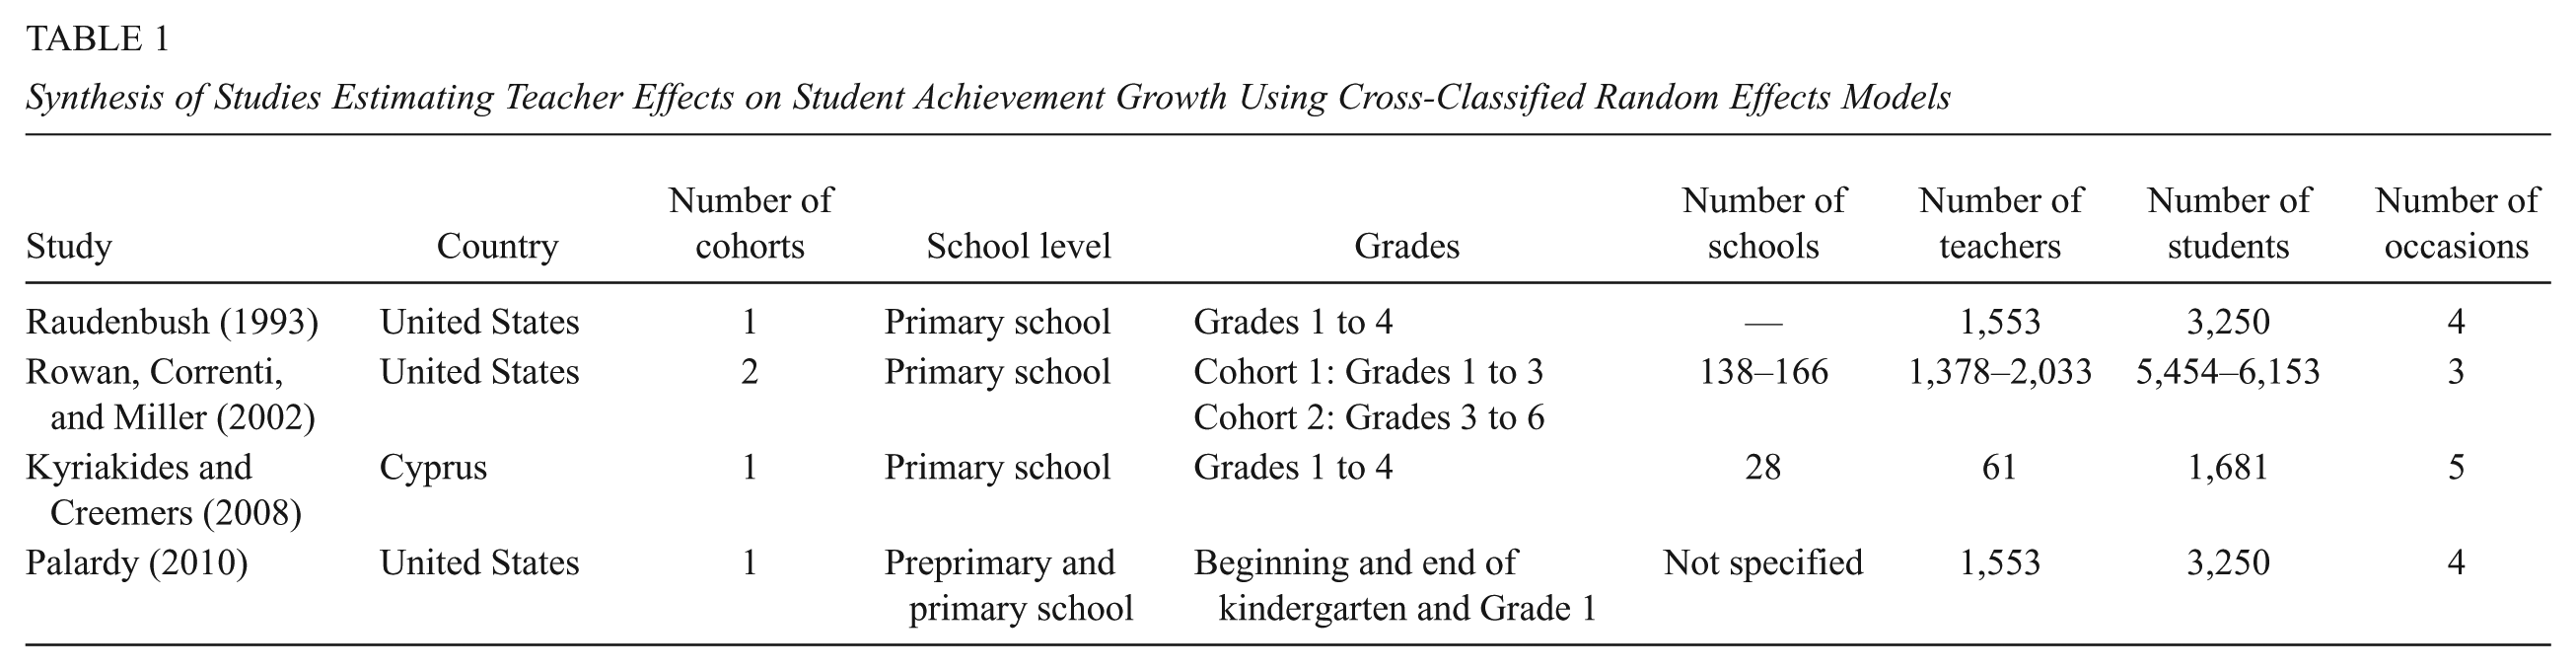
The first application of the cross-classified model to estimate teacher effects from repeated measurements of student achievement (where students encounter multiple teachers over time) was proposed by Raudenbush (1993). This model specification of teacher effects consisted of two levels but was later extended by Rowan, Correnti, and Miller (2002) to incorporate schools as a third level.
Much research on teacher effects has been conducted in the United States, linked to the development of complex teacher accountability systems in some states that with the often-elusive aim of reliably estimating individual teachers’ value-added scores. These studies have advanced the field by implementing more sophisticated statistical models, although their use for accountability purposes has been criticized (Kupermintz, 2003; Papay, 2011; Rothstein, 2009).
The Magnitude of Teacher Effects
Under the covariate-adjustment model approach, it has been found that 4% to 16% of the variance in students’ adjusted reading achievement, and 8% to 18% of the variance in adjusted mathematics achievement, lies among classrooms (depending on the grade at which the analyses are conducted; Rowan et al., 2002). Using the same approach, studies in the Latin American context have estimated the percentage of variance in student achievement at the classroom/teacher level to be slightly larger: around 11% in language and 22% in mathematics (Murillo, 2007; United Nations Educational, Scientific and Cultural Organization [UNESCO], 2015a). The larger teacher effects in the region can be interpreted as an indication of stronger variation across teachers in their ability to promote student achievement. These differences may reflect systematic differences on teachers’ individual characteristics (e.g., demographic characteristics, teaching experience, subject specialization, etc.) and/or on the teaching processes implemented by the teachers in Latin American countries, which often feature more segregated and stratified educational systems than those in postindustrialized economies. The magnitude of teacher effects, using multilevel gain scores models, has been found to be between 7% and 21% of the variance in achievement gains, depending on the subject assessed and the grade level of the students (Nye, Konstantopoulos, & Hedges, 2004).
Cross-classified random effects models produce very different estimates of the overall magnitude of teacher effects than do simple covariate adjustment and gain scores models. Raudenbush (1993) found that the classroom contribution, of which teacher effects are a dominant part (Wright, Horn, & Sanders, 1997), is estimated to be about 47% of the individual component of the variance of increments to learning in mathematics per year 1 (although part of this variance may be due to school to school differences, not specified in their model). Other TER studies using growth models have also concluded that teachers vary substantially in their effects on individual student learning growth. For example, Rowan et al. (2002) reported that the classrooms to which students were assigned in a given year accounted for roughly 60% to 61% of the variance in students’ rates of academic growth in reading achievement, and 52% to 72% of the variance in students’ rates of academic growth in mathematics achievement, in primary school. 2 Using an equivalent linear crossed random effects growth model, Palardy (2010) found that the percentage of reading achievement growth between classrooms within schools for kindergarten and first grade was 70%. 3 These estimates are 2 to 10 times the magnitude established in the literature using covariate adjustment and gain scores models. The authors attribute the larger estimates to better measurement properties of growth curve models.
Also, numerous international studies have suggested greater between-classroom than between-school variance in student achievement and larger teacher effects in primary than in secondary schools for both language and mathematics (e.g., Hill & Rowe, 1996; Luyten, 2003; Muijs et al., 2014; Reynolds et al., 2014).
The Predictors of Teacher Effects
TER has demonstrated that classroom-level variance can be predicted, to a great extent, by variation in teachers’ practice, based on indicators of quality of teaching obtained from either student ratings or systematic observations by trained researchers (Carnoy, 2007; Muijs et al., 2014; Pianta, Hamre, & Mintz, 2011). However, in this section the effects of other types of teacher characteristics are discussed, as they are the focus of subsequent analyses.
Several studies have investigated the impact of teacher characteristics, such as teaching experience, qualifications, certification, and knowledge, as well as the effect of their initial training and working conditions, providing rather mixed evidence (Darling-Hammond, 2000; Goldhaber & Brewer, 2000; Hanushek, 1997; McCaffrey, Lockwood, Koretz, & Hamilton, 2003; Wayne & Youngs, 2003). For example, Hanushek, Kain, O’Brien, and Rivkin (2005) used panel data of students and teachers in Texas to estimate the variation in teacher effects through a value-added approach based on student progress. The authors found a positive relationship between teacher effects and teacher characteristics such as certification, qualifications, and teaching experience (with higher gains during the first years of teaching). Similar results were obtained by Clotfelter, Ladd, and Vigdor (2007) and Goldhaber and Brewer (2000), in terms of the relevance of teacher credentials, certification processes and outcomes as predictors of student achievement. Based on data from the state of Kentucky, Kukla-Acevedo, Streams, and Toma (2009) found other significant predictors of student achievement, such as teacher’s prior achievement, and identified interactions between teacher-level variables, such as experience, and student-level variables, such as socioeconomic status (SES) and ethnicity.
Rockoff (2004) used matched student–teacher data from the state of New Jersey, where both student achievement and teacher data were collected in multiple years. A random-effects meta-analysis approach was adopted to measure the variance of teacher fixed effects while taking explicit account of estimation error and revealed that teaching experience significantly raised student test scores, particularly in reading. Finally, the study by Muñoz and Chang (2007) in the state of Kentucky used a multilevel growth curve model and found that teacher experience, education, and race did not predict high school reading achievement growth.
Overall, research suggests that teacher characteristics have significant but small effects on student achievement (Hanushek & Rivkin, 2010). For example, a review carried out by Greenwald, Hedges, and Laine (1996) found that for teacher test scores, the average effect size was d = 0.12, and for years of experience and postgraduate studies the average effect sizes were less than d = 0.05. Hattie’s (2009) review, in turn, found that the overall effect sizes for teacher training and for teacher subject matter knowledge were d = 0.11 and d = 0.09, respectively.
Teacher Cumulative Effects
Although extensive research has been conducted on the issue of how teachers impact students’ academic outcomes, less attention has been paid to the continuity of teacher effects measured at different stages of a student’s school career. This gap in TER can be attributed to how demanding investigating teacher cumulative effects can be, as it requires analyzing high-quality longitudinal student data linked to teachers and applying advanced statistical models. Indeed, apart from the research carried out in the United States noted above, studies on the measurement of teacher effects using value-added models that allow the analysis of cumulative effects are scarce, due to the lack of annually administered standardized tests linked to teacher information.
Raudenbush and Bryk (2002) used a cross-classified model and incorporated a multiple membership component to estimate teachers’ cumulative effects over time. This model fitted their data significantly better than a cross-classified model, which did not incorporate the multiple membership of students to teachers. Using a similar method, Kyriakides and Creemers (2008) investigated the long-term effect of schools and teachers in mathematics using longitudinal data from Cypriot students during their first 4 years of primary school. They concluded that, in conventional approaches used in EER, the short-term effects of teachers and student background factors are overestimated and the long-term effects of both teachers and schools are underestimated.
Other studies that have examined the cumulative effects of teachers over time have found significant effects of varying sizes between earlier teachers and subsequent students’ academic success (Antoniou, 2012; Hill & Rowe, 1998; Pustjens, Van de gaer, Van Damme, Onghena, & Van Landeghem, 2007; Rivkin et al., 2005; Rowan et al., 2002; Thum, 2003). In this line of research, Tymms, Merrell, and Henderson (2000) showed that effective classroom experiences in the first years of schooling continued to have a positive influence on students 2 years later. However, the evidence available is inconsistent with regard to the magnitude of the long-term effects of teachers, and more research is needed in this area.
The following conclusions, relevant to the present study, emerge from the literature: (a) Teacher effects tend to be larger when achievement growth over time, rather than achievement status, is studied; (b) teacher effects exceed school effects, in terms of magnitude; (c) teacher characteristics tend to have a significant, although small, effect on student achievement gains; and (d) the effects of teachers seem to accumulate over time. In the following section, the current state of TER in Chile is discussed, and relevant knowledge gaps are identified.
TER in Chile
The aim of this study is to analyze teacher effects on student achievement trajectories in Chile. Despite being among the highest-performing Latin American countries in international assessments, Chile is also one of the systems with the highest within-country variability in outcomes in the region (UNESCO, 2015b). The strength of the relationship between student performance and SES in the country is above the Organisation for Economic Co-Operation and Development (OECD) average and one of the strongest in Latin America (OECD, 2013; UNESCO, 2015a). In this context, where social background is a strong predictor of students’ school destination and achievement status, it is relevant to investigate to what extent can schools and teachers ameliorate or exacerbate existing inequalities by affecting students’ achievement growth. This situation warrants an in-depth investigation of the magnitude and sources of variation in performance in the country.
With regard to the teaching force in Chile, an important source of variation is their initial training. Teacher education in Chile takes place within a decentralized unregulated and highly privatized tertiary education system (Brunner & Uribe, 2007; Matear, 2007). Consequently, the Ministry of Education has little control over the curriculum and arrangements of the programs offered by teacher training institutions, which vary significantly in terms of their duration, content focus and subject specialization (Avalos & Matus, 2010). To be appointed in a teaching position, the only requirement is to hold a teaching qualification from a university or a professional institute. No other type of certification or registration is required.
Chilean primary teachers at the end of their teacher education showed variable and overall poor results in the mathematics and pedagogy content knowledge Teacher Education and Development Study in Mathematics (TEDS-M) tests, where the country ranked 15th out of the 16 participant countries (Tatto et al., 2012). The national diagnostic assessment for recently graduated teachers “Inicia” has also revealed large variation in subject and pedagogical knowledge across training institutions (Ministerio de Educación [MINEDUC], 2015). Furthermore, previous research has shown that initial teacher training (ITT) programs in the country differ significantly in terms of their effectiveness in promoting preservice teachers’ pedagogical and subject knowledge, after controlling for student intake (Manzi, Lacerna, Meckes, Ramos, & Ortega, 2012).
Few studies have explored other teacher characteristics associated with student achievement. In these studies, teacher gender, certification, years of teaching experience, and being trained in programs with subject specialization and strong practicum components are factors that have been found to correlate with student outcomes (Lara, Mizala, & Repetto, 2010; Ortúzar, Flores, Milesi, & Cox, 2009; Velez, Schiefelbein, & Valenzuela, 1993).
Research on the impact of teachers on student achievement in Chile is scarce in part due to the difficulty of linking student and teacher data and the lack of longitudinal data suitable for applying teacher value-added models. Indeed, most of the existing TER in Chile has used cross-sectional data (i.e., Alvarado, Cabezas, Falck, & Ortega, 2012; Lara et al., 2010; León, Manzi, & Paredes, 2009; Ortúzar et al., 2009; Ramírez, 2006; Willms & Somer, 2001).
Previous research on teacher effects in Chile has also been restricted by technical difficulties in modeling relationships between students and their successive classroom settings. Most of these studies have not been able to disentangle the teacher contribution from that of the school, nor have they used value-added approaches to estimate teacher effects and, therefore, their results are likely to be biased (McCaffrey et al., 2003).
Method
Data
Several data sets were linked to form a unique database of student, teacher, and school records. The data used in these analyses derive from the Sistema de Evaluación de Progreso del Aprendizaje (SEPA) 4 , developed by the MIDE UC Assessment Center of the Pontificia Universidad Católica, as well as from the Sistema de Medición de la Calidad de la Educación (SIMCE) 5 , the Student Enrolment Recording System (SERS), the Sistema de Información General de Estudiantes (SIGE) 6 , and the Teacher Census, maintained by the Chilean Ministry of Education.
An important match was that between each student’s SEPA test score in a specific subject in a given year, and the teacher who taught that particular subject to that student that year. This link was allowed by the grade level and class group identification data available in both, SERS and SIGE data sets.
Measures
The dependent variables of the study are the language and mathematics test scores obtained from the SEPA project. Both, the language and mathematics tests, consist of 35 multiple-choice items in Grade 3, 40 in Grades 4 to 7, and 50 in Grade 8. For each year and grade level considered, the language and mathematics achievement scales present satisfactory estimates of internal consistency (Cronbach’s α > .85). Scores were vertically and horizontally equated using Item Response Theory (IRT), which makes scores comparable across both, grade levels and cohorts.
The student-level control variables introduced into the models are described below. Female is a dichotomous variable that distinguishes boys (0) from girls (1). Age refers to student age, calculated in years and months, as in December of 2010 and cohort-mean centered. SES is a family SES index obtained from a factor analysis of mother’s education, father’s education, and family monthly income, and standardized to have a mean of zero and a standard deviation of unity. This index shows high internal consistency (Cronbach’s α = .88). Finally, Number of books at home (books), a proxy variable for cultural capital and the value of scholarly culture, was reported by parents and categorized in five values (1 = none, 2 = less than 10 books, 3 = between 10 and 50 books, 4 = between 51 and 100 books, and 5 = more than 100 books).
School-level predictors were included to depict composition effects. The school-level variables used were Achievement Mean, indicating school mean score on the SIMCE Assessment System test for the relevant subject, Achievement SD, referring to the within-school standard deviation in SIMCE test scores for the relevant subject, a measure of diversity in the levels of achievement of the student body, and School SES, a composite indicator created and calculated by the Chilean Ministry of Education. 7
The teacher-level variables used are Female Teacher, a dichotomous variable that distinguishes male teachers (0) from female teachers (1), ITT Duration, indicating the duration of the teacher’s ITT program in semesters, Experience, denoting the number of years that the educator has been teaching in any school and, finally, Major, a dichotomous variable that distinguishes referring to whether the teacher has undertaken specialized training in the subject in the subject assessed (1) or not (0).
The student-, teacher-, and school-level variables were treated as time-invariant covariates. Descriptive statistics are presented in Appendix 1 (available in the online version of the journal). The table shows that the sample of the study is diverse, including students living in urban and rural areas, attending public and private schools, and from a wide range of socioeconomic backgrounds. However, there are some differences between the study’s sample and the population, which are likely to be an artifact of both the way in which the SEPA project operates and Chile’s highly socially stratified education system.
The SEPA project, the main source of data for this study, is a low-stakes assessment initiative designed to inform individual schools about their students’ overall progress in comparison to that of students in other schools in the system. Thus, SEPA is not a school census nor is it a survey of randomly sampled schools. Instead, individual schools, or municipalities that administrate groups of public schools, voluntarily decide to participate in the project and have to pay for this service.
This self-selection process may introduce bias and an equalizing force across the sample, in the sense that those school and municipality administrators who are more confident about their schools’ academic performance, have more sophisticated assessment practices in place, are less averse to external assessment and more motivated about improving their students’ academic performance, and can fund the implementation of this assessment, are more likely to participate in the project. Students who come from higher SES backgrounds and whose families show higher levels of cultural capital are, in turn, more likely to attend those schools.
Missing Data
The largest proportions of missing data were found in the student-level variables retrieved from the SIMCE Assessment System. Family income (19%), mother’s educational level (19%), and father’s educational level (22%), the three variables used for creating a student SES indicator, had missing data, as it did the variable number of books at home (19%). The school-level variables, in turn, presented negligible proportions of missing data (below 1%).
Also, due to student and school attrition, as well as to the incorporation of new students and schools into the project each year, scores had a considerable proportion of missing values at each time point. For language test scores, the percentage of missing data was 31%, 44%, and 45% in 2010, 2011, and 2012, respectively. Similarly, for mathematics test scores, the percentage of missing data was 33%, 42%, and 42% in 2010, 2011, and 2012, respectively.
From the analysis of missing data mechanisms, it was concluded that data were at least missing at random (MAR; Little & Rubin, 2002). Thus, the results presented in this article were obtained after performing Bayesian multiple imputation (MI) via Mplus (Muthén & Muthén, 2010). Based on recommendations by Rubin (1987) five imputed data sets were generated. The missing data were imputed from an unrestricted two-level model and the hierarchical structure was accommodated by means of imputing data with test scores in wide format, students as Level 1, and schools as Level 2. The language and mathematics databases were linked together so the imputation of data in the language data set would benefit from information on mathematics test scores as auxiliary variables, and vice versa. Finally, all the results obtained from the five multiply imputed data sets were combined using Rubin’s (1987) rules.
It was decided to perform MI on all the variables in the models, including the dependent variables (i.e., language and mathematics test scores). The decision was based on well-established missing data treatment evidence that indicates that (a) MI is an appropriate method under general MAR conditions that, compared with listwise deletion (LW; that is, complete-case analysis), makes better use of the observed information, increases robustness to nonignorable missingness and improves estimation precision (Schafer & Graham, 2002); (b) the dependent variable should be included in the models used to impute independent variables, otherwise it would be tacitly assumed in imputation that there is no relationship between the independent and dependent variables and, when the imputed data are analyzed, the estimated slope of the dependent variable on the independent variable would be biased toward zero (Allison, 2000; Von Hippel, 2007); and (c) imputing outcome data are common practice and leads to correct inference when performed using MI (Groenwold, Donders, Roes, Harrell, & Moons, 2012; Little, 1992; Sullivan, Salter, Ryan, & Lee, 2015).
Simulation studies have shown that, as long as the outcome is included in the imputation model, there are very small performance differences between the possible MI approaches: no outcome imputation, imputation, or imputation and deletion (Kontopantelis, White, & Sperrin, 2017). Still, to check the reliability of the findings obtained using MI, the analyses were also run using two alternative approaches for dealing with missing data: (a) LW and (b) multiple imputation, then deletion (MID), an approach introduced by Von Hippel (2007), where all cases are used for imputation but, following imputation, imputed values on the dependent variables are excluded from the analysis (i.e., the dependent variables are used in the imputation model but kept as missing in the analyses). The results obtained for Model 1 under LW and MID are presented in Appendices 2 and 3 (available in the online version of the journal), respectively. The three approaches produce very similar estimates. The direction, magnitude, and significance of the fixed effects are generally consistent across the different approaches, and, as shown by the overlap of the credible intervals for the variance components, the student, teacher, and school variances, which are used to calculate teacher effects, do not differ significantly from those obtained for Model 1 when using MI for all the variables (see Table 4). The only exception is the variance for linear growth in language achievement in the student classification, which is significantly larger under the MI approach and leads to the estimation of somewhat smaller teacher effects on student achievement growth (53.4%), when compared with LW and MID (60.4% and 63.5%, respectively).
Sample
The sample consists of students in Grades 3 to 8, who took the SEPA language or mathematics tests. Analyses were carried out considering only those schools with 22 or more students and those teachers with at least five students in each of the 3 years assessed. 8 After performing MI, the language and mathematics samples were balanced, that is, the number of time-point observations is three for each of the students. The sample for both academic subjects comprises 59,112 measurement occasions nested in 19,704 students, nested, in turn, in 156 schools. Only the number of teachers is different between the language (n = 851) and the mathematics (n = 812) samples.
Accelerated Longitudinal Data
As mentioned above, the data included participants belonging to four different student cohorts, each followed over 3 years. The grade levels in which these cohorts are located each year are presented in Table 2, where cohorts are identified by Roman numerals. Cohort 1 comprises students who were third graders in 2010, Cohort 2 those who were fourth graders in 2010, and so on. The last cohort (Cohort 4) covers students who enter the estimation sample as sixth graders in 2010.
Descriptive Statistics of Language and Mathematics Achievement by Grade Level and Cohort

Note. Dashes indicate that data are not available in that grade for that cohort.
As shown in Table 2, created from the pooled imputed data, the sample sizes vary by cohort, ranging from n = 4,269 for Cohort 3 to n = 5,782 for Cohort 1. The data resembles a 3-year accelerated longitudinal design with four overlapping cohorts, permitting the study of Grades 3 to 8. Descriptive statistics of SEPA language and mathematics scores are summarized by cohort and grade level.
Cross-Classified Data
The structure of longitudinal educational data is such that a lower level unit (i.e., a measurement occasion) is perfectly nested in one (or more) higher level unit (i.e., a student and a school). However, when persons cross contextual boundaries during the study, the data no longer have a perfectly nested structure. Rather, the structure involves cross-classification of persons by social setting as it occurs in attempts to study the effects of teachers on children’s cognitive growth across years (Raudenbush & Bryk, 2002). In real life contexts, students can often change teachers during their school career. In this situation, where lower level units (i.e., an occasion) belong to different higher level units (i.e., students and teachers) at the same time, data are cross-classified. Cross-classified random effects models were developed for analyzing data with such structure (Goldstein, 1987; Raudenbush, 1993).
The longitudinal data in the sample are partially crossed because most students changed teachers at least once during the 3 years under study (87.45% in language and 88.34% in mathematics) but not all students do so. Table 3 shows how many students were taught by one, two, and three teachers over the 3 years studied, A indicating the first teacher, B the second, and C the third. Five logical patterns were possible, and the data in this study presented four of these.
Sample Size by Number of Teachers Associated to Student
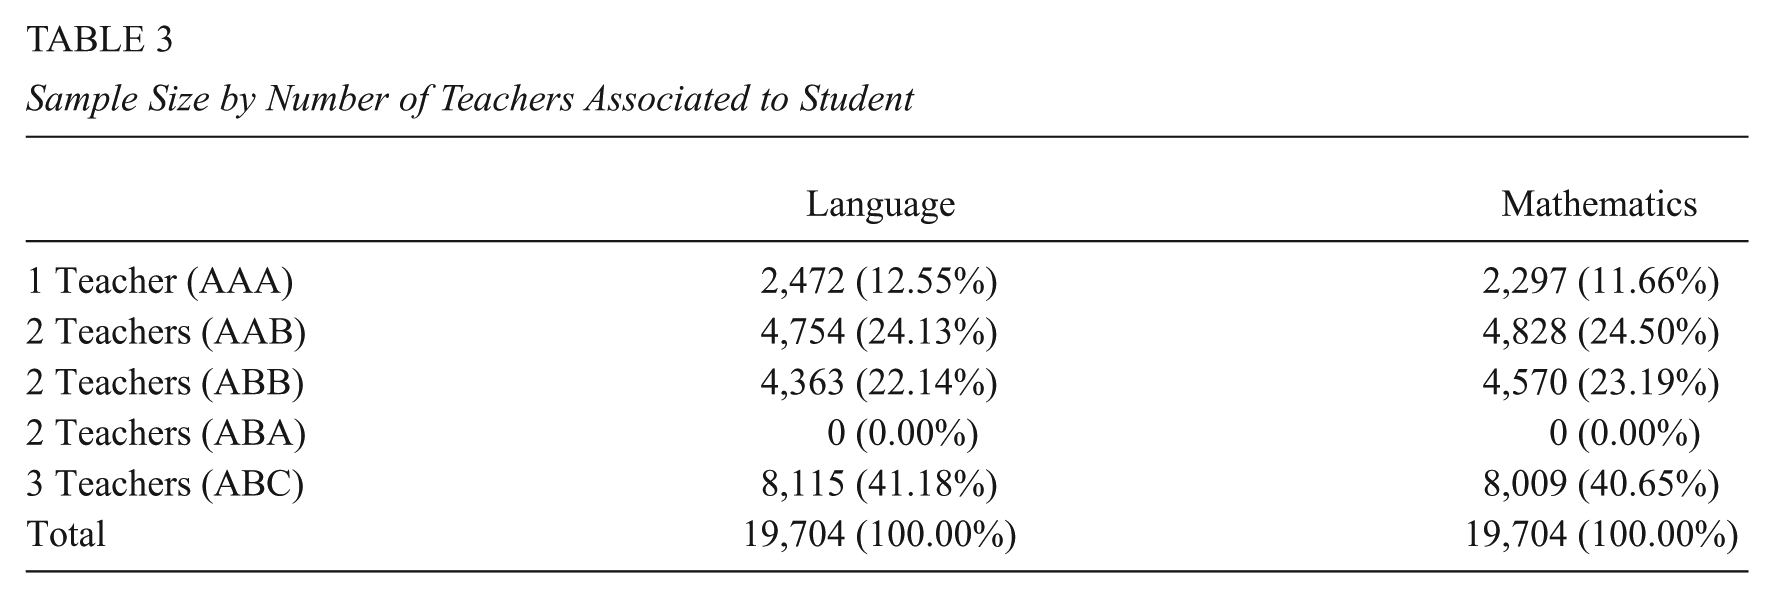
Not all occasions from the same student are necessarily linked to the same teacher, nor do all occasions from the same teacher belong to the same student. Thus, the data have a two-way cross-classified nonhierarchical structure; the student and teacher hierarchies are crossed with one another. Also, there are two classifications in Level 2 because students are not nested within teachers or teachers within students; thus, the assumptions of a pure multilevel structure do not hold.
Multiple Membership Data
A further complication in using cross-classified models occurs when confronted with student mobility, if students change teachers, then more than one teacher is related to their school performance at a given time point. This situation represents another type of imperfect clustering that requires an extension of the conventional multilevel model. Because some students are members of multiple teachers, the data are said to have a multiple membership structure, that is, a situation where lower level units (i.e., students’ scores) belong to more than one higher level unit of a population of interest (i.e., teachers). As shown above, 88% of students were taught language and mathematics by more than one teacher during the period studied.
In multiple membership data structures, the degree to which each lower level unit belongs to each higher level unit will often vary across those higher level units. When fitting multiple membership models, multiple membership weights should be applied to quantify this phenomenon (Leckie, 2013). In our study, students may spend more time with some teachers than others. Thus, multiple membership weights are defined as the proportion of time spent with each teacher. For example, if a student is taught for 1 year by teacher A and then for 2 years by teacher B, multiple membership weights would be assigned proportionally: 0.33 and 0.66 for teachers A and B, respectively. These weights reflect the assumption that we might expect teacher B to be more influential in determining the student’s outcome than teacher A.
Researchers typically use one of two following procedures for handling complex multilevel data structures such as cross-classified and multiple membership data (Beretvas, 2011): As a first strategy, researchers might delete from analysis the sets of units that prevent the data from being a pure hierarchy (i.e., deleting mobile students from the data sets being analyzed) and, as an alternative strategy, researchers could ignore one of the cross-classified factors or all but one higher level unit associated with multiple member units.
However, deleting cases reduces power and can affect generalizability and validity of inferences (Meyers & Beretvas, 2006). Also, ignoring one of the classification factors or all but one higher level unit associated with multiple member units can lead to inaccurate variance component estimation (Fielding & Goldstein, 2006; Rasbash & Browne, 2001). Indeed, fitting the nearest equivalent hierarchical model to cross-classified data will misattribute response variation to the included levels (Moerbeek, 2004; van den Noortgate, Opdenakker, & Onghena, 2005). This, in turn, may lead to misleading findings about the relative importance of different sources of influence on the outcome measure. Similarly, if we were to assign students to the first teacher that teaches them and then fit a students-within-teachers model of student achievement, this will likely underestimate the importance of teachers and overestimate the importance of students as sources of variation in student achievement.
Thus, deleting cases and ignoring complex structures compromises the validity of inferences. Instead, it is important that both the cross-classified and multiple membership nature of the data are modeled, when present, using combined cross-classified and multiple membership random effects models, as it will be illustrated below.
Models
Models in this study were implemented to accommodate the multiple measures of the same student (via growth curve models), and multiple cohorts of students (using accelerated longitudinal models). Thus, the proportion of variance of primary student achievement growth at the teacher level is estimated using accelerated growth curve models. However, as some students change teachers across years, student outcomes do not follow the traditional nested design of hierarchical models and an alternative specification (i.e., cross-classified random effects) was adopted in all the four models reported. 9
Model 0 is a baseline three-level growth model (measurement occasions nested within students, nested in turn within schools) against which subsequent models are compared. Model 0, as well as the subsequent models, incorporates cohort effects as it was tested in previous analyses, that it is not possible to assume that the four cohorts studied follow a common developmental trajectory (Ortega, 2016; Ortega, Malmberg, & Sammons, 2018). Model 1 is a two-way cross-classified model in which student and teacher hierarchies are crossed with one another and nested within schools. We use this model to analyze the magnitude of teacher effects. Model 2 includes the effect of teacher-level predictors on student achievement status and growth. Finally, Model 3 is a cross-classified multiple membership model that assumes that the effects of teachers from previous years are carried forward to the following years. Throughout the article, multiple subscript notation, introduced by Rasbash and Browne (2001), is adopted as it facilitates the description of multilevel models with combinations of hierarchical, crossed, and multiple membership structures.
Model 0
In Equation 1, Model 0 is shown. This is a between-school model with student- and school-level characteristics. The importance of controlling for student background and school characteristics in statistical models, before comparisons across schools and teachers can be made, is well-established in the EER field (Sammons & Luyten, 2009). Independent student and school variables (i.e., Female, Age, SES, Number of books at home, Achievement Mean, Achievement SD, and School SES) are introduced in the model as both fixed effects and in interaction with the time variable. At the first level of the model (t), each person’s observed development is conceived as a quadratic function of grade level plus random error. 10 At the second level of the model (i), the individual intercept and linear growth rate coefficients are assumed to vary as a function of cohort plus person-specific random effects. Thus, separate mean trajectories are estimated for each cohort. The specification is

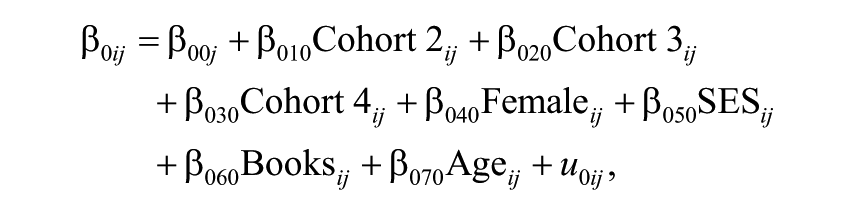
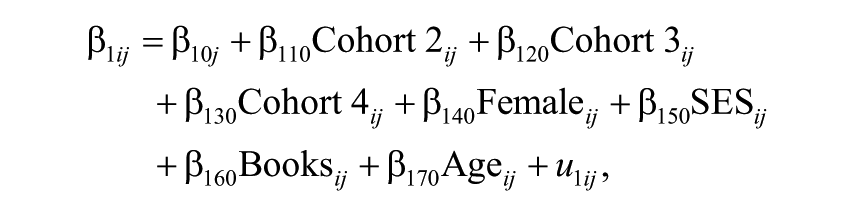




where
The parameter
Model 1
Crossed-random effects are introduced in Model 1 to investigate the magnitude of teacher effects. Equation 2 below denotes this model:

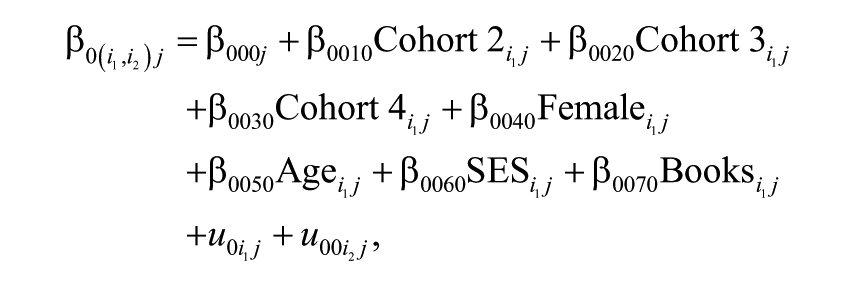

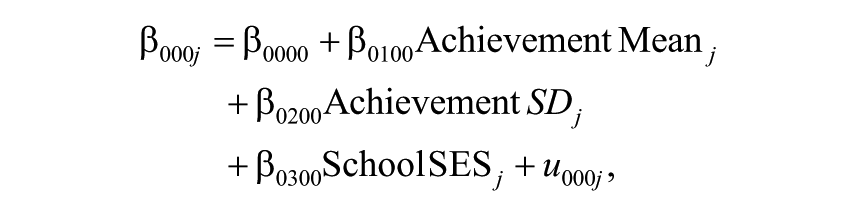





The number of letters in the subscript identifies the number of classifications (here, there are four: occasion, student, teacher, and school). Subscripts with the same common letter (here,
The variance partition coefficient (VPC) can be used as a measure of overall magnitude of school and teacher effects when dealing with complex random effect structures. In this study, teacher effects are calculated as the percentage of variation that lies between teachers for both the initial status and growth, as recommended by Palardy (2010). Thus, for Equations 2 to 4 (i.e., Models 1 to 3), the magnitude of teacher effects on student achievement status is defined as

and the magnitude of teacher effects on student achievement growth is defined as

This elicits the simultaneous comparison between teacher-to-teacher differences in achievement level and teacher-to-teacher differences in growth. 11
Model 2
In Model 2, shown in Equation 3, teacher-level variables (i.e., teachers’ years of experience, gender, subject specialization, and ITT duration) are introduced both as main effects and in interaction with the time variable. The random part of the model remains as in Model 1:






Model 3
In Chile, students are frequently assigned to different teachers each year and prior research has not been able to incorporate the potential cumulative effects of teachers on student outcomes. The complexity of the models applied is expected to match the system being studied to a larger extent than models used in previous research.
The hypothesis of cumulative effects of teachers was tested by comparing the fit of the model that assumes that teachers from prior years make no contributions to current achievement growth (Model 1, Equation 2) with a model that assumes that previous teachers’ effects persist undiminished in future years (Model 3, Equation 4). The latter model specifies the teacher effect on student achievement growth in a given year as the joint effect of all of the previous teachers the student had for that subject, during the period considered in the study, with the contribution of each teacher being assigned an equal weight. 12 This is done by adding a multiple membership component to the cross-classified accelerated growth model, as shown in Equation 4.


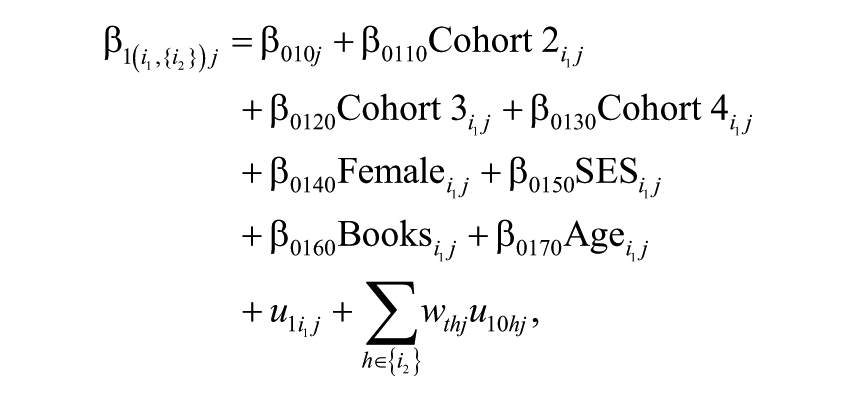






Here,
As explained above, multiple membership data are modeled using weighting, where the membership weights are usually proportional to the time a lower level unit spent at a higher level unit, with the weights summing to 1. In Model 3, a pupil who was taught by the same teacher from Grade 3 to Grade 5 has a membership weight of 1 for that teacher and 0 for all other teachers. A pupil taught by a different teacher each of the 3 years in which data were collected has a membership weight of 1/3 for each of them and 0 for all other teachers.
Thus, Model 3 assumes that teacher effects persist undamped into the future. The validity of this assumption has not been fully explored in the literature, and while there is evidence that teacher effects are long-lasting, it is also reasonably to hypothesize that a teacher’s effect will dampen over time as students grow and are exposed to other teachers and learning experiences (McCaffrey et al., 2004). This issue will be explored by comparing alternative teacher weighting schemes, as part of a sensitivity analysis for the multiple membership model.
Estimation and Model Fit
Estimation was performed using Bayesian estimation via Markov chain Monte Carlo (MCMC) methods implemented in the software MLwiN (Browne, 2012). 13 The MLwiN software was operated via the Stata command runmlwin (Leckie & Charlton, 2013). The means and standard deviations of the sampled parameters from the monitoring period were used as parameter estimates and standard errors while the 2.5th and 97.5th percentiles of the MCMC chain provided Bayesian 95% credible intervals, analogous to 95% confidence intervals.
The Bayesian Deviance Information Criterion (DIC) is recommended to compare model fit, with lower values reflecting superior models and differences in DIC values of more than 5 units between two models are regarded as strong evidence in favor of the model with the smaller DIC (Lunn, Jackson, Best, Thomas, & Spiegelhalter, 2012).
Results
In this study, we investigate teacher effects in Chile. The main aspects addressed are the size of teacher effects on students’ achievement growth in language and mathematics, the teacher-level predictors of these effects, and whether these effects accumulate over time.
As explained above, the complex structure of the data was acknowledged by using a cross-classified model, which addresses the fact that repeated measurements of achievement test scores are nested within both students and teachers and a cross-classified multiple membership model, to test the hypothesis of teachers’ cumulative effects. Thus, the models combine these aspects with an accelerated growth model, obtaining a cross-classified accelerated growth model and a cross-classified multiple membership accelerated growth model. Results derived from these models are presented in this section.
The Magnitude of Teacher Effects
Table 4 shows the results of Model 1: the cross-classified accelerated growth model. The DIC values indicate that there is a sizable improvement in the model fit when the teacher classification is incorporated and the cross-classified structure of the data acknowledged, as shown by the reduction on DIC values from Model 0, the three-level accelerated growth model without the student–teacher cross-classification (see results in Appendix 4, available in the online version of the journal), to Model 1 (ΔDIC = −3,481 in language, and ΔDIC = −3,043 in mathematics).
Results From Model 1

Note. CI = confidence interval; SES = socioeconomic status; VPC = variance partition coefficient; DIC = Deviance Information Criterion; pD = effective number of parameters.
In addition, in Table 4, the variance components on achievement growth rates show that most of the variance in growth appears to be at the teacher level (53.4% and 66.0% for the linear component in language and mathematics, respectively). Furthermore, the variance in growth at the school level remains sizable (21.1% and 29.6% in language and mathematics, respectively) but it is still notably smaller than the variance in growth at the teacher level, which is in line with previous research (Hattie, 2009; Muijs et al., 2014; Scheerens & Bosker, 1997). Furthermore, the teacher effects yield a large d-type effect size of 0.731 and 0.813 for achievement growth in language and mathematics, respectively. 14 Because the school-level variance is still substantial and larger than estimates in models fitted across two time points in the literature, the results show that both schools and teachers are important, and incorporating both levels into educational effectiveness models remains essential.
In both, language and mathematics, teacher effects on the linear growth rate (slope) are much larger than on students’ achievement status (intercept; which are 3.8% and 5.8%, respectively). In addition, teacher effects on achievement growth are larger for mathematics than for language. This result is consistent with previous studies suggesting that school and teacher effects are larger in subject areas that are typically learned at school, as with mathematics, where exposure is limited in the family and the community (Teddlie & Reynolds, 2000; Thomas, Sammons, Mortimore, & Smees, 1997b). Furthermore, these teacher effects are similar in magnitude to those found in previous studies using comparable model specifications for similar outcomes (e.g., Palardy, 2010; Rowan et al., 2002).
To illustrate the magnitude of teacher effects on achievement status and growth, the 851 teacher residuals in the language sample and the 812 residuals for teachers in the mathematics sample are plotted in Figure 1. These caterpillar plots graph each residual, obtained from Model 1, against their rank order, accompanied by error bars corresponding to confidence intervals.

Teacher residuals for language and mathematics based on Model 1.
In both subjects, there is considerable overlap of intervals, so that only widely separated teachers can be judged as having significantly different effects on students’ achievement growth. All in all, teacher effects are not estimated with great precision. Nonetheless, it is possible to distinguish some outliers at each end. In language, the confidence intervals of the residuals do not overlap zero for a group of about 16 teachers at the lower end of the intercept residual plot and for 23 at the upper end. In addition, about 25 and 32 teachers are at the lower and upper end of the language slope residual plot. In mathematics, the numbers of outlier teachers are 31 and 23 at the lower and upper end of the intercept residual plot, respectively. In the mathematics slope residual plots, in turn, there are 18 and 16 at the lower and upper end. This means that approximately 4% to 7% of the teachers differ significantly from the average teacher effect at the 0.05 significance level.
Teacher-Level Predictors
So far, the focus has been on the overall size of teacher effects on student achievement. These estimates, although informative about the large variation on teacher effects in achievement growth in the Chilean education system, do not provide indications as to why some teachers appear to be more effective than others. This section focuses on examining the effect of teacher characteristics that might explain part of the large variance found across teachers.
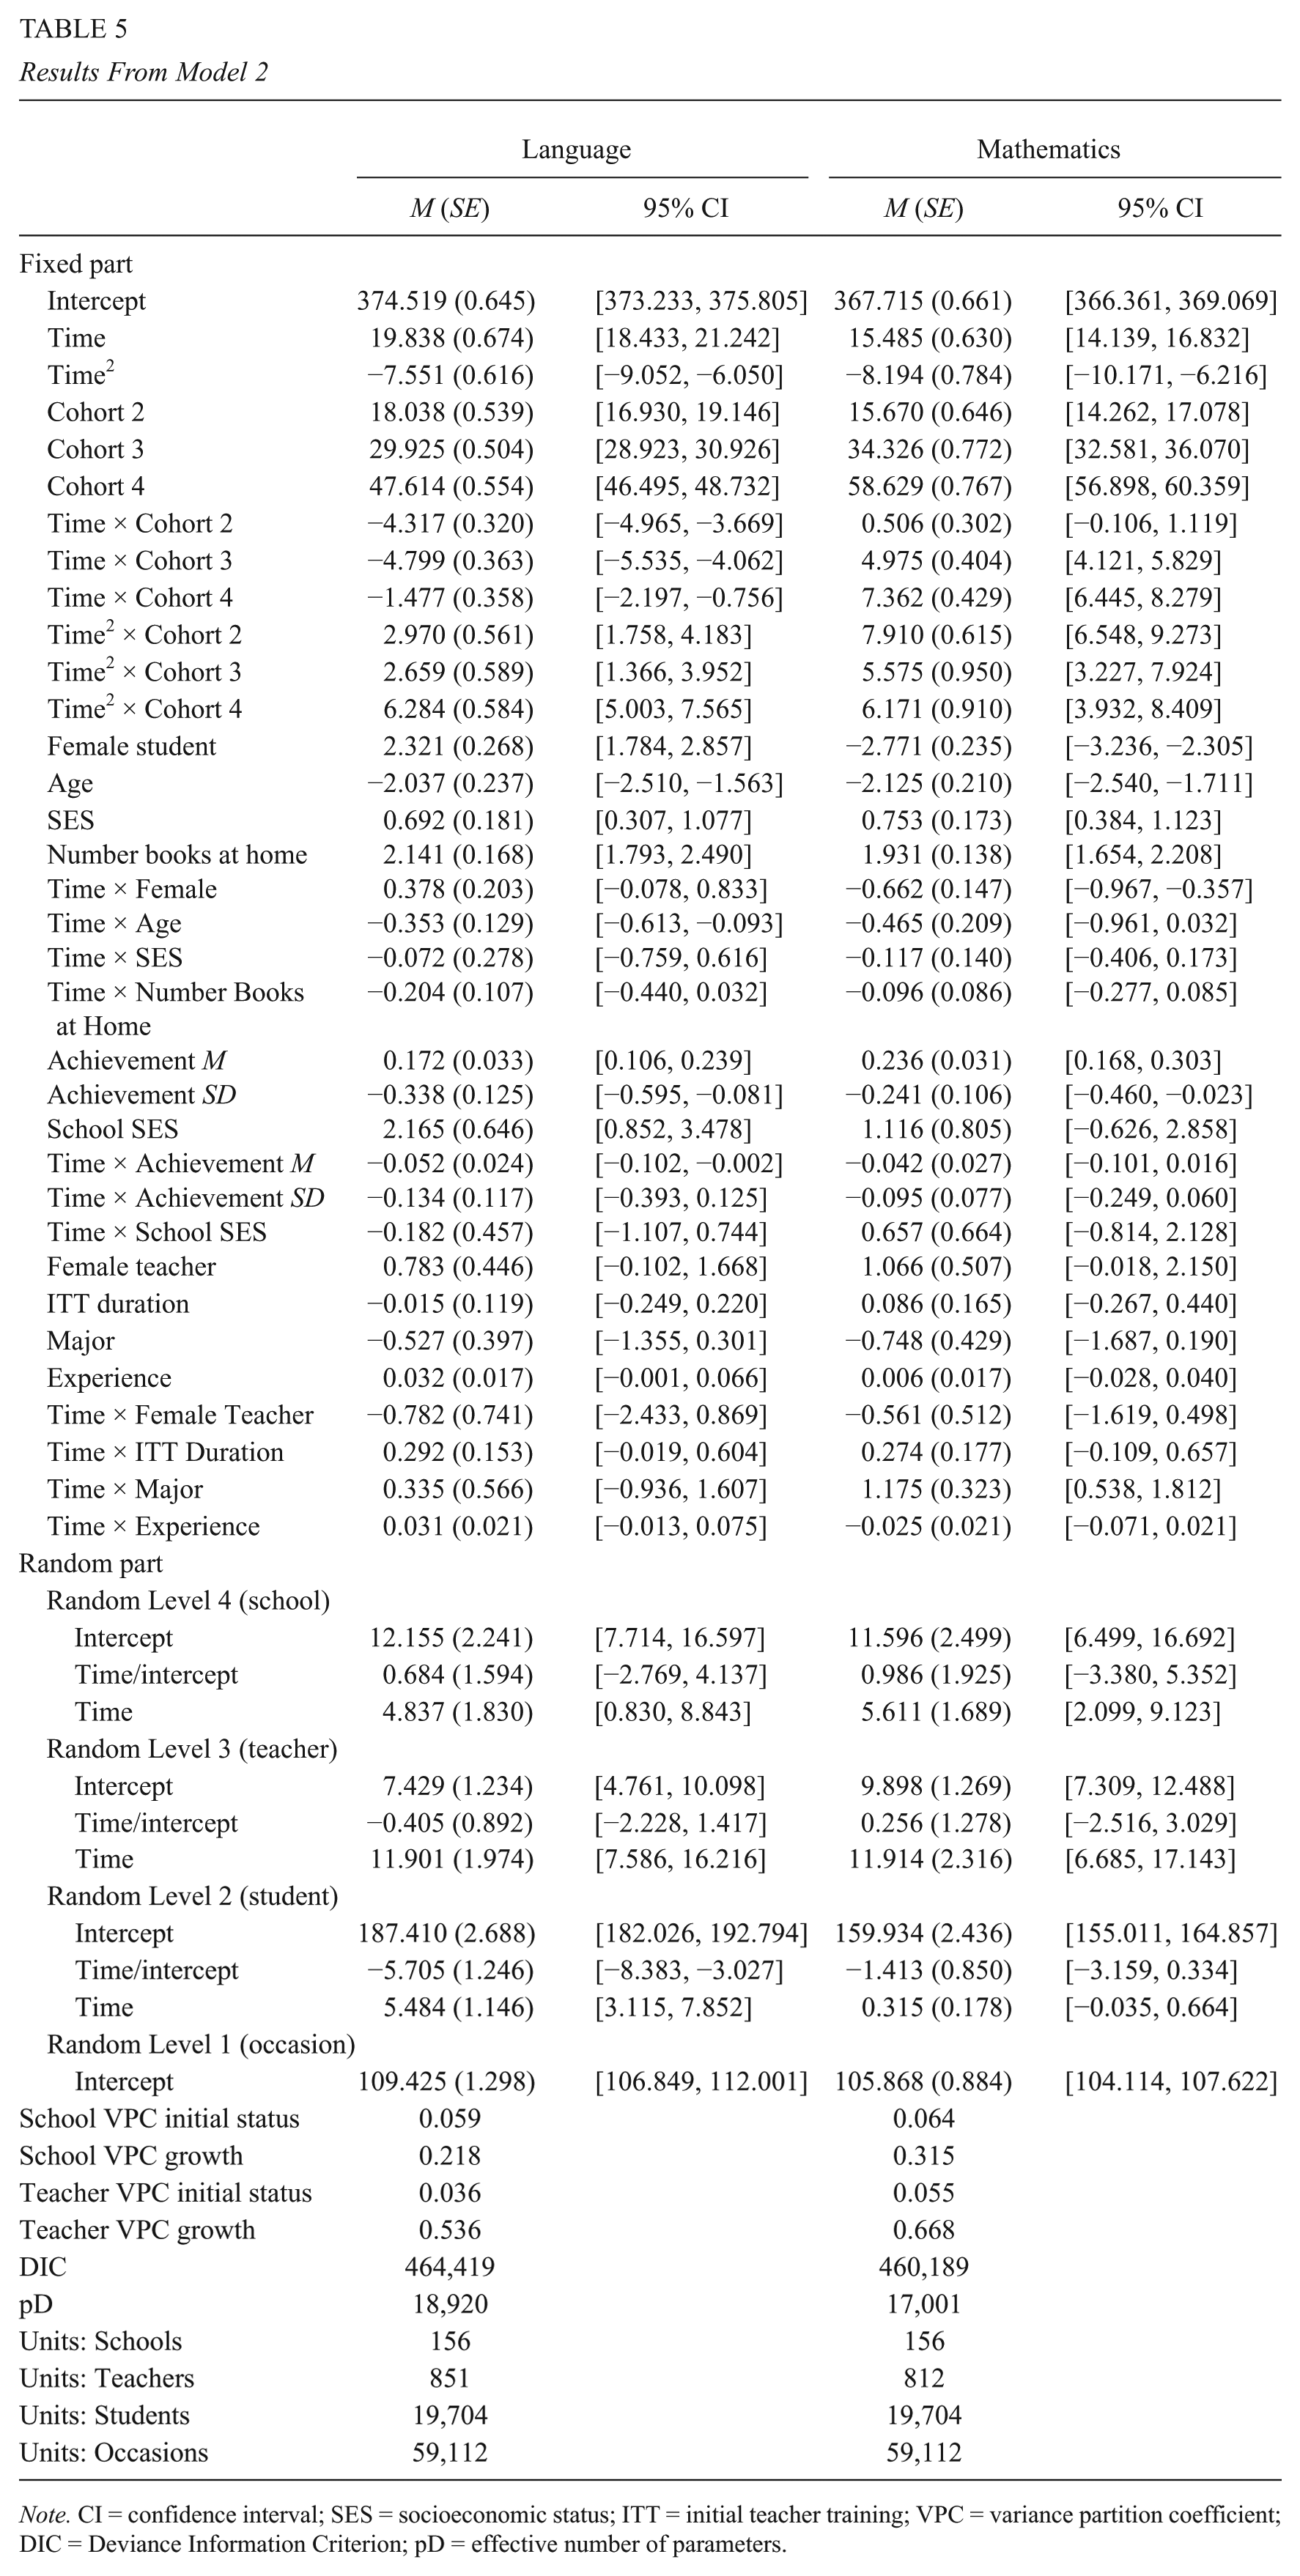
In Model 2, the teacher-level variables Female Teacher, ITT Duration, Major, and Experience were introduced. The inclusion of these variables does not lead to a significant improvement in model fit, as the DIC values increase in comparison to Model 1, in both subjects (ΔDIC = 19 in language, and ΔDIC = 24 in mathematics). Furthermore, the addition of the teacher-level variables explained only 8% and 6% of the teacher-level variance in achievement status observed in Model 1 in language and mathematics, respectively, and a negligible proportion of the teacher-level variance on achievement growth in both subjects.
As shown in Table 5, the interaction effect of the variable Major and the Time variable was found to be associated with achievement growth in mathematics, indicating that students with teachers that hold a major in mathematics show higher growth rates in the subject. This suggests that subject expertise in mathematics is important and associated with higher student achievement growth rates in primary school. The rest of teacher-level variables were neither significant predictors of student achievement status nor of student achievement growth.
Results From Model 2
Note. CI = confidence interval; SES = socioeconomic status; ITT = initial teacher training; VPC = variance partition coefficient; DIC = Deviance Information Criterion; pD = effective number of parameters.
Teachers’ Cumulative Effects
The use of a cross-classified multiple membership model (Model 3) allows the depiction of teachers’ cumulative effects by capturing both, the cross-classification of students and teachers and the multiple membership of students’ scores to teachers. Results from Model 3 are shown in Table 6.
Results From Model 3

Note. CI = confidence interval; SES = socioeconomic status; VPC = variance partition coefficient; DIC = Deviance Information Criterion; pD = effective number of parameters.
In both subjects, Model 3, which incorporates the multiple membership of students to teachers, fits the data better than Model 1 that does not include this multiple membership component and, therefore, assumes that teacher contributions disappear from 1 year to the next. This is suggested by an important reduction on DIC values from Model 1 to Model 3 (ΔDIC = −388 in language, and ΔDIC = −167 in mathematics). These results indicate that previous teachers continue to influence student achievement scores later on in time.
Given the limitation of the three time points available in this study, it is only possible to look at growth across 2 academic years for each student and results reveal teacher effects remain cumulative in this time scale, in both language and mathematics, for the multiple cohorts covered from Grade 3 to Grade 8.
Model 3 assumes that teacher effects persist undamped into the future. We tested this assumption by comparing seven alternative teacher weighting schemes. These multiple membership weighting schemes assume that the order in which teachers taught a given student is important, with the final teacher assigned to have a greater influence than earlier teachers or with each teacher being more important than the last. When we compare the DIC of these models (see Appendix 5, available in the online version of the journal), to that of Model 3, we can see that the model with alternative Weighting Scheme 3, which assumes a contribution to teacher effects of 10%, 30%, and 60% from the teacher in the first, second, and third year, respectively, fits the data significantly better in language (ΔDIC = 165). In turn, the model with alternative Weighting Scheme 2, which assumes a contribution to teacher effects of 20%, 30%, and 50% the teachers in the first, second, and third year, respectively, fits the data better in mathematics (ΔDIC = 116). Interestingly, the rate of decay of teacher effects is similar but not the same across academic subjects, as earlier teachers seem to have a slightly larger effect on students’ later achievement.
Discussion
This study has examined teacher effects on student achievement trajectories with more advanced methods than in most previous research. First, a three-time point longitudinal design was used. Previous studies have largely relied on cross-sectional data or two data–point designs, which provide very limited information on intraindividual variability to study change. As previous research has shown, the precision of the parameter estimates is improved with three time points (Raudenbush & Liu, 2000; Rogosa, Brand, & Zimowski, 1982).
Second, the effect of teachers on student achievement trajectories was studied by means of multilevel models that incorporated crossed-classified and multiple membership random effects over accelerated growth curves. From the literature reviewed, it has been found that most methodological examinations have neglected the crossed nature of the data when modeling teacher effects. The multilevel models applied soundly distinguished within-student, between-student, between-teacher and between-school variability in a partially crossed design. Thus, the study is methodologically innovative and advances prior research.
Also, as we studied teacher and school effects with nonexperimental data, it is important to consider that teachers and students are neither distributed randomly among schools nor within schools. The estimated effect of teachers would be biased if the allocation of teachers and students into schools and classes induce a correlation between teacher characteristics and unobserved variables that impact student achievement. Although research based on cross-sectional data is not likely to overcome this issue, analyzing the impact of teachers in promoting student academic achievement using longitudinal data and controlling for relevant covariates can help to address it. Thus, an important advantage of the longitudinal approached used is that it can enhance the validity of causal inferences in nonexperimental research, by making possible some control over selection effects.
Although the methodological approaches discussed above make a contribution to TER, theoretical implications are also important. The analyses presented indicate that teacher effects are substantially larger than previously reported in Chile, due to the use of more appropriate models and measurement. The study also confirms that teacher effects at primary school level exceed school effects. It is clear that educational effects are larger when achievement progress over time, rather than achievement status, is studied, which confirms that teachers and, to a lesser extent, schools make an important contribution to variations in student achievement growth. Also, the contribution of teachers to student achievement growth seems to accumulate over time, at least in the time scale studied (2 academic years), and this holds for multiple cohorts from Grade 3 to Grade 8.
These results also reveal that teacher effects in an emerging economy such as Chile are similar in magnitude to those found in postindustrialized countries. However, the specific mechanisms generating these large teacher effects could not be explored in this study.
There are two main limitations in this study: the lack of representativeness of the sample for some important variables (see Appendix 1, available in the online version of the journal) and missing data. With regard to the former, students who are younger come from more advantageous home environments and attend high-SES, private and large schools are slightly over-represented in the analytical sample, and those attending low-SES, public and private subsidized schools are slightly underrepresented. The implications of this for the study are a potential reduction in variance at the school and teacher level which would mean that the estimates of school and teacher effects might appear lower than they otherwise would. Thus, the differences between the characteristics of the population and the composition of the study’s sample demand caution with regard to the interpretation and generalization of findings.
With regard to the treatment of missing data, as explained above, there were particularly large proportions of missing data on the dependent variables, due to attrition. This was the result of students changing schools as well as schools leaving (while others joined) the SEPA project during the period under study. As data were MAR, the issue of missing data was dealt with by implementing a suitable strategy for the data, namely, multilevel MI on all the variables in the models, including the dependent variables. Results obtained under this method were robust to those obtained with alternative approaches for dealing with missing data (i.e., LW and MID). We accommodated the hierarchical data structure of the data, as much as possible, in the imputation process, by means of imputing data with test scores in wide format, students as Level 1, and schools as Level 2. However, to our knowledge, the software available have not yet implemented MI for models more complex than two-level model and, to date, there is no evidence on the effects of imputing cross-classified data as purely hierarchical. An important avenue for future research would be to explore what imputation procedures are more appropriate when dealing with cross-classified and multiple membership data structures.
Conclusion
The aim of this study was to investigate the magnitude of teacher effects in Chile, their predictors, and the extent to which they accumulate over time. This study addressed three important gaps in the literature as it, first, explores teacher effects in the context of an emerging economy using a dynamic perspective, second, contributes further evidence on the properties of teacher effects on student achievement growth (i.e., magnitude, predictors and cumulativeness), and, third, advances the field methodologically by demonstrating the combined use of accelerated longitudinal designs, growth curve models, and cross-classified and multiple membership specifications.
One clear implication of these analyses is that TER should move toward a dynamic perspective to estimate both teacher and school effects on student achievement, this is, an approach that focuses on their contribution to students’ achievement trajectories. A promising strategy shown in this study is to use a cross-classified random effects model, as Raudenbush (1993) proposed. The analyses reported here suggest that cross-classified random effects models lead to findings of larger teacher effects. The magnitudes found are comparable with those reported in the few previous studies that have also accounted for crossed grouping factors in the data when estimating teacher effects (Palardy, 2010; Raudenbush, 1993; Rowan et al., 2002). Furthermore, the study contributes with evidence to a key debate in EER (Luyten, 2003) as it shows that teacher effects outweigh school effects, although both are significant.
The study also reveals that only relatively small numbers of individual teachers can be reliably distinguished as either significantly more or less effective than others. Thus, using achievement data for high stakes accountability purposes such as rewarding or sanctioning individual teachers would be inappropriate, due to issues of reliability.
Also, the teacher-to-teacher differences in effects on student achievement growth imply that some students make less academic progress than they would otherwise be expected to make, due to the influence of teachers and schools in which they are taught. It is then important to explain why these differences in effectiveness occur as this could provide indications on how to improve teaching effectiveness broadly.
Although the input teacher variables tested in this study (i.e., teacher gender, duration of ITT, and years of teaching experience) did not account for an important proportion of the variation on teacher effects, holding a major in mathematics was found to be predictive of student mathematics achievement growth in primary school. This variable can be seen as an indirect measure of teachers’ knowledge of the content being taught and this result is in line with prior research, which has found positive effects of measures of teachers’ knowledge on student achievement (e.g., Greenwald et al., 1996). Although more research is needed in this area, this is a first indication that actions toward improving teachers’ levels of subject specialization in Chile can promote student achievement progress, and that differences in terms of subject-specific training of teacher education programs should be monitored.
Although not addressed in this study, the international evidence also suggests that classroom process variables, if well measured, hold promise for explaining differences in teacher effectiveness. Indeed, the fact that a sizable percentage of between-school and between-teacher variance remains unexplained after controlling for the available student, school and teacher variables indicates that malleable educational conditions rather than merely student selection factors are likely to account for differences in student achievement growth. EER has drawn attention to the centrality of classroom processes in determining schools’ overall academic effectiveness. In this line of research, quality of teaching and teacher expectations have been shown to play an important role in promoting students’ learning (Carnoy, 2007; Muijs et al., 2014; Pianta et al., 2011).
Finally, the cross-classified multiple membership random effects model showed that the effects of teachers accumulate over time as previous teachers continue to influence student achievement scores in subsequent years. The rate of decay underlying these cumulative teacher effects was explored, favoring models that assume that teacher effects dampen over time as students grow and are exposed to other teachers and learning experiences.
Supplemental Material
DS_10.3102_0162373718781960 – Supplemental material for Teacher Effects on Chilean Children’s Achievement Growth: A Cross-Classified Multiple Membership Accelerated Growth Curve Model
Supplemental material, DS_10.3102_0162373718781960 for Teacher Effects on Chilean Children’s Achievement Growth: A Cross-Classified Multiple Membership Accelerated Growth Curve Model by Lorena Ortega, Lars-Erik Malmberg and Pam Sammons in Educational Evaluation and Policy Analysis
Footnotes
Acknowledgements
The authors thank the MIDE UC Assessment Center at the Pontificia Universidad Católica de Chile and the Chilean Ministry of Education for granting access to the SEPA and SIMCE data, respectively.
Declaration of Conflicting Interests
The author(s) declared no potential conflicts of interest with respect to the research, authorship, and/or publication of this article.
Funding
The author(s) disclosed receipt of the following financial support for the research, authorship, and/or publication of this article: The completion of the article was supported by the National Commission of Scientific and Technological Research of Chile, through the project Center of Advanced Studies on Educational Justice (CONICYT–PIA CIE 160007). This work was supported by a PhD scholarship awarded to the first author by the Program of Advance Human Capital, National Commission of Scientific and Technological Research of Chile (CONICYT–PFCHA 72100834).
Notes

Authors
LORENA ORTEGA is an associate researcher at the Center for Advanced Studies in Educational Justice (CJE) of the Pontificia Universidad Católica de Chile. Prior to this position, she was a postdoctoral researcher at the Department of Sociology, University of Tübingen, Germany, and completed her PhD at the Oxford University Department of Education. Her research interests involve the application of quantitative methods to educational research and the modeling of multilevel and longitudinal data to investigate educational effectiveness and inequalities.
LARS-ERIK MALMBERG is an associate professor of quantitative methods in education at the Department of Education, University of Oxford. His current research interests are in intrapersonal approaches to learning processes and modeling of intrapersonal data. He has published on effects of education, child care, and parenting on developmental and educational outcomes, and teacher development. He applies advanced quantitative models to the investigation of substantive research questions in education.
PAM SAMMONS is a professor of education at the Department of Education, University of Oxford, and a senior research fellow at Jesus College, Oxford. She has been involved in educational research for the last 30 years with a special focus on the topics of school effectiveness and improvement, leadership, and equity in education. She has a particular interest in the evaluation of education policy initiatives including both formative and summative approaches.
References
Supplementary Material
Please find the following supplemental material available below.
For Open Access articles published under a Creative Commons License, all supplemental material carries the same license as the article it is associated with.
For non-Open Access articles published, all supplemental material carries a non-exclusive license, and permission requests for re-use of supplemental material or any part of supplemental material shall be sent directly to the copyright owner as specified in the copyright notice associated with the article.
