



Abstract
After the U.S. Supreme Court restricted the use of race in assigning students to schools, there was a surge in advocacy of school integration based on student socioeconomic status (SES). Benefits of socioeconomic integration have been supported by various studies finding significant effects of school SES on achievement after controlling for individual student SES. This article investigates school SES effects using statewide longitudinal achievement data from several U.S. states. School SES effects nearly vanish after controlling for a student’s prior achievement or, alternatively, controlling for stable differences among students using fixed effects models. The article concludes that large school SES effects often found in cross-sectional studies are artifacts of aggregation and are not a sound basis for SES-based school integration policies.
Introduction
School SES is not the only characteristic aggregated at the school level that is hypothesized to raise achievement for disadvantaged school children. An older and perhaps larger literature exists regarding the effects of school racial composition (Jaynes & Williams, 1989), and there is also a large body of work on the effects of neighborhood composition, both racial and SES (Brooks-Gunn, Duncan, & Aber, 1997). An excellent review of the literature on these various “contextual” effects appears in Lauen and Gaddis (2013). This review covers not only student performance but also possible short- and long-term social and economic benefits.
Some policy analysts have used school SES research to argue that students from low SES families can benefit from attending schools with higher average levels of SES. Because several studies show very large effects of school SES on academic achievement, some analysts recommend comprehensive economic integration policies to raise the performance of economically disadvantaged students (Kahlenberg, 2013; Perry & McConney, 2010; Willms, 2010). Interest in economic integration increased in reaction to the 2007 Supreme Court decision that limited active racial desegregation by school authorities (Parents Involved, 2007). Economic integration, however, could be used as a substitute for racial integration. Socioeconomic integration policies have been implemented by numerous school districts, such as Wake County, North Carolina (Raleigh); Cambridge, Massachusetts; Montclair, New Jersey; and Jefferson County, Kentucky (Louisville). In the fall of 2016, the Charlotte Mecklenburg school system of North Carolina adopted a new socioeconomic integration plan to start in the 2017–2018 school year (Charlotte Mecklenburg Schools, 2016).
This study does not address all the research and policy issues relating to contextual effects. 1 Rather, the primary focus of the article is on the policy issue of socioeconomic integration of schools as a means of raising academic achievement for disadvantaged students. A secondary focus is school racial composition. As neighborhood SES and racial composition are not under the control of school boards, their potential effects on achievement (to the extent they differ from school effects) are not particularly relevant to a consideration of school policies. Likewise, while school SES may have effects on a variety of social outcomes, such outcomes are not easily available, especially in administrative data like that used in this study. Moreover, advocates of economic and racial integration of schools stress its academic benefits (Kahlenberg, 2016; Michelson, 2008).
For both policy- and data-related reasons, this study examines school SES effects at the school and grade level rather than the classroom level. Few, if any, of existing U.S. economic integration plans require SES integration at the individual classroom level, because academic benefits are expected to flow across the school without requiring integration of all individual classrooms. Of course, a socioeconomically integrated school would have a much higher level of classroom integration than would otherwise be the case.
Another objective of this article is methodological. The majority of previous studies of school SES are cross-sectional. While it is well understood that causal inferences are problematic when based only on cross-sectional data, many education policy experts have nonetheless drawn causal conclusions because of the statistical relationship between school SES and achievement after controlling for individual SES (e.g., Willms, 2010). Although longitudinal studies that satisfy time order requirements improve causal inferences, many still fail to control for important student characteristics known to impact achievement. The Lauen and Gaddis (2013) study is one of the few to demonstrate how different statistical models and controls impact on the relationship between peer SES and achievement. The present article expands on that study by using multiple statewide databases to show that school SES and racial composition effects may be largely artifacts of aggregation.
This article addresses the question of whether school SES has a significant and educationally important impact on student achievement, once individual student background and school resource characteristics are taken into account. The thesis of school SES effects is tested with three comprehensive statewide databases covering Grades 3 to 8 across multiple years, thereby facilitating panel analysis techniques. When student fixed effect specifications are estimated, the standardized effects for school SES effects in all states are less than .01 for both reading and math, thereby suggesting that large school SES effects in cross-sectional models are artifacts of unmeasured student characteristics.
Background
Several bodies of literature are relevant to this study. First, some theoretical considerations provide guidance for selecting and interpreting data used in the study. Second, some earlier studies are useful for setting up various models that are constructed and tested using the datasets available for this study. A third body of writings establishes the basic policy issues being addressed, and a fourth raises several methodological concerns that affect the interpretation of results.
The literature review by Lauen and Gaddis (2013) provides a summary of theoretical explanations for why higher concentrations of low SES students might have negative impacts on achievement. The “institutional” factors theory argues that lower SES schools are associated with lower quality teachers, less involved parents, and less rigorous curricula, which in turn cause lower achievement. Another theory posits “contagion” mechanisms whereby low SES students with lower aspirations, poorer study habits, and more disruptive classroom behavior exert downward pressure on the performance of other students. Institutional factors operate at both the school and classroom levels, while contagion effects would be more prominent at the classroom level. The institutional theory implies that school resources mediate the relationship between school SES and student achievement. The contagion theory implies that SES effects are larger at the classroom level than at the school level. Indeed, a major meta-analysis of peer effects found that SES measured at the classroom level has larger effects than SES measured at the school level (van Ewijk & Sleegers, 2010).
While these theories suggest that increases in school SES would benefit students, another mechanism has been posited to explain why the opposite effect might occur. Crosnoe (2009) provided empirical support for the occurrence of a “frog pond” effect arising from student reallocation. According to this theory, low SES students in higher SES schools with finite resources encounter reduced coursework levels and increased psychosocial complications relative to low SES students in lower SES schools. These negative frog pond effects may counter the potential achievement benefits associated with higher school SES.
Van Ewijk and Sleegers (2010) noted that more than half of the studies in their meta-analysis were cross-sectional and did not control for prior achievement. One requirement for drawing valid causal inferences using education data is that the study must consider all characteristics of students known to affect academic achievement which are also correlated with school SES. When this condition is not met, peer effects found in cross-sectional studies may be spurious and causal inferences invalid. In contrast, if a study has data on achievement over time, more sophisticated models can be applied, such as the education production functions described in Zimmer and Toma (2000) and Hanushek, Kain, and Rivkin (2009). Those models, as well as models proposed by Lauen and Gaddis (2013) and Marks (2015), will guide the empirical assessment below.
Of the many studies that have found large and statistically significant effects of school SES on student test scores, several are from Organisation for Economic Co-Operation and Development’s (OECD) Program for International Student Assessment (PISA). This project routinely conducts cross-sectional analyses of the relationship between student and school SES and student achievement. Analyzing science scores from 57 countries for PISA 2006, Willms (2010) reported an average school SES effect of 37 score points, considerably larger than the student-level SES effect of 20 score points. The 2015 PISA study concluded that most of the variation in student performance between schools was accounted for by school SES (OECD, 2016).
Similarly, Gustafsson, Nilsen, and Hansen’s (2018) analysis of cross-sectional data from 50 countries participating in the 2011 Trends in Mathematics and Science Study (TIMSS) concluded that school SES was the strongest determinant of slope differences across schools and educational systems. The van Ewijk and Sleegers’s (2010) meta-analysis found that a 1 standard deviation increase in school SES increased student achievement by .32 standard deviations. This study also found that composite SES measures produced stronger school SES effects than single SES measures, that controlling for prior achievement reduced school SES effects substantially, and that there were few differences in school SES effects according to the subject matter of the achievement test.
In the United States, there is an extensive literature on the relationship between student achievement and racial composition of schools, much of it in response to U.S. Supreme Court decisions requiring or supporting school desegregation plans (Armor, 2002; Michelson, 2008; Stephan, 1986). Most of this research focuses on African American (and, later, Hispanic) concentrations in schools, with little attention paid to socioeconomic composition. While the two measures are correlated because of their correlation at the student level, the legal primacy of racial desegregation policies made racial composition the primary focus until the last decade or so. A National Academy of Science review noted “considerable variation in outcomes,” particularly in earlier studies, but a majority of studies conclude that racial desegregation benefits Black student achievement (Jaynes & Williams, 1989, p. 329). Similar conclusions were offered in a more recent review by the National Academy of Education (Linn & Welner, 2007).
Surprisingly, few studies have examined SES and racial composition simultaneously, and results vary. At least two studies, one of high schools and one of eighth graders, have found that school SES has stronger effects on achievement than the schools’ percentage of Black students (Munk, McMillian, & Lewis, 2014; Rumberger & Palardy, 2005). Another study finds mixed effects, with SES composition having stronger effects on kindergarten growth but racial composition having stronger effects on first grade growth (Benson & Borman, 2010). There is clearly a need to examine the simultaneous effects of school SES and racial composition on more samples, which is a secondary objective of the current study.
There is another literature, mainly by economists, which examines the peer effects of achievement or ability. In this context, causal inference is more problematic because student achievement is determined at the same time as peer achievement (Lauen & Gaddis, 2013, footnote 9). This can be overcome by aggregating measures of achievement or ability from an earlier time point. There are also technical issues in separating the effects of school SES from the effects of school achievement, as they are more highly correlated at the school level than at the student level. 2 As the policy issue of greatest interest here is integration of schools by SES, rather than integration by achievement scores, the current study will limit its scope to a consideration of school SES and school racial composition.
There are several reasons why school SES effects may be upwardly biased in many studies. The first issue is measurement error. Aggregate school measures have less measurement error than the student-level measurement of the same variable, thus potentially elevating their effects in comparison with the student-level measures (Gorard, 2006). Adding random error to the student SES measure decreases its effect at the student level but increases the effect of school SES (Marks, 2015). The measurement error issue has led some researchers to describe school contextual effects as “phantom” effects (Pokropek, 2015; Televantou et al., 2015). Another issue is model specification. Almost 50 years ago, Hauser (1970, 1974) related contextual effects of SES to the ecological fallacy in that residual differences between schools are incorrectly interpreted as social processes. These differences might disappear when the analysis includes appropriate individual student-level predictors which are correlated with school residuals. In the same vein, Nash (2003) suggested school composition’s effects may be an artifact of statistical procedures caused by “unmeasured” noncognitive characteristics that impact on achievement aggregated at the school level. That is, school SES becomes a surrogate for unmeasured correlates. Thrupp, Lauder, and Robinson (2002) suggested that the effects of school SES are over-estimated without relevant controls, and advocate a full set of entry-level control variables. Using Monte Carlo simulations, Armor, Cotla, and Stratmann (2017) found that aggregated measures (e.g., school SES) produce modest spurious effects in the absence of the corresponding individual-level (SES) measure.
A third issue involves prior achievement. Including prior student achievement in multivariate (including multilevel) analyses generally produces weaker effects for school SES, sometimes approaching zero, or even becoming negative. Prior achievement is a very strong predictor of student achievement with correlations across years of at least .6, often larger (Armor, 2003; Marks, 2016). Zimmer and Toma (2000) found peer effects for classroom pretest math scores using data from a 1981 cross-national study, but only for father’s education aggregated at the school level and not for other SES indicators. Later studies show the effects for school SES tend to disappear after controlling for school-mean prior achievement or school-mean student ability (Marks, 2010; Opdenakker & Van Damme, 2001). Snijders and Bosker (2012) provided an example from a study of reading literacy in Dutch Grade 8 students in which the effects of mean school SES on literacy scores are negative in the presence of mean school IQ and student-level measures of IQ and SES. This negative effect indicates that higher SES students perform at a lower level in higher SES schools. Two Australian studies conducted in New South Wales and Victoria found that school SES effects are very small when taking into account prior achievement (Lu & Rickard, 2014; Marks, 2015). Van Ewijk and Sleegers’s (2010) meta-analysis of peer SES (cited earlier) find that the inclusion of prior student achievement reduces the effect of school SES by .26 standard deviations. This means studies that include prior achievement as a control variable yield an average school SES effect (or beta) of only .06. Thus, leaving out prior attainment/ability leads to an overestimation of school SES and other peer effects ((van Ewijk & Sleeger, 2010).
In addition to prior achievement, there are other unmeasured variables that may influence achievement, such as cognitive ability and personality characteristics (e.g., motivation). Lauen and Gaddis (2013) used student fixed effects to control for unobserved differences between individual students. Using administrative data from North Carolina, they found that classroom poverty levels had very small effects on student test scores when controlling for unobserved student differences. Another student fixed effect analysis of administrative data found trivial school SES effects (Marks, 2015).
The purpose of this study is to estimate the effects of school SES when considering other factors that influence student achievement using statewide achievement databases from three U.S. states. These databases have major advantages over cross-sectional studies. First, they are longitudinal and thus enable more plausible causal inferences. Second, they include other measures: students’ race and ethnicity and, in two states, school and teacher characteristics. Third, they are more complete datasets comprising population data from almost all students in Grades 3 to 8 within a jurisdiction across multiple years. These features allow more accurate estimation of school SES effects under a variety of specifications that include not only individual students’ SES but also other student background characteristics, teacher and school characteristics, prior-year achievement, school percent Black, and several fixed effect specifications using year, grade, and students as fixed parameters.
Data and Research Methods
The statewide achievement databases analyzed in this article are from North Carolina, South Carolina, and Arkansas. Math and reading scores are available for the total statewide population of students in Grades 3 to 8 in various years for each state: 1997 to 2005 for North Carolina, 2003 to 2006 for South Carolina, and 2005 to 2012 for Arkansas. As one of the measures used for assessing student and school SES is free and reduced lunch eligibility, these earlier years are less affected by recent changes to the national free lunch program, which have changed thresholds for eligibility (Chingos, 2016). Moreover, the longitudinal nature of these datasets allows estimation of value-added models (defined below) as students move from the third to eighth grade, as well as the estimation of student fixed effects models.
In Arkansas and South Carolina, the only SES measure available is free and reduced lunch status. During the 2000s, free lunches were available to students whose family income was up to 130% of the official poverty line, while reduced price lunches were available to students whose family income was up to 185% of the poverty line. For these two states, this three-category variable was converted to a standardized score. These scores were averaged across schools, grades, and years to form the school SES variable—thus school SES varies according school, grade, and year. As school SES is calculated by grade level, it could be denoted as “peer SES,” and that terminology will be used interchangeably with school SES. While student and school poverty are somewhat narrower definitions of SES than commonly understood, from a policy perspective, this may be an advantage because most economic integration plans are framed as reducing concentrations of poverty. Indeed, for most school districts, free and reduced lunch status is the only SES information collected and maintained in administrative databases.
In North Carolina, both free or reduced lunch status and parents’ education levels (provided by parents) are available to estimate student and school SES. The individual measures for parent education (six levels) and free/reduced lunch (three levels) were converted to standardized scores and then averaged to create the individual SES measure, and the school SES measure is the mean student SES by school, year, and grade. Thus, the North Carolina measure of SES is broader than those used for Arkansas and South Carolina.
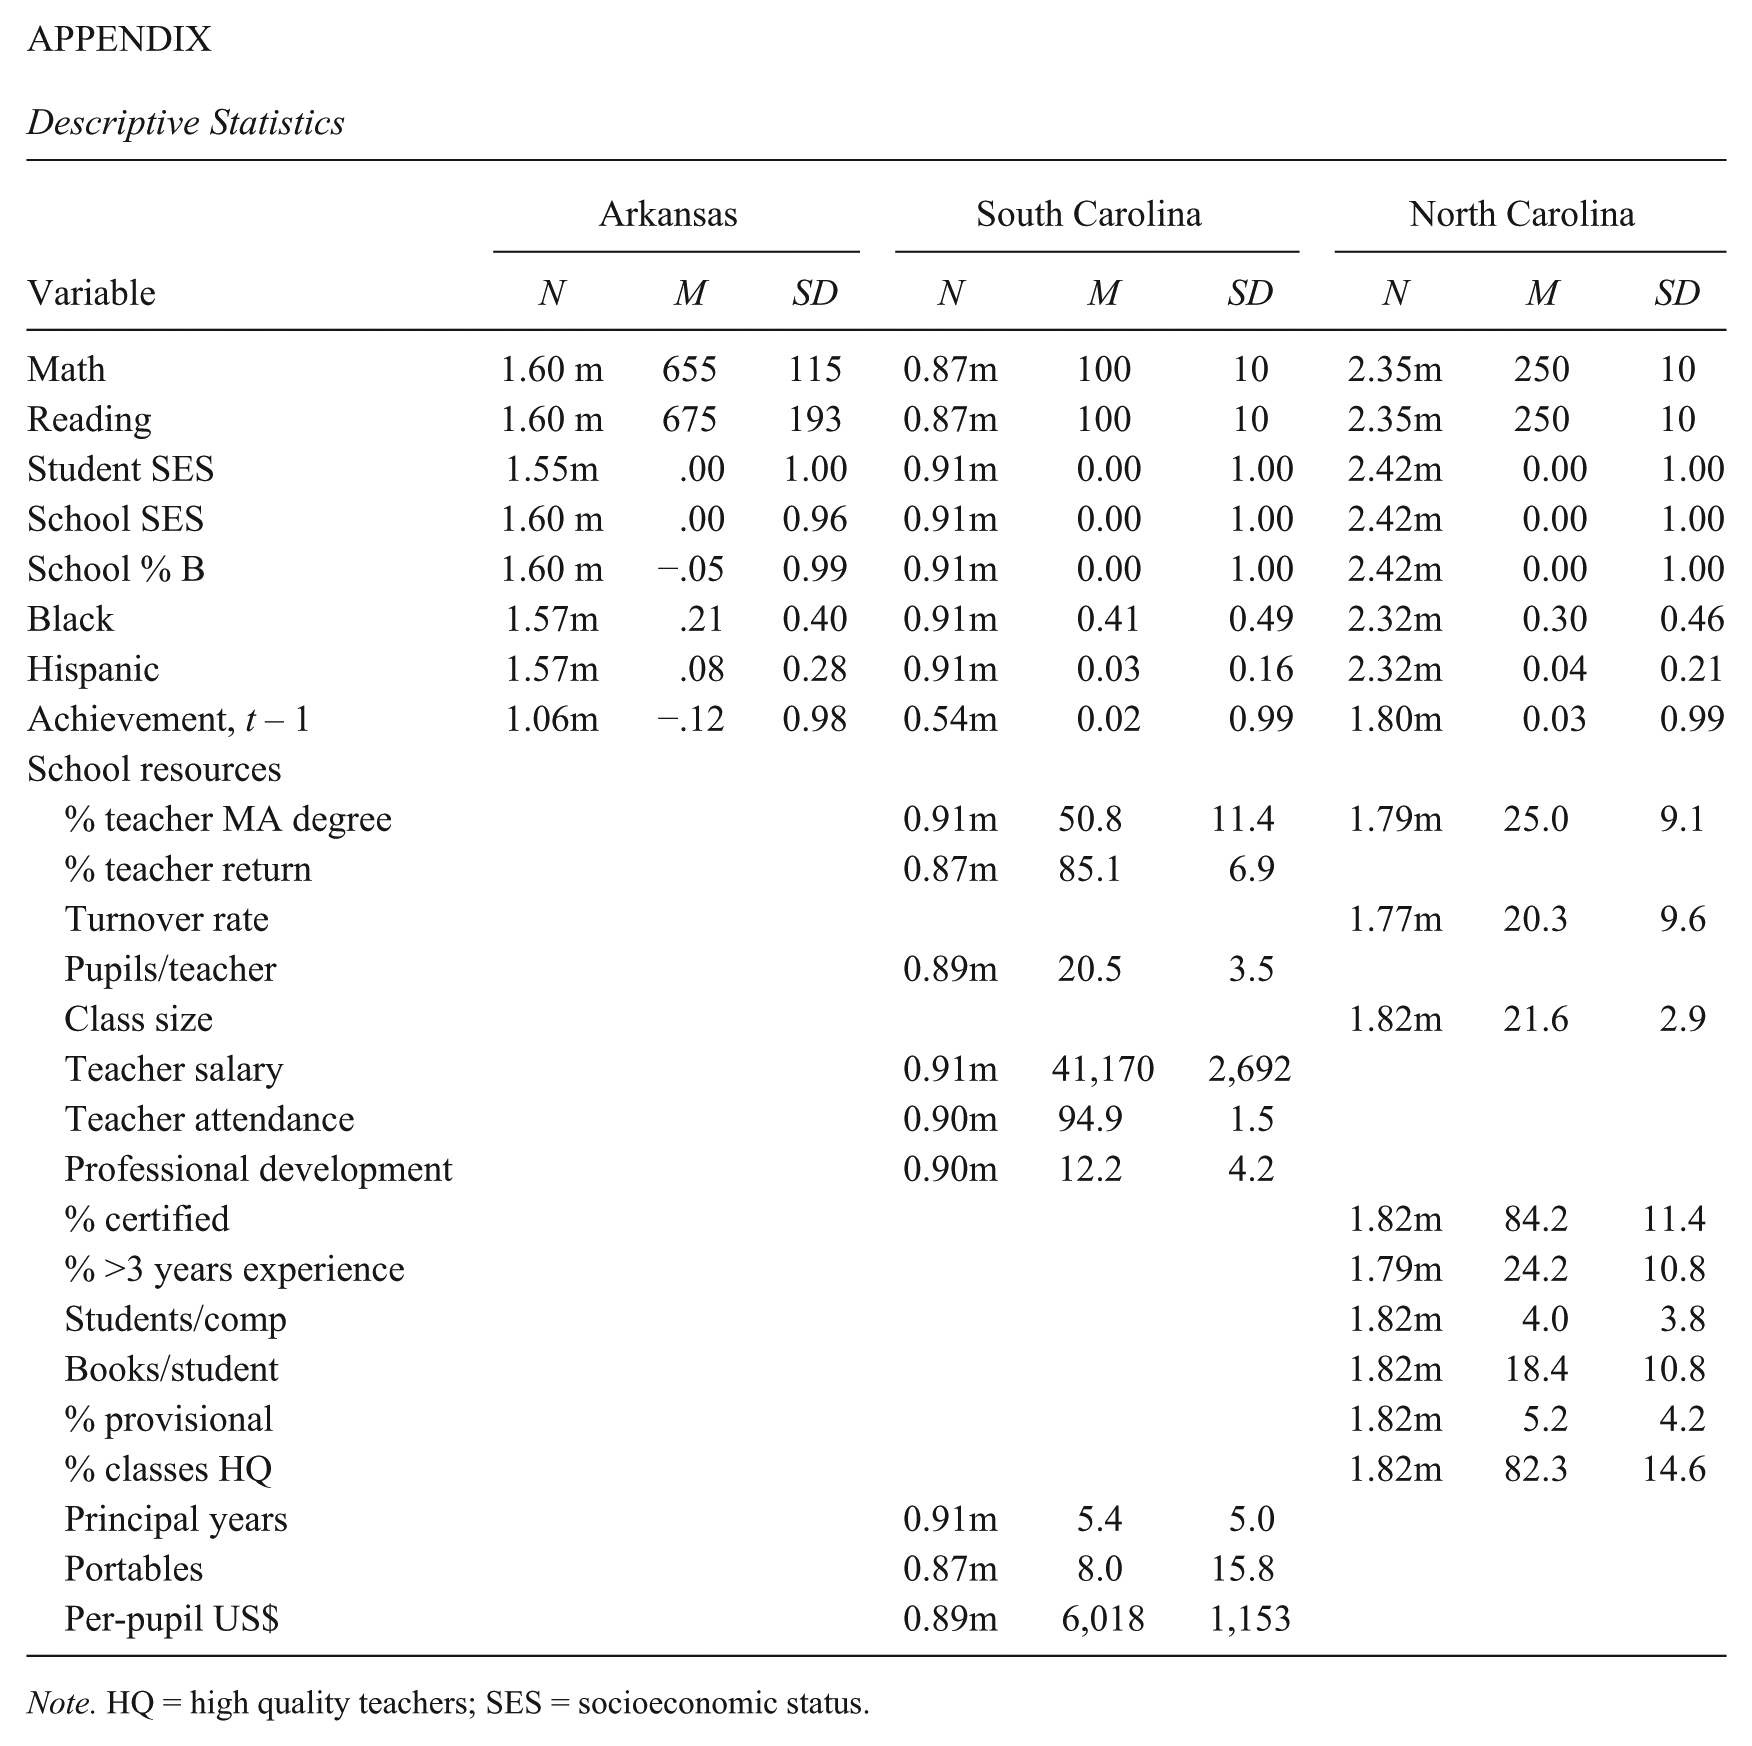
Reading and math scores have differing metrics depending on the state (see the appendix). In North Carolina, scores were standardized by grade and year to have a mean of 250 and a standard deviation of 10; the South Carolina scores have a mean of 100 and a standard deviation of 10. Arkansas test scores use a growth metric to reflect learning, so the means increase at each grade level and across years. Over all years and grades, the Arkansas math scores have a mean of about 650 and a standard deviation of about 115, although the within-grade and within-year standard deviations are about 100. The Arkansas reading scores have an overall mean of 670 and standard deviation of 190; the within-grade and within-year standard deviations are about 170.
The North and South Carolina datasets include school and teacher characteristics: years of teaching experience, education, retention rate, class size, and per-pupil expenditures, which allow testing the extent to which school SES effects are due to better school and teacher resources. The Arkansas data do not include school and teacher resource information, so it is excluded in the evaluation of school resource effects.
Before discussing the models to be tested, it is helpful to report the simple correlations between achievement test scores and school and student SES for the three states:
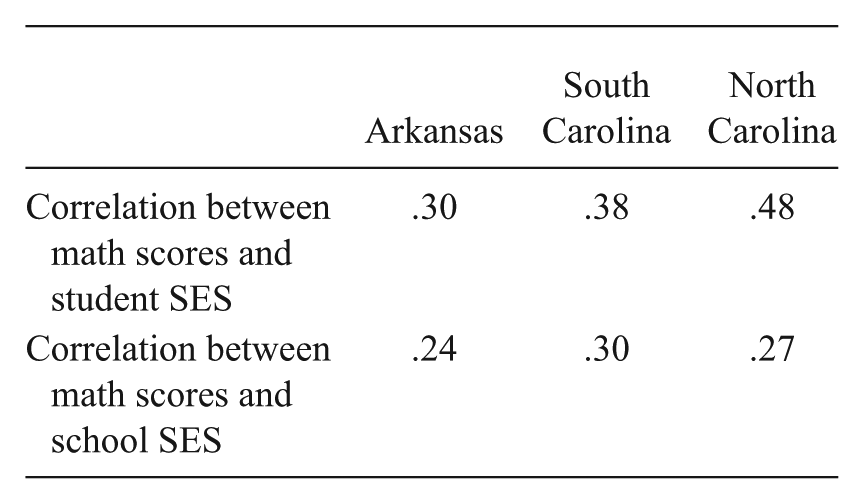
Note that, at the student level, the correlation for North Carolina is substantially higher than for the South Carolina due to a more comprehensive SES measure, but at the school level, the correlations are comparable across all three states. Not surprisingly, the student-level correlations are larger than the school-level correlations in all three cases.
Following the approaches of Zimmer and Toma (2000) and Hanushek et al. (2009), a general education production function assumes that student educational achievement is determined by a mix of student and school attributes and inputs. Algebraically, the general model postulates that math (M) or reading (R) achievement in year t for student i in grade g of school s is a function of student background characteristics B, school characteristics S, and general cognitive aptitude I. Therefore, the equation for math achievement is

From this general function, the empirical specifications for this study are developed using three different approaches for operationalizing the general achievement model: a cross-sectional approach, a value-added method, and a student fixed effects model.
Cross-Sectional Model
The first model is fashioned after the approach of many cross-sectional studies in the school SES literature:

where
The longitudinal structure of the statewide achievement databases allows for the implementation of additional controls in a pooled cross-sectional model. An expansion of the error term ε tigs , as in Hanushek et al. (2009), is useful in examining part of the confounding systematic variation that can be controlled for using panel data methods:
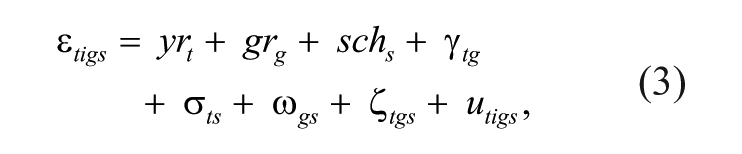
where yrt, grg, and schs are year, grade, and school fixed effects; γ tg , σ ts , and ω gs capture two-way interactions for the first three effects; ζ tgs captures the three-way interaction; and utigs is an individual-specific random term that contains the remaining error in the expanded term.
Including fixed effect terms for the dimensions of time, grade, and school accounts for factors impacting achievement that vary across one dimension while remaining invariant across the other two. These factors, such as statewide economic shocks, differences in test difficulty levels across grades, and consistent disparities in school quality, may vary systematically with aggregated poverty levels across their respective dimensions and thus introduce a spurious relationship between school SES and student achievement. The addition of these principal fixed effect terms to the model, subject to certain conditions, helps to reduce omitted variable bias.
Specifying year-by-grade fixed effects in the equation provides a control for factors that vary across time and grade levels while operating equally across schools in each state, such as possible effects from statewide learning, test content changes, and grade-level test content differences. Year-by-school and grade-by-school fixed effects absorb factors such as access to school resources within each school varying across all years and grade levels. Given that school factors might be a causal link between school SES and educational outcomes, adding school-level fixed effects could unduly attenuate school SES effects. Along with the three-way interaction, school fixed effects are not included in the final pooled cross-sectional model below.
Adding these fixed effect terms and the year-by-grade interaction term to the pooled cross-sectional model as vectors of indicators yields a more complete model:

Only two of the states in this study, North and South Carolina, have teacher and school resource measures, and the measures differ between the two. One characteristic, teachers with master’s degrees, was measured identically in both states. Two other teacher characteristics are similar: percent returning versus turnover rates and pupils per teacher versus class size. Six resource characteristics were unique to the two states: The South Carolina data have teacher salary, teacher attendance, professional development, principal experience, number of portables, and per-pupil expenditures; and North Carolina data have percentage of teachers certified, percentage of teachers with more than 3 years of experience, students per computer, percentage of teachers with provisional certificates, and percentage of classes taught by high quality teachers. Descriptive statistics for the school resource variables are found in the appendix.
While the cross-sectional model is useful in establishing the fundamental structure of the achievement function, the main problem of cross-sectional designs is the multitude of unmeasured student characteristics that can influence achievement, not the least of which is general cognitive ability. Cognitive aptitude may be strongly correlated with the presence of other school attributes linked to school SES, and its omission from the model is likely to upwardly bias estimates of school SES and other school characteristics on achievement.
Value-Added Model
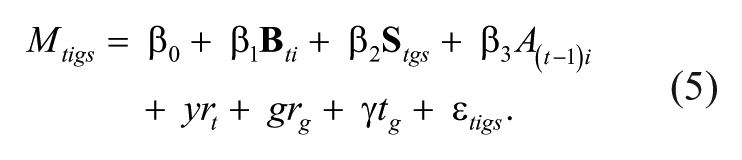
As individual cognitive ability (or IQ) measures are generally unavailable, some longitudinal studies with achievement test scores over time utilize measures of prior achievement to control for students’ general academic aptitude. As both reading and math achievement test scores are available in all datasets in this study, the first principal component of these two test scores is used as a surrogate measure for ability, denoting student achievement as Ati and prior-year achievement as A(t – 1)i. Compared with simple lagged achievement test scores—for example, M(t – 1)i—the use of A(t – 1)i as the prior achievement measure moderates random noise that can be found in single test scores, reducing the possibility of attenuation and correlated-error bias. The model for math achievement scores then becomes
Student Fixed Effect Model
Beyond the prior achievement measure, there are likely other unobserved student-level factors that influence test scores. Many of these factors are stable over time, such as general cognitive aptitudes, certain family characteristics, and conditions that influence a child’s learning skills prior to school entry, and they can be taken into account by specifying a student fixed effect model. A student fixed effect model uses students as their own baseline, and thus controls for all time-invariant student characteristics that might affect achievement test scores. The student fixed effect model becomes
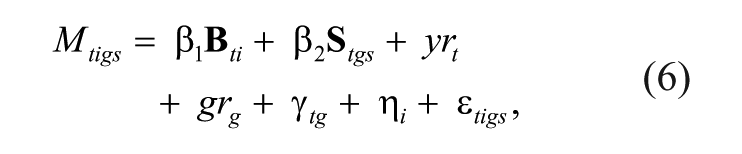
where η i is an individual-specific intercept containing student characteristics that remain fixed throughout the years in which the student’s performance is observed in the respective dataset. To avoid inconsistent estimates caused by the inclusion of a lagged dependent variable in a fixed effects framework, the term A(t – 1)i is omitted from the student fixed effect model (Hanushek et al., 2009).
Two further methodological points are in order. First, all statistical tests of significance use cluster-robust standard errors, where the number of schools is the effective N in calculating standard errors. Second, as measurement error can inflate aggregate school effects, a final brief analysis estimates the impact of measurement error on school SES effects using the simple cross-sectional model for each state.
Results
Testing the effects of school SES follows the order of the multivariate model equations in the previous section. The first analysis tests several cross-sectional models according to Equation 4, both with and without controls for school and teacher resource characteristics. The value-added model in Equation 5 is tested next, which includes controlling for prior-year academic achievement. The student fixed effects model of Equation 6 is tested last. While the primary focus of this study is the effect of school and peer SES on academic achievement, a test of school racial composition effects is also included to broaden the study of peer effects.
Cross-Sectional Models
The first set of cross-sectional regression analyses were carried out in three stages to investigate how the effects of school SES change as additional controls are added. The results, expressed in standardized effect sizes, are shown in Table 1 for math and reading, respectively. Column 1 shows the effects of student SES and school SES only, column 2 shows the effects of adding student race and ethnicity, and column 3 adds school/grade racial composition. All regressions include year-by-grade fixed effects, and all effects are statistically significant except those that are shaded.
Standardized Effect Sizes for Cross-Sectional Models (Without School/Teacher Resources)

Note. All effects are statistically significant at better than p < .05 except shaded entries; italicized effects are opposite to hypothesized direction. SES = socioeconomic status.
The first cross-sectional model in column 1 includes just individual student SES and school SES. As expected, the standardized effect of student SES on math is moderate in Arkansas (.22) and South Carolina (.31), and stronger for North Carolina (.45). Its effects on reading scores are very similar. The stronger effects for North Carolina are due to the inclusion of parent education in the SES measure. If student SES were assessed using only poverty status, the North Carolina student SES effects would be .32, very close to South Carolina results.
The standardized effect of school SES on math scores are weaker (.12, .16, and .07, respectively) with almost identical estimates for reading scores. Unlike the PISA studies cited above, student SES has considerably stronger effects than school SES for all three states. According to this model, students attending schools in Arkansas that are 1 standard deviation higher in school SES have math and reading scores that are about a 10th of a standard deviation higher, holding student SES constant. In North Carolina, if school SES was defined by poverty alone, its school SES effect would be .13, a little higher than for Arkansas.
Although the school effects are smaller than student SES effects, it can be argued they are more important from a policy perspective. Potentially, school boards can alter school composition through integration policies, but they cannot alter the SES of individual students. For example, South Carolina students in a predominantly low SES school that became a 50–50 school via an integration plan would see an increase in its school SES by more than 2 standard deviations. If the school SES effect were causal, the formerly low SES school would experience a one third reduction in the achievement gap between poor and nonpoor children (i.e., 2 × .16).
Column 2 reports the estimates with the addition of the race and ethnicity measures. These additional student background variables reduce the standardized school SES effects to .05 (Arkansas), .10 (South Carolina), and .04 (North Carolina) for math and .07, .11, and .04 for reading, respectively. In Arkansas and South Carolina, being Black has about the same magnitude of effect on math as student SES but with the opposite sign. Controlling for student and school SES, the effect of being Black reduces math scores by between .15 and .29 standard deviations. The effect of being Hispanic (vs. White) is small in Arkansas (−.04) and North Carolina (−.03), but in South Carolina, it is much larger at −.17. Clearly, the effect of school SES effect is substantially reduced with the addition of the Black and Hispanic variables, suggesting that school SES may, in part, be a surrogate for unmeasured student characteristics.
Column 3 reports the estimates from the model that introduces a second school-level variable, percent Black, to explore the relative importance of these two contextual variables. Interestingly, the magnitude of effect for school SES is generally stronger than school racial composition. In Arkansas, for example, the effect of school SES on math scores remains at .06 while the effect of school percent Black is zero. In North Carolina, the effect of school SES on reading scores is .04 while school percent Black is −.02. For reading scores, the pattern is reversed—school percent Black has an effect of −.03 in Arkansas but zero in North Carolina.
There are counter-intuitive estimates in South Carolina data: school percent Black has a positive effect of .05 on math and .08 on reading, and the effect of school SES increases with the addition of percent Black. In South Carolina, school SES and school percent Black are highly correlated, nearly −.8, compared with about −.5 in the Arkansas and North Carolina data. So, because of high multicollinearity in the South Carolina data, the percent Black cannot be reliably estimated together with school SES. It should be noted that when percent Black is entered alone, the effect on math is −.04, which is considerably smaller in magnitude than the school SES effect of .10 in the model without race.
The Arkansas data do not have any school and teacher resource variables, but such measures are available for the South Carolina data, as well as for 3 years of the North Carolina data (from 2003 to 2005). These school characteristics are added to the column 2 predictors from Table 1, and the results are shown in Table 2. For ease of interpretation, the basic cross-sectional model with race/ethnicity is shown in the first column, so the change in school SES can be compared before and after the addition of the school/teacher variables. Importantly, the addition of common school and teacher quality indicators barely moves the needle for school SES effects. Both South Carolina and North Carolina show a decline of just .01 after the addition of these school resources (second column). This means that only a very small fraction of peer SES effects are explained by school and teacher resources; in other words, there is only a very slight mediation effect in both cases. The reason higher SES schools have higher test scores is not because they attract higher quality teachers or have more school resources in general. Thus, the institutional explanation for school SES effects receives little support for these two states.
Standardized Effect Sizes for Cross-Sectional Models With School/Teacher Resources

Note. All effects are statistically significant at better than p < .05 except shaded entries; italicized effects are opposite to hypothesized direction. HQ = high quality teachers; SES = socioeconomic status.
While school resources do not explain school SES effects, another important conclusion from the analyses presented in Table 2 is that school resources and teacher characteristics do not have strong effects on student achievement. In North Carolina, seven of the nine resource measures are statistically significant but their standardized effects are .01 or less. In South Carolina, only two school resources are statistically significant: teacher salary and per-pupil expenditures. In this case, the effects sizes are larger but still small, .05 and .03, respectively. Note that the effect of per-pupil expenditures was estimated in a separate regression because of multicollinearity with teacher salaries. The average teacher salary in South Carolina in the early 2000s was about US$41,000 with a standard deviation of US$2,700 (see the appendix). Assuming the effects of teacher salaries are causal, increasing teacher salaries substantially by 2 standard deviations (US$5,400) would raise test scores by approximately 1 point on a scale with a standard deviation of 10 (an effect size of approximately .10).
Whatever the effects of increasing school resources and teacher quality, the important conclusion from the second cross-sectional model is that the effect of school SES appears to be largely independent of school and teacher resources.
Value-Added Models
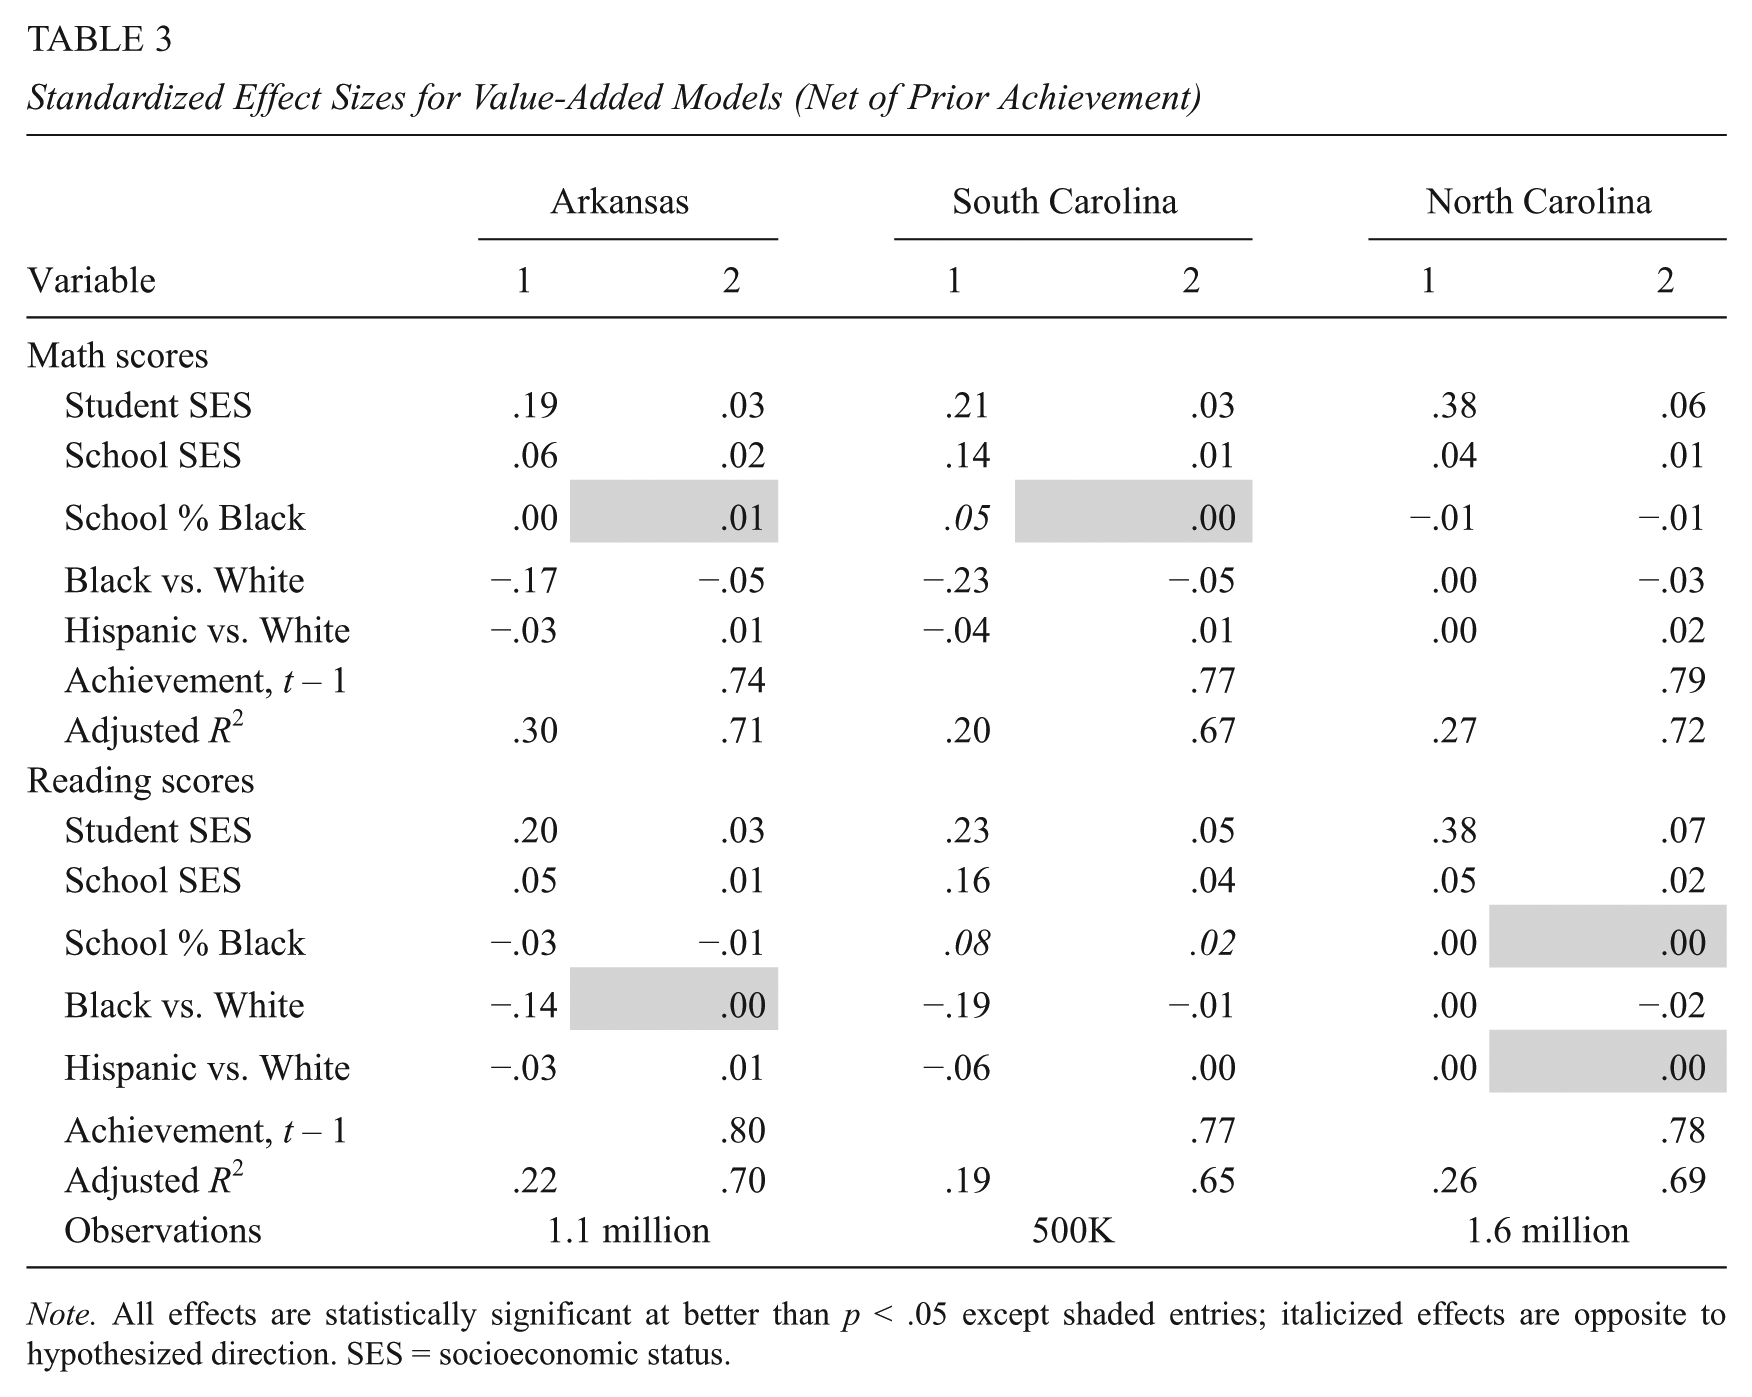
As applied to the three statewide databases, the cross-sectional models show that school SES has effects on achievement net of student race/ethnicity, school racial composition, and numerous school and teacher characteristics, although its effects are quite modest. One of the most important limitations of cross-sectional data is the inability to include measures of a student’s prior achievement. The value-added model adds students’ prior-year achievement as a predictor, as described by Equation 5 in the “Method” section. The results for the value-added model are shown in Table 3.
Standardized Effect Sizes for Value-Added Models (Net of Prior Achievement)
Note. All effects are statistically significant at better than p < .05 except shaded entries; italicized effects are opposite to hypothesized direction. SES = socioeconomic status.
The first column shows the full cross-sectional model from Table 1 but reestimated after dropping cases without prior-year achievement. Despite the loss of cases, the effects shown in column 1 for school SES are nearly identical to column 3 in Table 1 for Arkansas and South Carolina, and the North Carolina effect increases slightly to .04 from .03. Including prior achievement, shown in column 2, substantially reduces the magnitude of the school SES effects in all three states. The standardized effect of school SES is just .01 standard deviations for math in South and North Carolina and for reading in Arkansas. The effect is just .02 standard deviations for math in Arkansas and reading in North Carolina, and it is down to .04 for South Carolina reading (but multicollinearity with percent Black is still present). It is also noteworthy that the effect of school percent Black is either not significant or very small at −.01 (except for the anomalous positive effect for South Carolina reading). In other words, the effects of school SES and percent Black are very small after controlling for prior achievement.
The effects of prior achievement are very large—around .80 in each state and the explained variation of math and reading scores increased from 30% to 70%. Its addition also substantially reduced the effect of student SES to .03 in Arkansas and South Carolina and to .06 in North Carolina (where a stronger SES measure was used).
Student Fixed Effect Models
The availability of panel data, with test scores on students as they move across multiple years and grades, allows estimation of student fixed effects models as specified in Equation 6. While value-added models control for prior achievement, student fixed effects models remove the effects of all time-stable student characteristics, including innate ability, personality, and stable family background characteristics. Because the prior achievement term also estimates student basic academic ability, it is omitted from the student fixed effects models. Student race and ethnicity are also dropped because they are invariant over time.
Initial analyses with both school SES and percent Black in the model hinted at potential multicollinearity, indicated by negative signs for school SES, particularly in North Carolina. Accordingly, student fixed effect models are also estimated with these two school characteristics entered separately. Results of the student fixed effect models are summarized in Table 4. Column 1 is a model including both school SES and school percent Black; column 2 is a model that includes school SES but not percent Black; and column 3 includes percent Black but not school SES.
Standardized Effect Sizes for Student Fixed Effect Models

Note. All effects are statistically significant at better than p < .05 except shaded entries; italicized effects are opposite to hypothesized direction. SES = socioeconomic status.
The most important result shown in Table 4 is that under the student fixed effect model, the standardized effect of school SES is .01 or less in all states (column 2). Excluding racial composition, the standardized effect of school SES on math scores is 0 (ns) in Arkansas, −.01 (ns) in South Carolina, and −.01 (p < .05) in North Carolina. For reading scores, the effects are very small, at .01, −.02, and −.01, respectively. Two of these small but statistically significant effects are negative, contrary to theoretical expectations and policy arguments. In other words, when the analysis considers all stable differences between students, both measured and unmeasured, school SES has no meaningful effect on student achievement.
For the model which includes school percent Black but not school SES (column 3), the effects for school percent Black in Arkansas and South Carolina math scores are 0, while the effect is −.02 in North Carolina. For reading scores, the effect of school percent Black is statistically significant in all three states with effects of −.02 in Arkansas, +.02 in South Carolina, and −.01 in North Carolina. One might conclude that school percent Black has a statistically significant negative effect on math (but not reading) in North Carolina, although the magnitude of the effect is very small. To illustrate, the standard deviation of percent Black in North Carolina during these years is about 25 percentage points, so a student shifting from a 75% Black school to one that was 25% Black would experience a 2 standard deviation change. If the standardized effect for math is −.02, then a student’s math score would be raised by less than a half point, a minor gain.
Measurement Error
Given that student fixed effect models and even value-added models either eliminate school SES effects or reduce them to very small magnitudes, the issue of measurement error is less important. For the sake of completeness, however, adjustments for measurement error were made for the simple cross-sectional model in column 1 of Table 1. Test–retest correlations were used to estimate reliability coefficients for student SES and school SES; test score reliabilities were assumed to be .9 for reading and math in all states. 3 There was considerable variation across the states, with South Carolina having the smallest adjustments. The adjusted standardized effects for school SES (and math scores) in Arkansas, South Carolina, and North Carolina are lower after correcting for attenuation, at .09 (vs. .12), .14 (vs. .16), and .01 (vs. .07), respectively. The attenuation of the size of school SES effects found after correcting for measurement is consistent with the studies cited above that find measurement error increases school SES effects.
Analyses by Subgroups
Most discussions of SES (and racial) integration policies focus on potential benefits for low SES students or students from disadvantaged minority groups, such as Black and Hispanic students. Accordingly, it is worthwhile to inquire whether the results of the student fixed effect models shown in Table 4 are uniform across various subgroups, or whether school SES might have larger effects for disadvantaged students. There is also interest in the possibility that school SES effects might differ across grade levels.
Sensitivity analyses were carried out by applying the student fixed effect models for various student subpopulations. Rather than testing subgroup differences by developing interacted terms for the full statewide data, a more conservative approach was taken to allow the model structure to vary within each subgroup. Accordingly, student fixed effect analyses were conducted separately for Black, Hispanic, and White students; lower versus higher SES students; and elementary students (grades 3–5) versus middle school students (grades 6–8). As shown in Table 4, some analyses revealed potential multicollinearity when both school SES and school percent Black were included in the model, as indicated by significant negative effects for school SES. Therefore, school SES and school percent Black were tested in separate regressions for each subgroup. 4
For Arkansas math and reading scores, all coefficients for school SES were .01 or less and most are not statistically significant. For school percent Black, none of the math coefficients were significant except for middle schools (effect of −.01). For reading, there were several statistically significant coefficients: −.03 for Black and Hispanic students and −.02 for White students; −.02 for elementary and low income students; and –.01 for middle school students. An effect of −.03 is small in terms of the Arkansas Black–White reading gap. Assuming causality, a Black student changing from a 25% White to 75% White school would experience a reduction of the Black–White reading gap (in 2012) of about 10 percentage points. 5
For South Carolina math and reading scores, none of the coefficients were statistically significant for any subgroup. For North Carolina, the pattern was similar to Arkansas for school SES—none of the effects were greater than .01 and most were not statistically significant. For school percent Black, the results were somewhat opposite of the Arkansas results: Few of the effects for reading were significant and none exceeded .01, but several of the math effects were significant, most notably middle school students with an overall effect of −.04 (−.04 for middle school Black students and −.03 for middle school White students). Again, assuming causality, a Black student whose middle school increases from 25% White to 75% White would also experience a reduction in the achievement gap of about 10 percentage points (the Black–White gap in North Carolina is somewhat larger than the Arkansas gap). 6
Discussion and Conclusion
Using three statewide achievement datasets, this study finds significant school SES effects when cross-sectional models are estimated. These effects largely disappear, however, when longitudinal models are applied, namely, value-added and student fixed effect models. There are some statistically significant effects remaining for school racial composition in two of the states and for various subgroups, but the magnitudes of the effects are small.
While this study is not the first to find that peer SES has no effects or only very small effects on academic achievement (Lauen & Gaddis, 2013; Marks, 2015), it does extend and broaden this finding in several important ways. First, the study evaluates peer effects at the school and grade level, the relevant level for evaluating the effects of economic integration policies which have become prominent in the United States. Second, the study adds data from two additional states, South Carolina and Arkansas, to the North Carolina data analyzed in the Lauen and Gaddis (2013) study. Third, by including an analysis of school and teacher resources in two of the states, this study shows that institutional school resources do not explain the cross-sectional school SES effects. Finally, the study includes analyses of the joint effects of school SES and school racial composition, which other studies have not investigated on this scale.
Given that the effects of school SES and racial composition decrease as additional information about students is included in the models, this study offers some support for classical ideas about the ecological fallacy, but with a refinement. It is commonly assumed that the fallacy is resolved by including controls for individual SES or race, but this study suggests that the issue is broader. An effect for school SES or racial composition not only presumes the importance of controlling for individual student SES or race, but those aggregates also serve as surrogates for unmeasured student characteristics, especially prior achievement and other student and family background characteristics that are unmeasured in most studies. When these attributes are controlled in value-added and student fixed effect models, initially large aggregate effects are substantially reduced or eliminated.
The study is not without limitations. All of the states are in the southeast region of the United States, thereby raising the possibility that school SES effects might be larger in other regions, although there are no obvious theoretical or practical reasons why this should be true. Mitigating this limitation to some extent is the fact that for historical reasons, school integration policies, both racial and economic, have received greater emphasis in the southeast than in other regions of the United States. Another limitation is the definition of peer SES at school and grade level rather than the classroom level, but similar findings by Lauen and Gaddis (2013) at the classroom level in North Carolina suggest the level of analysis may not be a critical issue.
Turning to policy implications of these findings, the Supreme Court’s 2007 decision meant that school boards wishing to overcome de facto segregation could not use race to assign students to school. School boards that wished to continue diversity plans after being released from court ordered desegregation plans, such as Jefferson County, Kentucky (which includes Louisville), had little option but to adopt socioeconomic diversity plans (Semuels, 2015). Because these plans rely on poverty status rather than race, they do not raise constitutional issues. There are several policy groups that advocate socioeconomic integration plans, such as The Century Foundation and the National Coalition for School Diversity.
As stated earlier, improving academic achievement is not the only reason school boards adopt socioeconomic integration plans, because many advocates of school integration stress improved social outcomes, as well as long-term outcomes such as college graduation or occupational success. This study offers no evidence on these other outcomes. There is little doubt, however, that raising the academic achievement of disadvantaged children has been a major policy focus for school integration plans, given the major goals of school systems everywhere. Given the lack of significant achievement benefits, economic integration—particularly mandatory versions of the policy—becomes very problematic for a U.S. public that has traditionally favored neighborhood school policies.
The commonly used cross-sectional models for student achievement produce sizable estimates for school SES effects which are often comparable with the effect for student SES. However, in properly specified models using longitudinal data that either (a) control for students’ prior achievement or (b) control for stable differences between students, the effects of school SES are very small. The analyses presented in this article do not support the widely held view that school SES and school racial composition have strong effects on student achievement, and that these effects warrant policy responses such as comprehensive district-wide economic or racial integration plans.
Footnotes
Appendix
Descriptive Statistics
| Variable | Arkansas | South Carolina | North Carolina | ||||||
|---|---|---|---|---|---|---|---|---|---|
| N | M | SD | N | M | SD | N | M | SD | |
| Math | 1.60 m | 655 | 115 | 0.87m | 100 | 10 | 2.35m | 250 | 10 |
| Reading | 1.60 m | 675 | 193 | 0.87m | 100 | 10 | 2.35m | 250 | 10 |
| Student SES | 1.55m | .00 | 1.00 | 0.91m | 0.00 | 1.00 | 2.42m | 0.00 | 1.00 |
| School SES | 1.60 m | .00 | 0.96 | 0.91m | 0.00 | 1.00 | 2.42m | 0.00 | 1.00 |
| School % B | 1.60 m | −.05 | 0.99 | 0.91m | 0.00 | 1.00 | 2.42m | 0.00 | 1.00 |
| Black | 1.57m | .21 | 0.40 | 0.91m | 0.41 | 0.49 | 2.32m | 0.30 | 0.46 |
| Hispanic | 1.57m | .08 | 0.28 | 0.91m | 0.03 | 0.16 | 2.32m | 0.04 | 0.21 |
| Achievement, t – 1 | 1.06m | −.12 | 0.98 | 0.54m | 0.02 | 0.99 | 1.80m | 0.03 | 0.99 |
| School resources | |||||||||
| % teacher MA degree | 0.91m | 50.8 | 11.4 | 1.79m | 25.0 | 9.1 | |||
| % teacher return | 0.87m | 85.1 | 6.9 | ||||||
| Turnover rate | 1.77m | 20.3 | 9.6 | ||||||
| Pupils/teacher | 0.89m | 20.5 | 3.5 | ||||||
| Class size | 1.82m | 21.6 | 2.9 | ||||||
| Teacher salary | 0.91m | 41,170 | 2,692 | ||||||
| Teacher attendance | 0.90m | 94.9 | 1.5 | ||||||
| Professional development | 0.90m | 12.2 | 4.2 | ||||||
| % certified | 1.82m | 84.2 | 11.4 | ||||||
| % >3 years experience | 1.79m | 24.2 | 10.8 | ||||||
| Students/comp | 1.82m | 4.0 | 3.8 | ||||||
| Books/student | 1.82m | 18.4 | 10.8 | ||||||
| % provisional | 1.82m | 5.2 | 4.2 | ||||||
| % classes HQ | 1.82m | 82.3 | 14.6 | ||||||
| Principal years | 0.91m | 5.4 | 5.0 | ||||||
| Portables | 0.87m | 8.0 | 15.8 | ||||||
| Per-pupil US$ | 0.89m | 6,018 | 1,153 | ||||||
Note. HQ = high quality teachers; SES = socioeconomic status.
Declaration of Conflicting Interests
The author(s) declared no potential conflicts of interest with respect to the research, authorship, and/or publication of this article.
Funding
The author(s) received no financial support for the research, authorship, and/or publication of this article.