



Abstract
Affirmative action was banned in California, Texas, Washington, and Florida in the 1990s. Following this early wave, additional states banned the practice, including Arizona, Georgia, Michigan, Nebraska, New Hampshire, and Oklahoma. In response to concerns about underrepresented minorities’ falling college enrollment in flagship public universities, administrators and policymakers took a variety of steps to mitigate these declines. This article assesses the long-run changes in the racial and ethnic composition of selected universities after these bans. We find that the elimination of affirmative action has led to persistent declines in the share of underrepresented minorities among students admitted to and enrolling in public flagship universities in these states. These results imply that alternative policies and administrative decisions were unable to fully replace race-based affirmative action. Furthermore, we show that the antecedent conditions have only modestly improved in recent decades, suggesting that policymakers and administrators need to focus on improving these conditions.
Introduction
In response to immediate declines in representation by these students, university administrators and legislators tried a variety of approaches as alternatives to race-based affirmative action. Yet, the immediate efficacy of these programs was not particularly successful. Long (2007) concludes, “[t]he evidence shows a decline in minorities’ relative share of enrollment at flagship public universities after affirmative action was eliminated in several states, and the alternative strategies used by these universities have not offset these declines” (p. 315). Now, 12 years hence, this article evaluates the long-run effects of these affirmative action bans on URM representation in public universities. The central question that we answer is, “Have the collection of policies introduced by university administrators and legislators succeeded in improving the long-run representation of Black, Hispanic, and Native American students among those enrolled in flagship and elite public universities after the elimination of affirmative action?”
In the next sections of this article, we discuss the history of affirmative action in university admissions and summarize the strategies implemented by public administrators in more recent years using the University of California at Berkeley as a case study. We then discuss our methods for measuring and evaluating long-run change in URM representation among applicants, admittees, and enrollees. In the “Results” section, we show evidence that these policy and administrative responses were insufficient. Finally, we take a broader view of the issue and note the challenges faced by public administrators given persistent racial inequality observed throughout childhood.
Policy Change and Administrative Response
The more famous Brown v. Board of Education case of 1954, which challenged the “Separate but Equal” doctrine that was established in 1896 by the notorious Plessy v. Ferguson decision, was preceded by the equally important Sweatt v. Painter decision of 1950. In Sweatt, the Supreme Court unanimously held that a law school established by the state of Texas for Black students was insufficient, concluding that “[t]he legal education offered petitioner is not substantially equal to that which he would receive if admitted to the University of Texas Law School, and the Equal Protection Clause of the Fourteenth Amendment requires that he be admitted.” Following these decisions and inspired by the Civil Rights Movement and the affirmative action initiatives of the Kennedy and Johnson administration, universities began to implement affirmative action practices to boost the enrollment of minority youth, with a particular focus on Black students.
These practices included giving minority youth preferences in admission and financial aid and reserving some admissions slots for minorities. 1
These early affirmative action practices faced court challenges resulting in the Regents of the University of California v. Bakke decision in 1978. The Supreme Court’s verdict in this case was a 4-1-4 split decision with Justice Powell siding with portions of the arguments of the four justices to either side of him.
Powell voted to affirm the part of the decision stating that an admissions system that reserved places for minority applicants was unconstitutional but rejected the part that barred the consideration of race. Instead, in Powell’s opinion, a university could use a student’s race or ethnicity as one factor among many in the interest of maintaining a diverse student body. (Long, 2007, p. 315)
This opinion by Powell has been durable and was largely upheld by the subsequent decisions in Grutter v. Bollinger (2003), Gratz v. Bollinger (2003), and Fisher v. University of Texas (2013, 2016).
Nonetheless, affirmative action challenges have found more success in lower courts and in state-level decisions by voters, legislators, and public executives. The early wave of affirmative action bans began in 1995 with a resolution by the Board of Regents of the University of California (SP-1; Wallace & Lesher, 1995). This resolution was followed shortly in 1996 by the passage of the voter initiative known as the “California Civil Rights Initiative” (i.e., Proposition 209), which banned the use of race, ethnicity, national origin, and sex in university admissions, beginning with fall entrants in 1998. This initiative was the model for the parallel initiative in Washington State, I-200, which passed that fall, affecting fall entrants in 1999. Also in 1999, Governor Jeb Bush introduced the “One Florida” policy, eliminating affirmative action in admissions at Florida’s public universities. This policy, which affected entrants to Florida State University in the fall of 2000, was delayed for 1 year at the University of Florida by an unsuccessful court challenge.
In 1996, Hopwood v. Texas was decided by the U.S. Court of Appeals for the Fifth Circuit. The Hopwood case involved four White plaintiffs who had been rejected from University of Texas at Austin’s School of Law. The court held that the University of Texas School of Law may not use race as a factor in deciding which applicants to admit in order to achieve a diverse student body, to combat the perceived effects of a hostile environment at the law school, to alleviate the law school’s poor reputation in the minority community, or to eliminate any present effects of past discrimination by actors other than the law school.
The U.S. Supreme Court declined to review the case creating confusion as, in effect, the Hopwood decision pertained only to the states in the Fifth Circuit (i.e., Texas, Louisiana, and Mississippi), whereas the Bakke decision still held sway in the rest of the United States. The confusion was clarified by the 2003 Supreme Court decisions in the Grutter and Gratz cases, which abrogated the Hopwood decision. However, in the interim the “attorney general of Texas interpreted the Hopwood decision as a ban on race-based admissions, financial aid, and recruiting policies at public and private institutions in the state” (Long, 2015, p. 163). In 2001, the University of Georgia’s freshman admissions policy was found to be unconstitutional by the Eleventh Circuit Court of Appeals in Johnson v. Board of Regents of University System of Georgia, and the University dropped its affirmative action admission policy for fall 2002 entrants. After the Grutter and Gratz decisions in 2003, UT-Austin announced it would return to using affirmative action in admissions beginning with entrants in fall 2005, whereas Texas A&M University announced that it would not do so (Gates, 2003; University of Texas at Austin, 2003). UT-Austin was challenged again in the largely unsuccessful Fisher cases of 2013 and 2016.
In light of the Grutter and Gratz decisions, it became clear that court challenges were a less successful vehicle for compelling affirmative action bans. By contrast, voter initiatives paralleling Prop. 209 and I-200 found more success, with initiatives passed in Michigan (2006), Nebraska (2008), Arizona (2010), and Oklahoma (2012), while failing to pass in Colorado (2008). These voter initiatives were often described as enhancing civil rights and being antidiscrimination, which likely persuaded some voters who would otherwise support affirmative action to mistakenly vote against affirmative action. Finally, in 2011, New Hampshire’s state legislature passed House Bill 0623 banning affirmative action.
These initiative and legislative efforts may have been successful in passing due to the perception that alternative efforts by universities could be as efficacious as traditional, race-based affirmative action. Such alternate policies are summarized by Potter (2014) and include adding socioeconomic factors to the admissions decisions, increased outreach and financial support for low-income students, and dropping the practice of giving preference to “legacies” (e.g., relative of alumni).
In addition, a popular conception emerged that universities could effectively leverage de facto segregation in high schools and diversify their college campuses by automatically admitting the top students from each high school in its state. Texas was the first to try this strategy in 1998 when they began automatically admitting to any Texas public university the top 10% of graduating classes at each high school in Texas.
Florida implemented the “Talented 20” plan coincident with the “One Florida” policy, but this plan, which guarantees admission for students in the top 20% of each high school to a Florida public university, although not necessarily the campus most preferred by the student, is effectively meaningless as many of these public universities are not very selective and thus nearly certain to admit such students regardless (Long, 2004).
California instituted its own top X% plan in 1999, called “Eligibility in the Local Context” (ELC), which guarantees admission for students in the top 4% of each high school to a UC campus, albeit not the campus of their choice, beginning with the fall class of 2001. ELC was expanded in 2001 with the introduction of the Dual Admissions Program (DAP). Students “who fell below the top four percent but within the top 12-1/2 percent of each California high school graduating class” were “eligible for DAP” and “were offered simultaneous admission to a community college and a specific UC campus, with the proviso that they must fulfill their freshman and sophomore requirements at the community college with a solid grade-point average before transferring to a UC campus” (Atkinson & Pelfrey, 2004, pp. 5–6). DAP was eliminated in 2011 (Selingo, 2011) and replaced, for the fall of 2012, by a plan offering admission to a UC campus to students who are in the top 9% of all high school graduates statewide.
Other actions were taken by the UC system that might have affected the application decisions of URMs. In 2001, the UC Regents overturned their earlier decision in SP-1. Yet, this policy change was largely symbolic as the UC campuses were still bound by Prop. 209 (Schevitz, 2001). In addition, in 2009, the University of California system initiated the Blue and Gold Opportunity Plan which is “a guarantee that if an undergraduate student’s family income is less than $80,000, tuition will be covered through a combination of scholarships and state and national grants” (Kohli, 2012).
UC-Berkeley as a Case Study
We now turn to examine UC-Berkeley as a case study and evaluate the efficacy of these strategies. Figure 1 shows that the collection of policies adopted by the state of California has not been sufficient to maintain representation of Black, Hispanic, and Native American students at UC-Berkeley. This figure illustrates several trends that are repeated across many of the universities we included in our study.

Underrepresentation of Black, Hispanic, and Native American Students (URMs) at UC-Berkeley.
First, note that URMs’ share of California’s high school graduates steadily rose from 36.9% to 54.5% between 1994 and 2015 as shown by the blue line. Ceteris paribus, we would expect this demographic change to lead to an increase in URM students’ share of domestic students applying to UC campuses. Instead, URMs’ share of domestic applicants has not increased commensurately and remained fairly flat. 2
Second, as more than two thirds of UC-Berkeley’s domestic applicants come from California (College Crane, 2018) and given the University of California’s mission to provide undergraduate education to “all eligible California high-school graduates” (University of California, Office of the President, 2019), it would be reasonable to expect UC-Berkeley’s racial composition of domestic applicants to be roughly similar to California’s high school graduates. But, of course, given racial inequality in opportunities among youth, we find a large disparity between the racial composition of students graduating from high school in California and those domestic applicants who apply to UC-Berkeley (shown by the brown line). The difference between these two is shown by the brown line with open circles. This gap has hovered around 20 percentage points throughout this period. Interestingly, we do not find a substantial change in this applicant gap immediately upon the implementation of the affirmative action ban in 1998, but we do find it slightly declined in the years leading up to this policy change, which is not surprising given the initial announcement, in 1995, of the upcoming policy change. These patterns are observed in other universities as well.
Third, we observe a large decline in URMs’ share of students admitted to (green line) and enrolling in (black line) UC-Berkeley immediately upon the elimination of affirmative action in 1998. Note that prior to this ban, URMs were more represented among admittees than among applicants, and this pattern reversed immediately after the ban, thus revealing the importance of affirmative action to the admissions decisions. Among enrollees, the gap was 11 percentage points in 1995 and soared to 25 percentage points in 1998. 3
Fourth, we find that underrepresentation among students admitted to and enrolling in UC-Berkeley substantially widened in the two decades after the affirmative action ban. The enrollment gap was up to 34 percentage points by 2015. As we show below, this pattern is common among elite public universities, like UC-Berkeley, and suggests that underrepresentation will persist indefinitely without policy change.
Fifth, an alternative measure of the changes in underrepresentation at UC-Berkeley is the relative ratio of URMs’ and non-URMs’ enrollment rates (i.e., (URMs’ number of high school graduates/URMs’ number of enrollees)/(non-URMs’ number of high school graduates/non-URMs’ number of enrollees)). If this relative ratio is below 1, it indicates underrepresentation. This relative ratio stood at 0.59 in 1995. That is, URMs’ rate of attending UC-Berkeley was less than 60% of the rate of attending by White and Asian students. This relative ratio fell to 0.25 in 1998 as the affirmative action ban was implemented. Subsequently, it rose to 0.30 by 2002, while falling back to 0.21 by 2015. Yet, UC-Berkeley is an exception among the set of elite public institutions we study. As we show below, we find that the typical elite public institution saw their relative ratio fall from 0.37 to 0.31, but this drop was offset within 19 years, on average. This latter result, which is more hopeful, suggests that the measure of underrepresentation (i.e., gap versus relative ratio) matters to the conclusion, and we return to this issue.
Finally, stepping back and taking a broader view of Figure 1, it is important to note that racial parity did not exist during the era of affirmative action policies at UC-Berkeley and most of the disparity has been generated by a lack of minority representation among applicants. The composition of a university’s enrollees is driven by the composition of its applicants, whether or not the university practices affirmative action. This fact is even more evident in modestly selective public universities where the magnitude of affirmative action preference is smaller (Kane, 1998; Long, 2004, 2010). This application disparity raises questions about the precollege conditions that generate it and we return to this issue in the final section of the article.
Method and Data
Table 1 illustrates our two measures of underrepresentation for a hypothetical university, “University A.” This university is in a state with 40,000 URM high school graduates and 60,000 non-URM graduates during 1995. Thus, if this university’s 1,000 enrollees matched the racial/ethnic composition of the state, then it would have 400 URM enrollees, that is, 40% of the total enrollment. Instead, suppose this university enrolls 250 URM students, or 25% of the total enrollment. Our gap measure of underrepresentation for this university is −0.15. This measure suggests that this university would need to displace 15% of their students to achieve equal representation, that is, an increase of 150 URMs students and a corresponding decrease of 150 non-URM students.
Measures of Underrepresentation (i.e., “Gap” and “Relative Ratio”) Illustrated With a Hypothetical Example
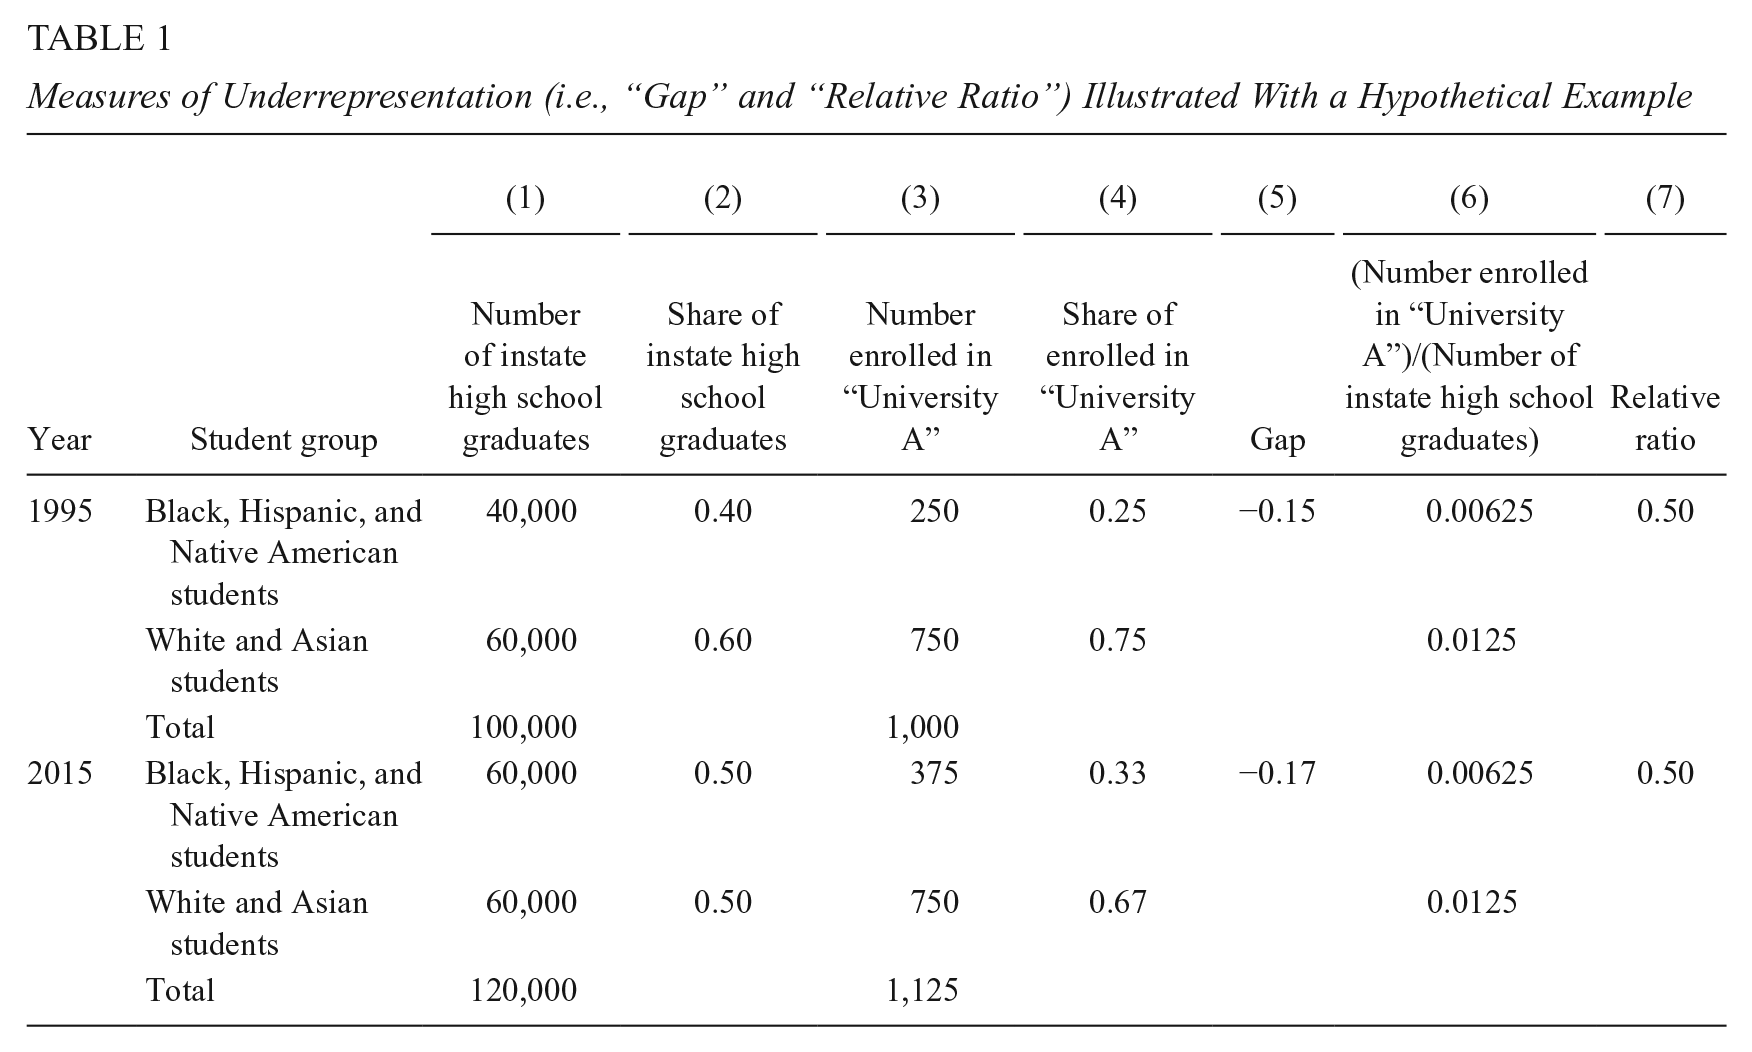
In the second panel of Table 1, we assume that, by 2015, the number of URM high school graduates had grown to 60,000, matching the number of non-URM graduates. Since one half of high school graduates in the state were URMs, we would expect 50–50 representation at University A. Suppose that University A’s number of URM enrollees increased to 375 and their number of non-URMs remained 750 such that its URMs’ share was 0.33. If so, then the gap measure of underrepresentation would grow to −0.17 (i.e., 0.33–0.50), and this result suggests we would need to displace 17% of University A’s enrollment to achieve equal representation in 2015. These results suggest that underrepresentation at University A worsened.
Interestingly, however, this result occurred even though the share of URMs and non-URMs attending University A was unchanged, as shown by Column (6). In both 1995 and 2015, 0.625% of URMs and 1.25% of non-URMs attended University A. 4 Since the relative ratio remained unchanged at 0.50, we could say that University A was doing just as well as before in attracting URM enrollment. However, our gap measure suggests that the scale of underrepresentation has worsened as the extent of the problem has grown due to the higher population of URM high school graduates. Although both measures are valid and important, we feature the gap measure in the bulk of the analysis.
We conduct three separate analyses. In the first, we consider the trends in URM representation among applicants, admittees, and enrollees among 19 selected public universities in states with affirmative action bans. In the second, we evaluate a subset of these universities that we label the “flagship” university of their respective state. The flagship is either the most selective in admissions or the sole representative of the state among our 18 institutions. These flagships include UC-Berkeley, UT-Austin, U. Florida, and the universities that are the sole representative of the state in Table 2. Our third analysis examines “elite” public universities, defined as those ranked “most competitive,” “highly competitive plus,” “highly competitive,” or “very competitive plus” by 2009 Barron’s Profiles of American Colleges (Barron’s Educational Series, Inc., 2008). This list includes UT-Austin, Texas A&M, U. Florida, U. Georgia, U. Michigan, and the UC campuses at Berkeley, Irvine, Los Angeles, Santa Barbara, and San Diego.
Selected Public Universities’ Characteristics and Data Availability

Note. “Affirmative Action Ban Years” provides the first year during which affirmative action was banned for the cohort of fall entrants. NA = data that were either unavailable or not collected for this article. URM = underrepresented minority; HS = high school.
Affirmative action was banned in Texas due to the 1996 Hopwood ruling which was overturned by the 2003 Grutter ruling. bData not available in 2005 or 2008. cData not available in 2000.
For the 19 universities in our analysis, we compiled data on the number of applicants, admittees, and enrollees by race/ethnicity. These data were obtained by a combination of searches of publicly available data listed on university websites, direct correspondence with university administrators, and, in some cases, Freedom of Information Act or state-specific Open Records requests. 5 Most of the universities did not collect data on the number of multiracial students, or began doing so very recently. As a result, we compute URMs’ shares omitting identified multiracial students from both the numerator and the denominator. That is, we compute URMs’ share as equal to the number of students identified as Black, Hispanic, or Native American solely divided by the number of students identified as Black, Hispanic, Native American, Asian American, or White solely.
We estimate URMs’ share of high school graduates by first collecting data on the number of public-school graduates in each state by race/ethnicity. These data came from the U.S. Department of Education’s Common Core of Data “State Dropout and Completion Data File” for years through 2011 and directly from state websites for more recent years. We compute the sum of public high school graduates that were Black, Hispanic, or Native American and the sum that were White or Asian American. We then inflate these sums to account for private high school graduates. We estimate private high school graduates by state, race (URM and non-URM), and year using a combination of data from the 2000 Census (Summary File 4) and 2004 through 2015 American Community Survey (1-year public use microdata sample). 6
Table 3 shows that across each of the states in which affirmative action was banned, URMs’ shares of the state’s high school graduates rapidly increased. Thus, for these states, ceteris paribus, we should expect growth in the URM share of applicants, admittees, and enrollees. 7 Interestingly, states with low initial levels of URM representation among graduates experienced the largest growth rates in their shares. For example, New Hampshire’s URM share of high school graduates more than doubled from 0.021 to 0.052, and this is consistent with an annual growth rate in the share of 6.2%. At the other extreme, Texas saw their URM share of graduates increase from 0.405 to 0.592, which was the largest absolute gain during this period, although a lower rate of growth in the share. 8
Growth in URMs’ Share of State’s High School Graduates
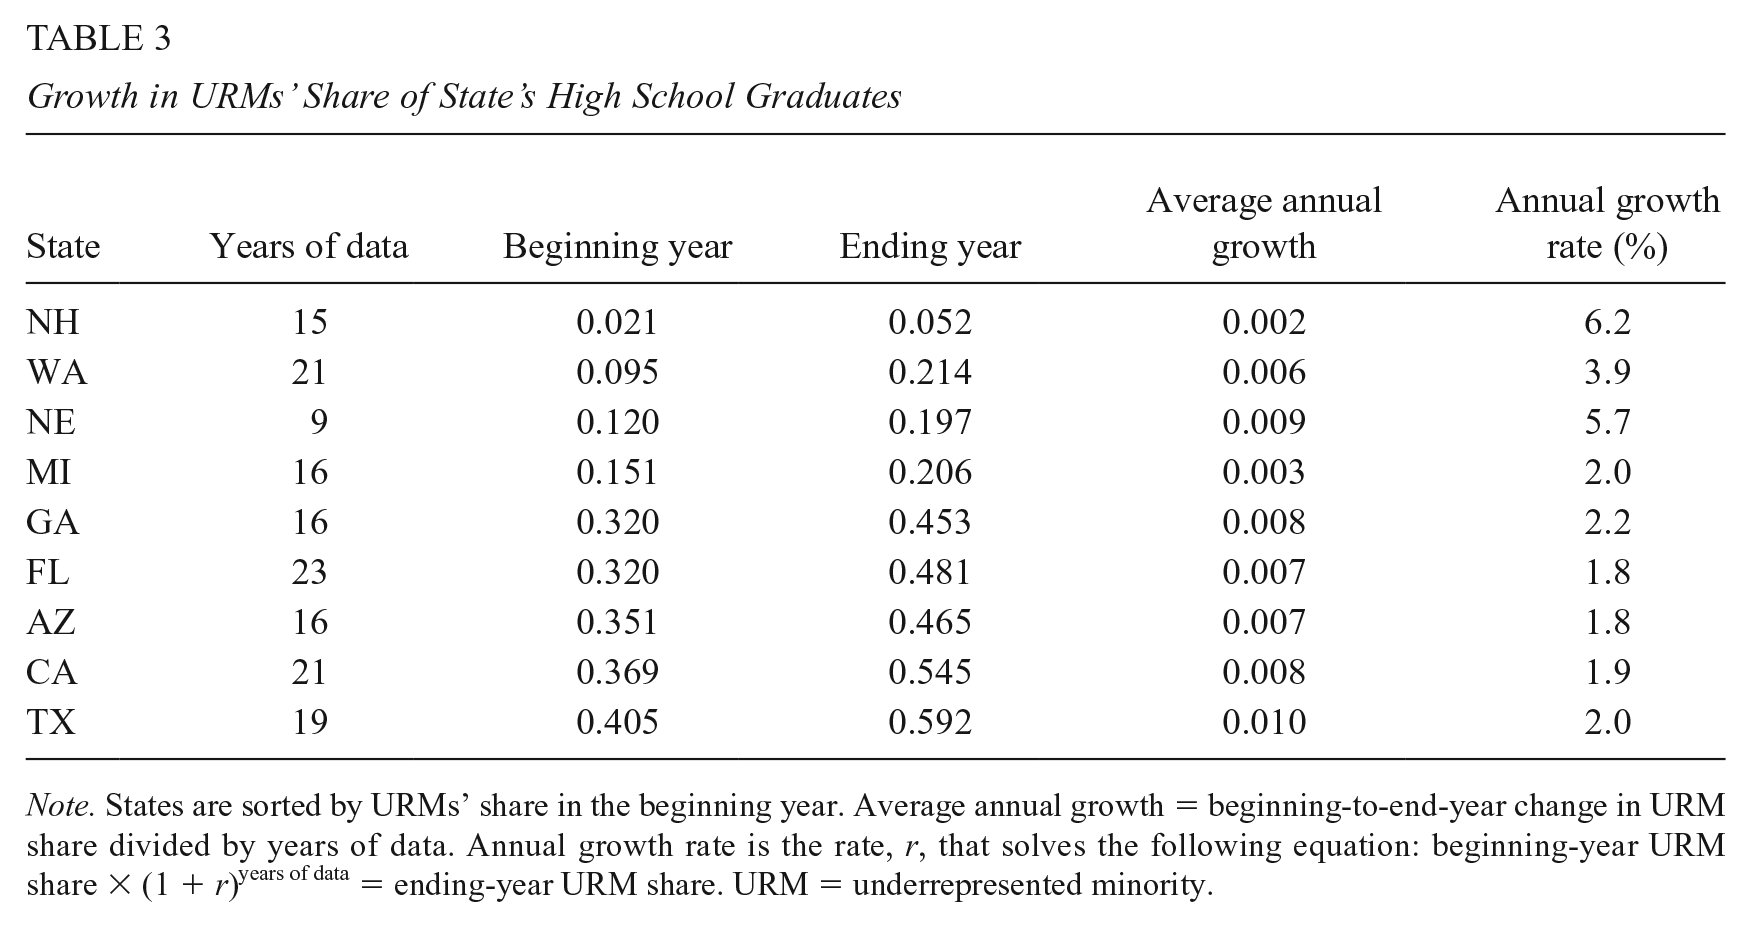
Note. States are sorted by URMs’ share in the beginning year. Average annual growth = beginning-to-end-year change in URM share divided by years of data. Annual growth rate is the rate, r, that solves the following equation: beginning-year URM share × (1 + r)years of data = ending-year URM share. URM = underrepresented minority.
We seek to assess whether the trends observed for UC-Berkeley are a general phenomenon. To do so, we compute the extent of underrepresentation for each university relative to their state’s high school graduates (i.e., the “gap”). We plot multiple institutions on the same figure by defining the x-axis as the years before or after affirmative action is banned. More specifically, we set the fall entering cohort just before the ban to
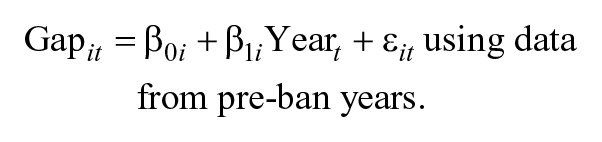
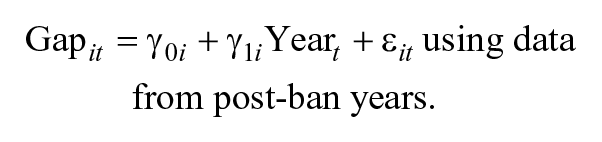
Note that the regression for the pre-ban years does not include UT-Austin and Texas A&M as they have only 1 year of data available before the affirmative action ban and it does not include UC-Merced as that campus was formed after California’s ban.
Next, we generate the following linear equations which represent the trend in underrepresentation for the typical university, and where the estimated parameters reflect averages across the universities 9 :


The immediate effect of the affirmative action ban is captured by the difference in the intercepts,
Our computations of
Finally, as previewed above, we replace
Results
Figure 2 shows the extent of URMs’ underrepresentation in each of the 19 universities among applicants (top-left), admittees (top-right), and enrollees (bottom-right). Among applicants, we find essentially no immediate effect, on average, as the
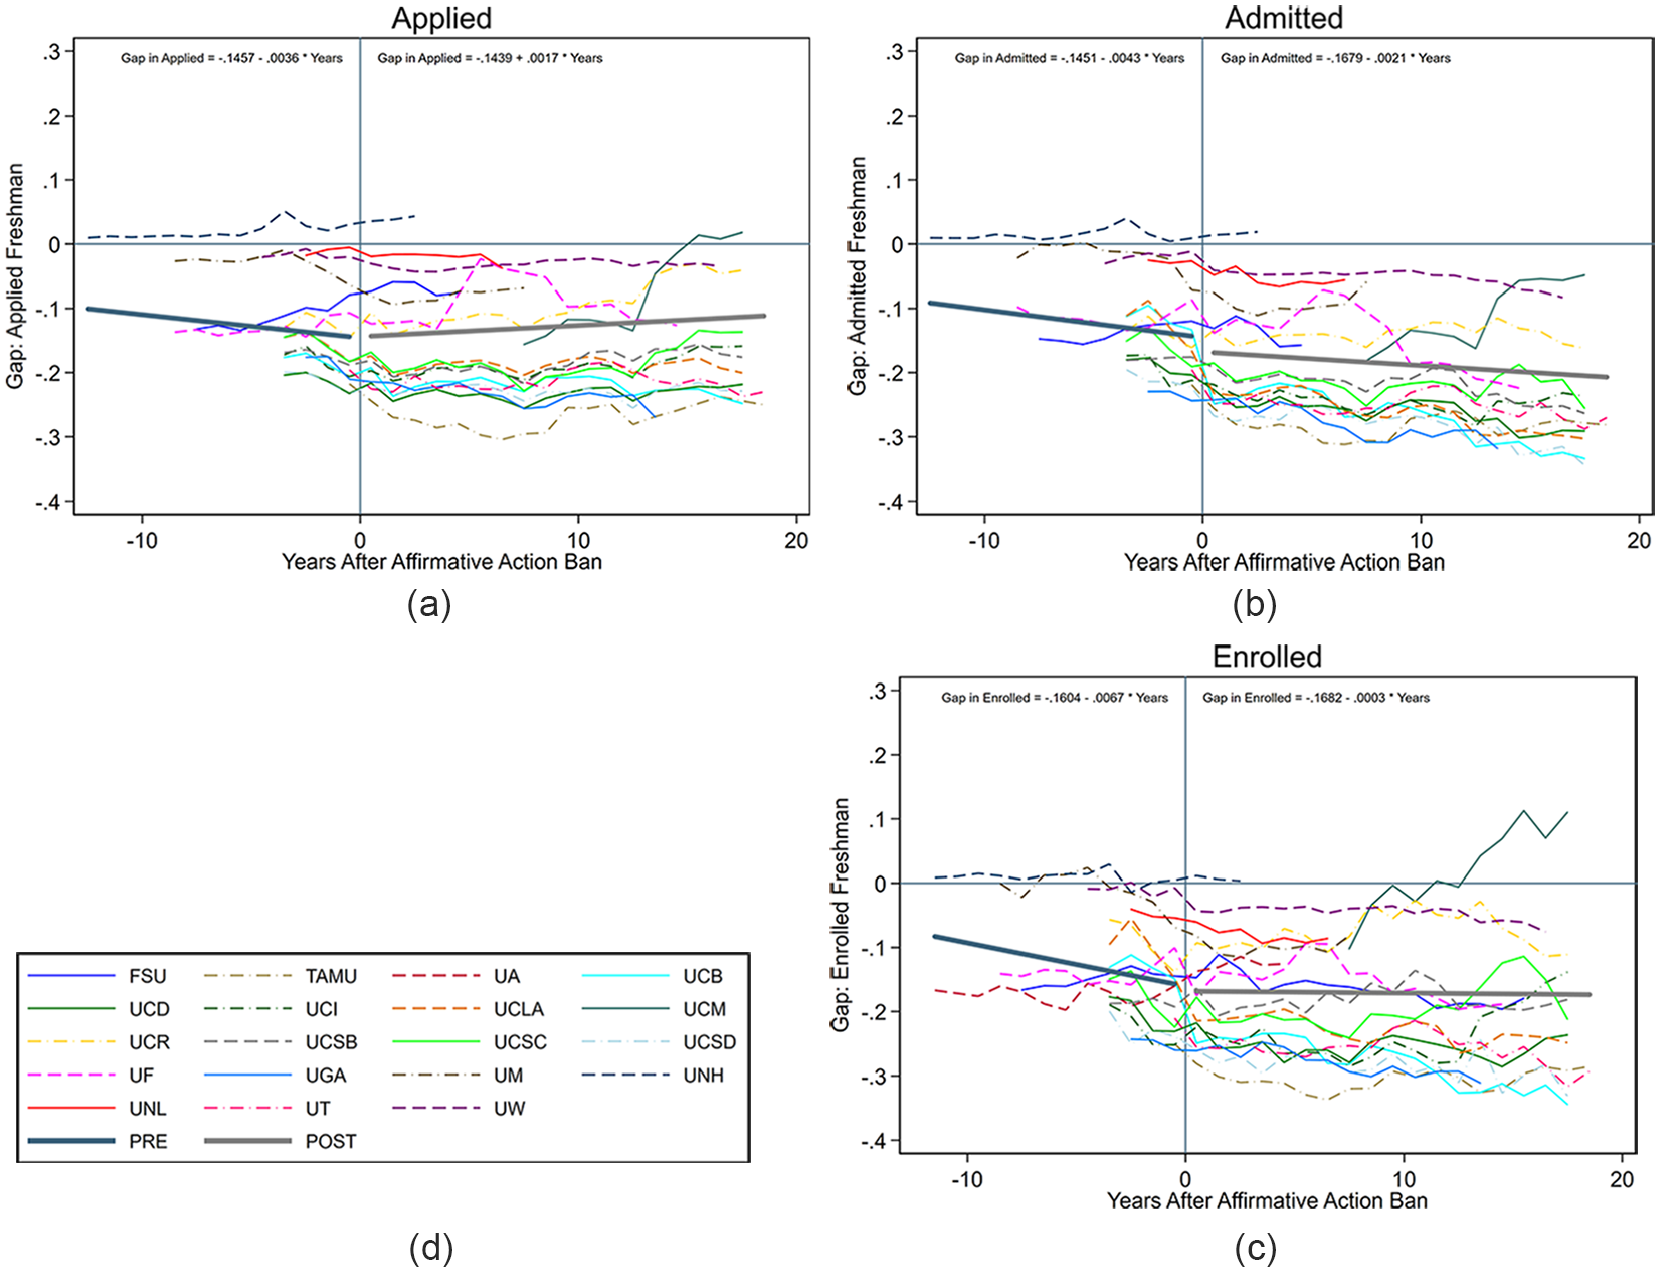
Selected public universities’ underrepresentation of Black, Hispanic, and Native American students (using the “gap” measure of underrepresentation). (d) Legend.
This positive news is not maintained when we look at admittees. Here, not surprisingly, we find a sizable decrease in URMs’ share of admittees immediately following the affirmative action bans. Of more concern, the trends in nearly all of these universities are negative in the following years. Thus, it appears that subsequent changes in admissions systems that disadvantage URMs, or, perhaps, declining relative merits of URM applicants are making it relatively harder for URMs to be admitted compared with their White and Asian American peers.
The third panel shows the effects on enrollees. Here, we find a modest, negative immediate effect followed by a modestly negative slope. Relative to the results for admittees, these results suggest that some other mechanism or policy changes must be at play (e.g., changes in financial aid) that are helping modestly offset the negative effect of admission changes. Nonetheless, these results show no promise for ameliorating long-term underrepresentation.
Finally, note the effects observed at the University of Washington. In many respects, UW is a relative success story in that the extent of URM underrepresentation is smaller than at other public universities. However, like the others shown in Figure 2, UW’s underrepresentation in enrollees grew after the ban on affirmative action and has worsened in subsequent years. UW however, like many other universities, touts their diversity. For example, in the fall of 2016, UW released a press release titled “University of Washington fall 2016 entering class its most diverse ever” (Balta, 2016). All of the credit for this supposed accomplishment can be attributed to changing demography among the state’s high school graduates rather than any particular efforts of the University.
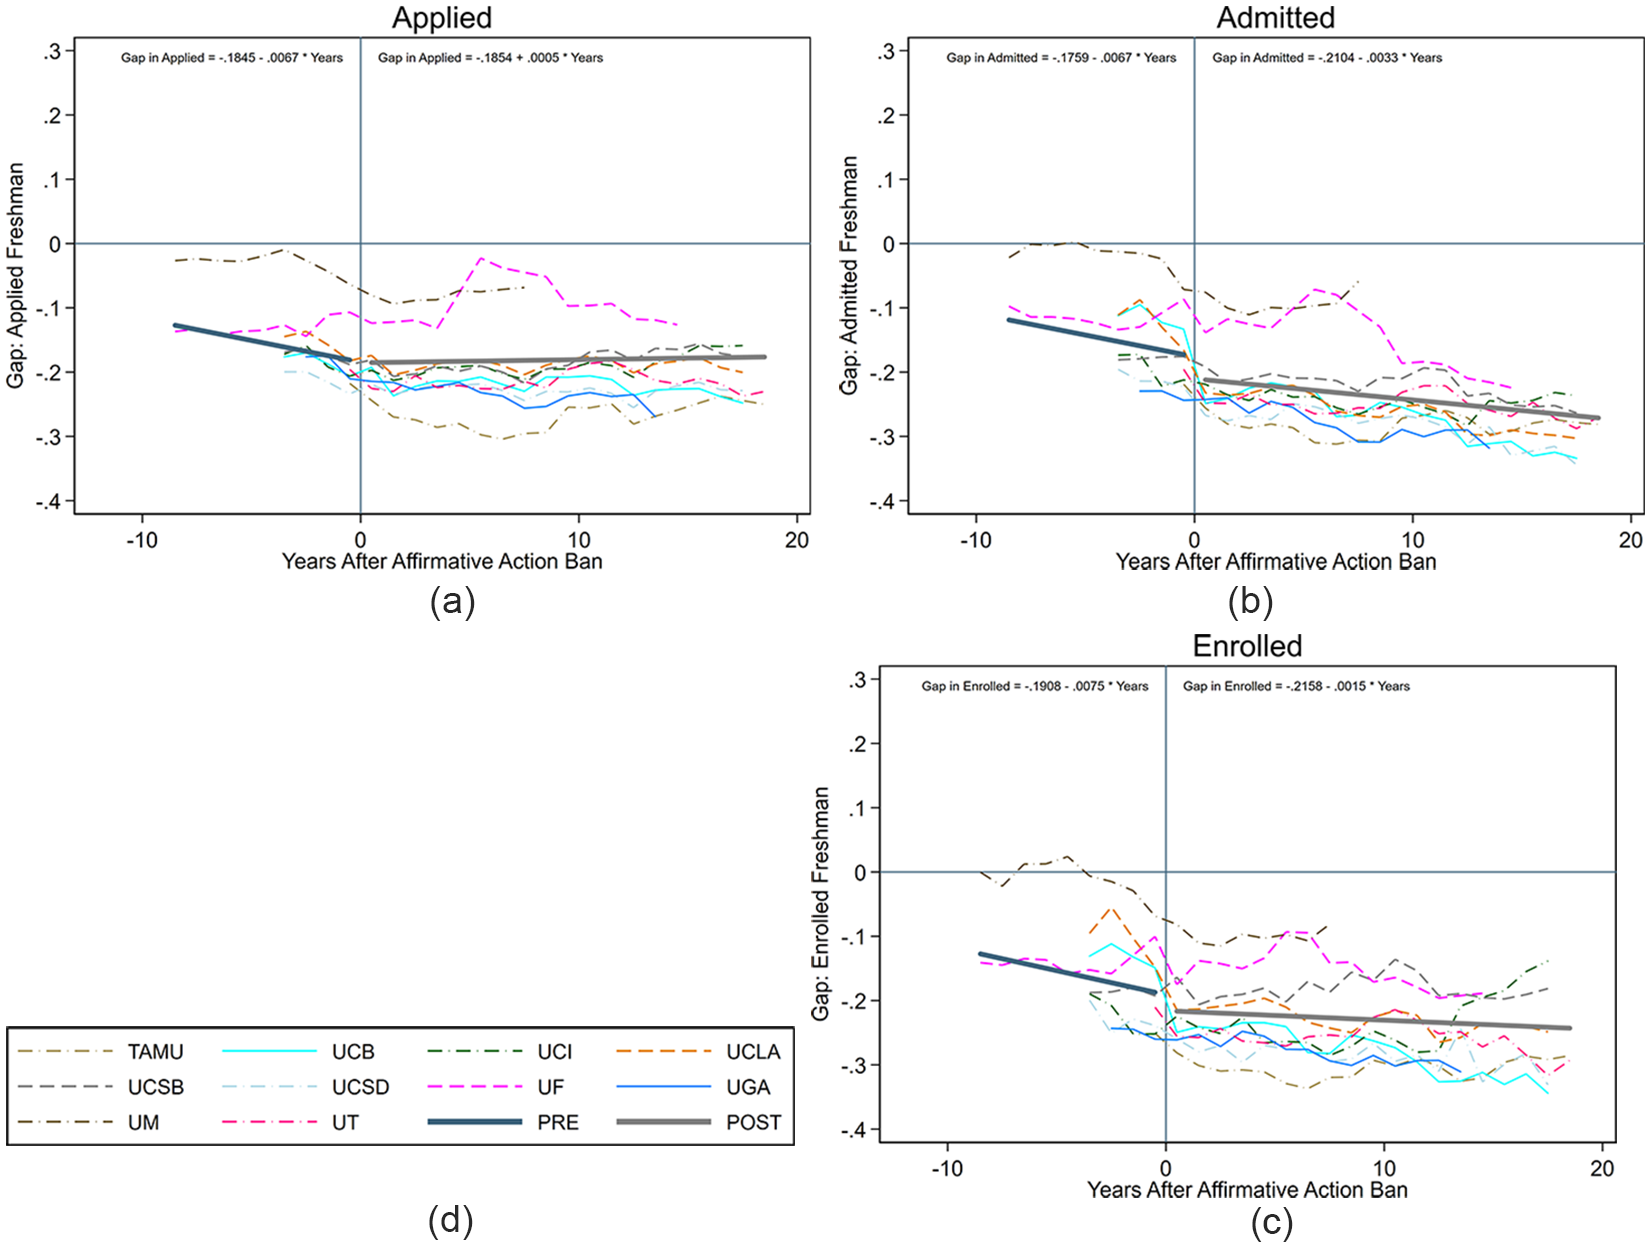
Figures 3 and 4 replicate the analysis shown in Figure 2, but with the set of universities restricted to “flagship” and “elite” public universities, respectively. The results are largely consistent with the results shown in Figure 2; however, for these restricted sets, we observe larger immediate negative effects and more negative post-ban slopes. These results show that the adverse effects on representation in these socially important “flagship” and “elite” public universities has not been ameliorated by subsequent actions at these universities.

Flagship public universities’ underrepresentation of Black, Hispanic, and Native American students (using the “gap” measure of underrepresentation). (d) Legend.
Elite public universities’ underrepresentation of Black, Hispanic, and Native American students (using the “gap” measure of underrepresentation). (d) Legend.
Table 4 summarizes the information included in Figures 2 through 4 by showing the estimated parameters of the
Immediate Effect of Affirmative Action Ban and Long-Run Changes in Underrepresentation of Black, Hispanic, and Native American Students

Note. Immediate effect of affirmative action ban is computed as the pre- to post-policy change in the intercept. Years until immediate effect is offset = not applicable if the immediate effect is positive; else computed as negative one times the immediate effect divided by the post-policy slope if the post-policy slope is positive; else infinite if both the immediate effect and post-policy slope are negative.
Next, we change our measure of underrepresentation from
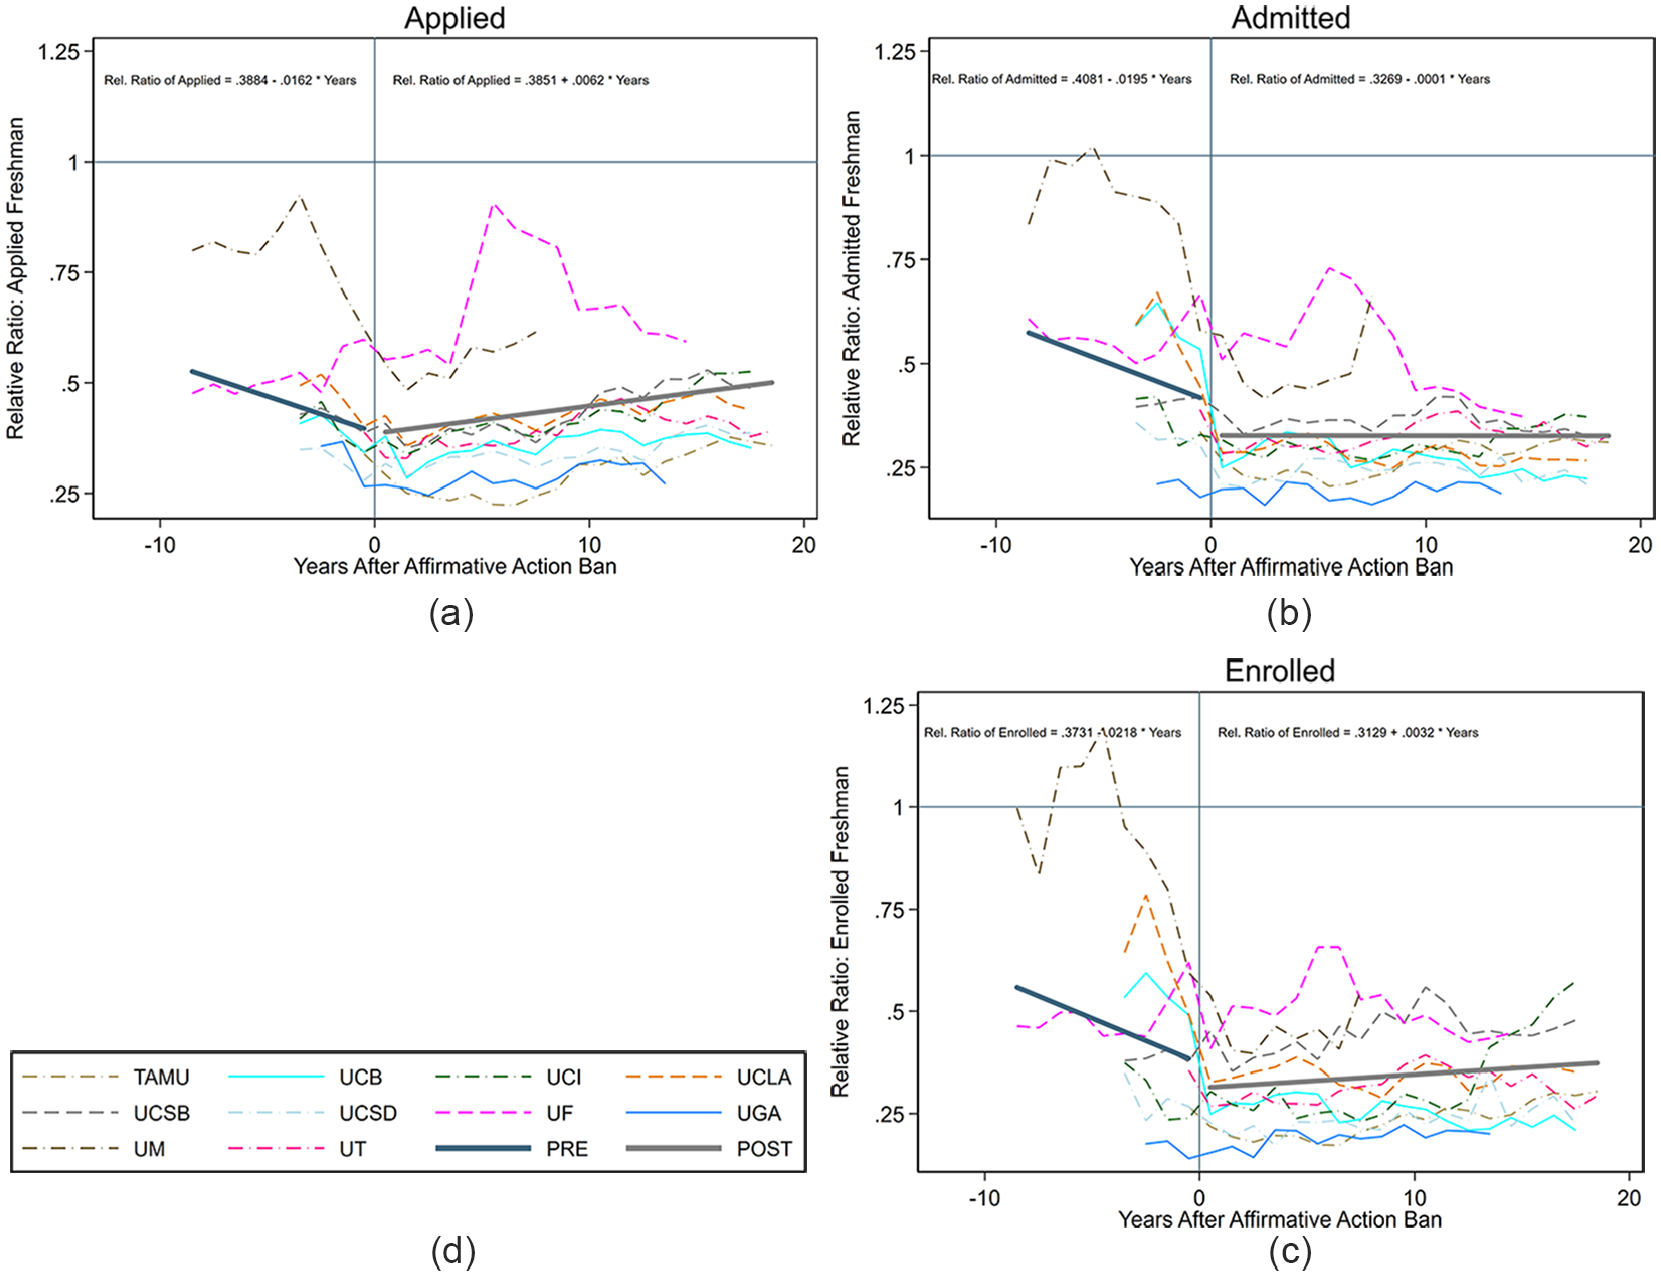
Elite public universities’ underrepresentation of Black, Hispanic, and Native American students (using the “relative ratio” measure of underrepresentation). (d) Legend.
For our final analysis, we consider whether the admission and enrollment of transfer students, including those who began at community colleges, is an important source of securing campus representation. We focus on the UC campuses as the enrollment of transfer students represents a large share of their newly enrolling students each year. In Figure 6, we show the gap measure of underrepresentation for each UC campus including transfer students with freshmen. We find that the gap in enrollment, inclusive of transfer students, slightly improved when affirmative action was eliminated despite a widening underrepresentation gap among those admitted. During the following 18 years, we see essentially no improvement in the enrollment gap at the typical UC campus. However, underlying this steady gap are some concerning results: The enrollment gap, inclusive of transfers, at UC-Berkeley, the oldest and arguably most prestigious campus, steadily increased after the affirmative action ban, whereas gains in URM representation among new enrollees were most prevalent at UC-Merced, the youngest campus. These results suggest increasing segregation across UC campuses. Finally, note that although the overall enrollment results at UC campuses appear better when incorporating transfer students, such students typically have less years of enrollment at the UC campus, and thus less exposure to the educational benefits of attending classes in a highly selective public university.
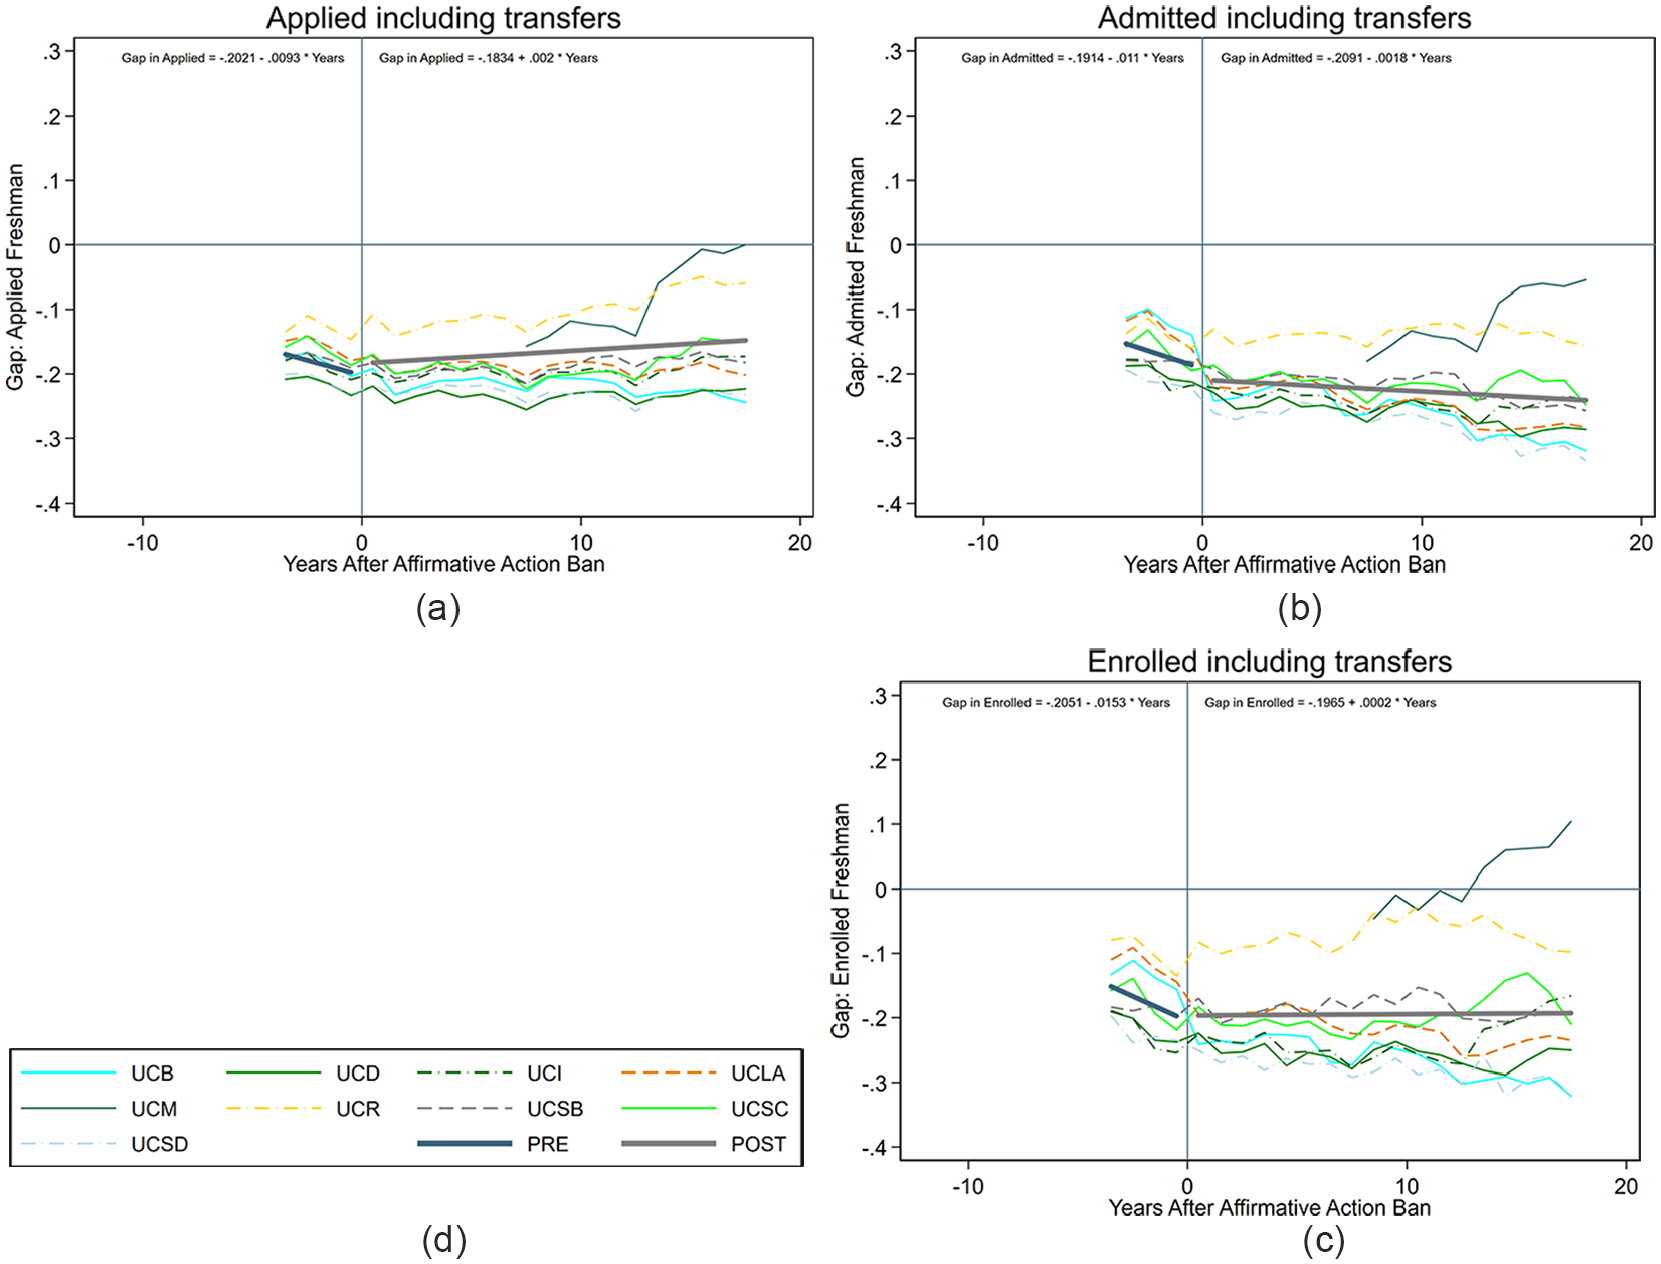
Underrepresentation of Black, Hispanic, and Native American Students at UC campuses including transfers (using the “gap” measure of underrepresentation). (d) Legend.
Conclusion: What Drives Persistent Underrepresentation in Public Universities and How Can Public Administrators Effect Positive Change?
In Supreme Court Justice Sandra Day O’Connor’s 2003 majority opinion in the Grutter case, she noted, “[w]e expect that 25 years from now, the use of racial preferences will no longer be necessary to further the interest approved today.” This reference to “25 years” reflected the 25-year gap between the Grutter and Bakke decisions rather than some systematic analysis and forecast. Krueger et al. (2006) provide such a systematic analysis and conclude, Economic progress alone is unlikely to narrow the achievement gap enough in 25 years to produce today’s racial diversity levels with race-blind admissions. A return to the rapid black–white test score convergence of the 1980s could plausibly cause black representation to approach current levels at moderately selective schools, but not at the most selective schools. (p. 232)
In the year after affirmative action was banned, Black, Hispanic, and Native American students’ share of applicants to the 19 public universities we study was, on average, 14 percentage points below their share of high school graduates in these universities’ states, whereas their gap in enrollment at these same universities was only modestly larger, 17 percentage points. Thus, underrepresentation among applicants is a major factor in Black, Hispanic, and Native American students’ underrepresentation among enrollees. In this section, we evaluate the antecedent conditions that are likely to produce URMs that are either not ready to apply to these selective public universities or are discouraged from doing so, leading to so-called “undermatching” (Black et al., 2015a; Dillon & Smith, 2013; Griffith & Rothstein, 2009; Hoxby & Avery, 2013; Smith et al., 2013). 10 The statistics that we report below (e.g., incarceration and employment rates, income, poverty, and wealth) reflect familial conditions that may shape students’ preparation for college matriculation. Note that these outcomes are themselves products of diminished college educational attainment and may create an intergenerational cycle.
We have collected a set of statistics from diverse sources that reflect the economic conditions and test scores of URMs and their White and Asian American peers, focusing on changes between roughly 1996 and 2016 (with variations in these years depending on data availability). These statistics are shown in Table 5 and reveal that most gaps in these precursor conditions are either narrowing slowly or diverging.
Changes in Racial/Ethnic Inequality Across Two Decades
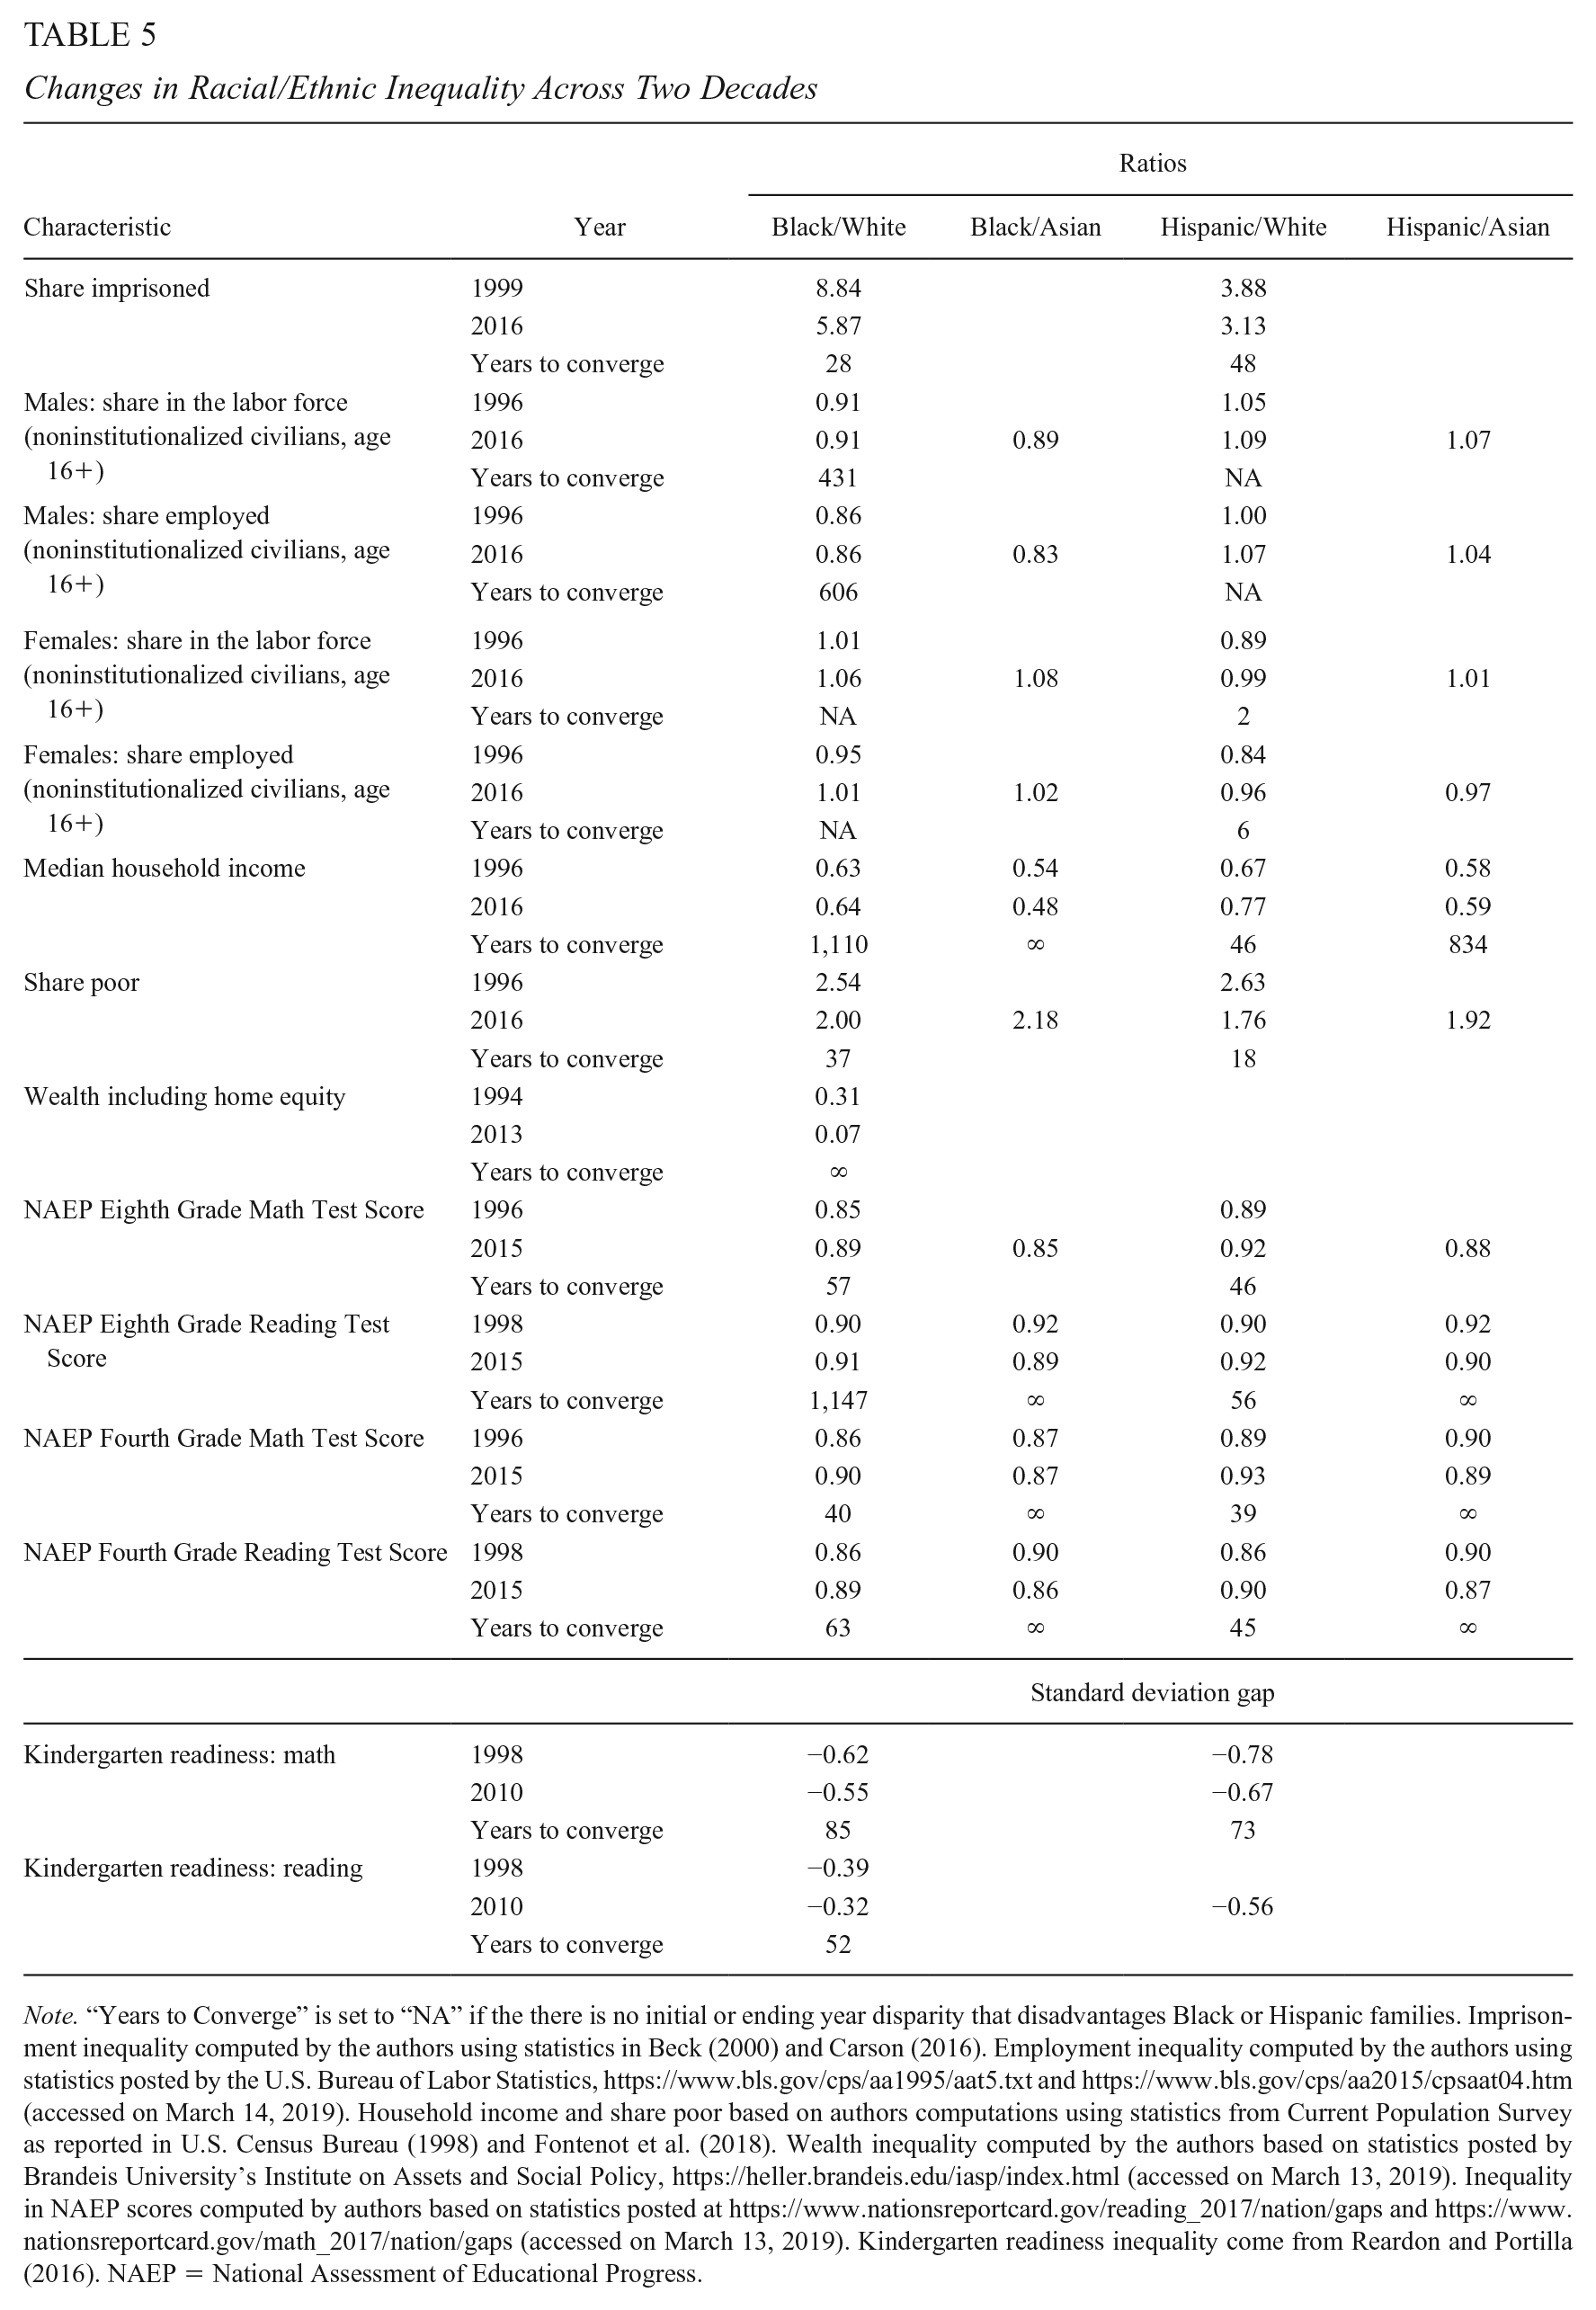
Note. “Years to Converge” is set to “NA” if the there is no initial or ending year disparity that disadvantages Black or Hispanic families. Imprisonment inequality computed by the authors using statistics in Beck (2000) and Carson (2016). Employment inequality computed by the authors using statistics posted by the U.S. Bureau of Labor Statistics, https://www.bls.gov/cps/aa1995/aat5.txt and https://www.bls.gov/cps/aa2015/cpsaat04.htm (accessed on March 14, 2019). Household income and share poor based on authors computations using statistics from Current Population Survey as reported in U.S. Census Bureau (1998) and Fontenot et al. (2018). Wealth inequality computed by the authors based on statistics posted by Brandeis University’s Institute on Assets and Social Policy, https://heller.brandeis.edu/iasp/index.html (accessed on March 13, 2019). Inequality in NAEP scores computed by authors based on statistics posted at https://www.nationsreportcard.gov/reading_2017/nation/gaps and https://www.nationsreportcard.gov/math_2017/nation/gaps (accessed on March 13, 2019). Kindergarten readiness inequality come from Reardon and Portilla (2016). NAEP = National Assessment of Educational Progress.
We begin with incarceration in state or federal correctional facilities. Using data in Beck (2000), we compute that, in 1999, 2.5% of Black U.S. residents age 18 or older were incarcerated compared with 0.3% of Whites. The ratio between these shares is 8.84, far above the 1.0 ratio that would imply equality. By 2016, this ratio had fallen to 5.87 (Carson, 2016), suggesting some degree of convergence between imprisonment rates of Blacks and Whites across these 10 years. Assuming that this convergence continues linearly, we estimate that it will take 28 years for this ratio to converge to 1.0 (i.e., 17 × (5.87 − 1.0)/(8.84 − 5.87)). For Hispanics, 1.1% were imprisoned in 1999, which is 3.88 times the White imprisonment rate in that year. This ratio fell, modestly, to 3.13 by 2016 and we estimate it will take 48 years to fully converge, assuming continuation of this trend.
The next four outcomes in Table 5 show disparities in labor force participation rates and employment rates among the noninstitutionalized civilian population (e.g., omitting those incarcerated and in the armed forces). We find Black males’ labor force participation and employment rates were 91% and 86% of those for White males, respectively. These rates are converging ever so slightly in the third decimal places and imply convergence in 431 and 606 years, respectively. Hispanic males have higher rates of labor force participation and employment than White males in 2016. Finally, Black, Hispanic, and White females have roughly comparable employment rates in 2016.
The lack of progress in the Black–White gap in household income mirrors the lack of progress in the Black–White gap in employment among men; Black households’ median income was 63% of the median income for White households in 1996 and 64% in 2016. At this rate of progress, it will take 1,110 years until there is Black–White parity in median income. Hispanics gained relative to Whites such that the Hispanic–White gap in income is projected to be closed in 46 years. Poverty disparities have narrowed faster. Blacks were 2.5 times more likely to be poor than Whites in 1996, and this ratio improved to 2.0 by 2016, implying 37 more years to convergence. Similarly, the Hispanic–White gap in poverty improved from 2.6 to 1.8, suggesting 18 years to convergence.
Yet, there was a dramatic widening in Black–White wealth inequality from 1994 to 2013, which was likely caused by strong declines in home equity wealth for Blacks during the Great Recession (Shapiro et al., 2013). Pfeffer et al. (2013) conclude that “the Great Recession altered the distribution of wealth through 2011” (p. 99) such that “. . . whites and Asians were much less likely to have lost significant wealth than African Americans, Hispanics, Native Americans and others: 30 percent less likely to have lost any wealth, 37.5 percent less likely to have fallen into debt, and 74 percent less likely to have lost at least $250,000” (p. 111).
These changes in racial and ethnic economic inequality are likely to affect test score gaps. The next set of results in Table 5 show gaps in fourth and eighth grade math and reading exams from the National Assessment of Educational Progress and Kindergarten readiness, as reported in Reardon and Portilla (2016). These results show consistent patterns. Black–White and Hispanic–White test score gaps are narrowing slowly, with convergence predicted in 39 to 85 years for each outcome with one exception (Black–White gaps in eighth grade reading are on pace to converge in 1,147 years). However, in contrast, we find that Black–Asian and Hispanic–Asian gaps are widening during the periods in which data are available.
Putting these results together, we find that Black and Hispanic youth are projected to converge with their White peers, but only very slowly and in most cases in around 50 years. There is little evidence that Black and Hispanic youth will catch-up to their Asian American peers given continuation of current trends.
Moreover, this is just a partial list of the conditions that likely lead to disparities in college enrollment. A more complete list would include discrimination (Quillian et al., 2017) and segregation (Lichter et al., 2015), and their resulting disparities in neighborhood (Hall et al., 2015), environmental (Jones et al., 2014), and educational (Reardon & Owens, 2014) quality. Chetty and Hendren (2018) show that “the neighborhoods in which children grow up shape their earnings, college attendance rates, and fertility and marriage patterns” (p. 1107).
These results present some important lessons for public administrators and policymakers. First, for university administrators the results shown here should challenge assertions commonly made about improvements in “diversity.” Such administrators should be aware that gains made in URM groups’ share of enrollees are likely due to demographic change rather than successful interventions. What these university administrators have attempted to date has been insufficient to ameliorate the extent of underrepresentation that has in fact widened over the past decades. Their practices, particularly in regard to admissions and to a lesser extent regarding targeted recruitment and financial aid, are often hidden from public view and thus difficult to systematically study. University administrators should be willing to subject their practices to rigorous evaluations, perhaps involving randomized designs, to evaluate which of their practices have the most efficacy. Furthermore, such administrators should be challenged to do more and do better. They should be challenged with a goal of truly reflecting the racial and ethnic composition of their state’s high school graduates. Long (2007) notes that Universities are organizations that have an institutional interest in maintaining a sufficient share of minority students on their campuses in order to gain the positive academic and social benefits of a diverse student body. Universities also serve a public mission in overcoming the effects of past and contemporary discrimination and inequality by providing access to higher education and helping minority students graduate. (p. 318)
Yet, we should recognize that many of the antecedent conditions are outside of the control of university administrators. For state policymakers, these results show that university administrators cannot do this job alone. Although some progress has been made in narrowing economic and K–12 educational disparities, such disparities are still large and will take decades to improve. If we expect flagship public universities to reflect the racial and ethnic diversity of their states, then policymakers must work harder and better to alleviate these precollege disparities and thereby improve the college readiness of Black, Hispanic, and Native American students.
Public administrators need to maintain sustained attention to racial and ethnic inequality. They should be mindful of the policy research and interventions that show promise. For example, in the context of studying the Moving to Opportunity experiment, Chetty et al. (2016) find that “moving to a lower-poverty neighborhood significantly improves college attendance rates and earnings for children who were young (below age 13) when their families moved” (p. 855).
To help university administrators, public administrators and policymakers should particularly note the large racial gaps in kindergarten readiness and note that these gaps are maintained as students progress through the education system. Thus, without sustained, focused attention on mitigating gaps that emerge in the first years of life, we should expect persistent racial inequality in higher education. These gaps will not fix themselves without continued policy intervention and experimentation.
Footnotes
Declaration of Conflicting Interests
The author(s) declared no potential conflicts of interest with respect to the research, authorship, and/or publication of this article.
Funding
The author(s) disclosed receipt of the following financial support for the research, authorship, and/or publication of this article: Partial support for this research came from a Eunice Kennedy Shriver National Institute of Child Health and Human Development research infrastructure grant, P2C HD042828, to the Center for Studies in Demography & Ecology at the University of Washington.
