



Abstract
Promise programs are proliferating across the United States, with wide variation in their design. Using national data on 33 Promise programs affecting single, 2-year colleges, this study examines program effects on first-time, full-time college enrollments of students by race/ethnicity and gender classification. Results suggest Promise programs are associated with large percent increases in enrollments of Black and Hispanic students, especially students classified as females, at eligible colleges. Promise programs with merit requirements are associated with higher enrollment of White and Asian, Native Hawaiian, or Pacific Islander female students; those with income requirements are negatively associated with enrollment of most demographic groups. More generous Promise programs are associated with greater enrollment increases among demographic groups with historically higher levels of postsecondary attainment.
Keywords
Disparities in college access across demographic groups are persistent in the United States. For instance, in 2016, 57% of recent high school graduates who are Black enrolled in college, compared to 70% of White high school graduates (National Center for Education Statistics [NCES], 2017). The gap in college access and degree attainment contributes to widening socioeconomic inequality, particularly since there are substantial economic benefits associated with college attendance, even for those who do not complete a degree (Carnevale et al., 2012; Goldin & Katz, 2008; Toutkoushian et al., 2013).
Policy interventions to encourage college-going are numerous (Page & Scott-Clayton, 2016), and these initiatives may have differentiated effects across demographic groups (Carrell & Sacerdote, 2017; Chen, 2008; Herbaut & Geven, 2019). This study examines the heterogeneous effects on various demographic groups of one intervention aimed at increasing college access: Promise programs. Promise programs, also known as place-based aid programs, guarantee coverage of a substantial portion of college tuition and fees for students who live in a particular place (Miller-Adams, 2015). These programs have existed across the United States since at least the late 1990s but have garnered greater attention in recent years as they have been proposed by U.S. presidential candidates (Mangan, 2019; Mishory, 2018). An exact count of Promise programs is unknown, since these programs are diffusing rapidly and definitions of Promise programs vary, but one inventory documented at least 144 Promise programs as of mid-2019 (Miller-Adams et al., 2019). The proliferation of Promise programs across localities and states underscores the importance of understanding these initiatives and their differentiated effects across demographic groups.
This study extends the extant literature on Promise programs, which overwhelmingly consists of single-program evaluations (e.g., Carruthers & Fox, 2016; Nguyen, 2020; Page et al., 2019). Some of these single-case studies identify differences in program effects on enrollment across gender and racial/ethnic classifications (e.g., Bartik et al., 2017; Billings, 2018; Nguyen, 2020). We build on that research to examine 33 Promise programs across the United States that allow students to use their Promise award at a single 2-year college. By analyzing numerous programs simultaneously, this study is able to examine differential effects based on program-design features. Attention to program design is critical as Promise programs continue to diffuse, since these programs vary considerably in their architectures (Perna & Leigh, 2018), and questions about how to design them equitably abound (e.g., Jones & Berger, 2018).
Two-year colleges are of particular interest to addressing educational attainment gaps since they serve as the entry into college for large shares of low-income and racially minoritized students (NCES, 2017; Radwin et al., 2013). 1 As noted previously, students historically underrepresented in higher education disproportionately remain outside the higher education system. Community colleges could play a critical role in serving these students, especially since they are generally more affordable than 4-year institutions (College Board, 2018). Moreover, 2-year colleges enjoy bipartisan support (D. Gándara & Ness, 2019) and are viewed by the public more favorably than any other higher education sector (Fishman et al., 2018), which suggests they could see greater public investment in the coming years.
Focusing on 2-year college Promise programs, this study addresses the following questions: (a) How do enrollments of students by racial/ethnic and gender classification change at eligible 2-year colleges following the implementation of Promise programs? (b) How do these relationships differ according to Promise program design features? To address these questions, we employ difference-in-differences (DiD) and event-study analyses on an original national-level dataset of Promise programs that affect public, 2-year colleges merged with data from the Integrated Postsecondary Education Data Systems (IPEDS), the U.S. Census Bureau, the U.S. Bureau of Labor Statistics, and the U.S. Department of Commerce’s Bureau of Economic Analysis. We examine heterogeneity in average Promise program effects on enrollments at eligible colleges, while accounting for program design differences that might have differential effects on enrollments across demographic groups.
Findings indicate that Promise programs increase enrollments of Black and Hispanic students at 2-year colleges with Promise programs, with larger effects for female students. 2 Program-design features have varying effects on the enrollment of different student groups. Merit-based criteria (e.g., grade point average [GPA] minimum) are associated with higher enrollment of White and Asian, Native Hawaiian, or Pacific Islander female students, whereas income criteria are associated with lower enrollment across demographic groups, except Black male students, relative to programs without these criteria. Programs that cover full tuition are associated with greater enrollment increases among students classified as Asian, Native Hawaiian, or Pacific Islander. Finally, first-dollar programs, which award Promise aid irrespective of other aid received by students, yield greater enrollment increases among White students. Together, these results suggest racially minoritized students, especially females, are more likely to enroll in Promise-eligible colleges. However, more generous programs are more likely to increase enrollments of White and Asian, Native Hawaiian, or Pacific Islander students.
To our knowledge, this study is the first to examine heterogeneity in average effects of Promise programs on enrollments at eligible 2-year colleges. Attending to varying program effects on different populations is critical since these programs have potential to reduce, but also expand, inequality in educational access (Jones & Berger, 2018). Moreover, this study sheds light on enrollment changes within colleges following Promise implementation, and could inform capacity building in response to Promise program adoption.
Promise Programs
We define Promise programs broadly as those that award financial aid to students based on their geographic location (e.g., where they live or attend school; Miller-Adams, 2015). However, these programs differ extensively in their designs (Perna & Leigh, 2018). In this section, we briefly describe ways in which Promise programs vary, with a focus on the program-design elements we examine in this study. We limit this discussion to sub-state (local) programs, which are the focus of this study.
Promise programs differ primarily in their participating postsecondary institutions, aid-eligibility criteria, and aid-disbursement guidelines (Perna & Leigh, 2018). First, Promise programs generally specify particular institutions or institutional types where the aid can be used. The broadest programs allow students to use aid at any institution in the country, sometimes requiring that the institution is accredited (over half of all Promise programs; Perna & Leigh, 2018). Other programs are more restrictive, limiting aid use to in-state institutions (2-year or 4-year), to public institutions, or to certain institution types/sectors (e.g., 2-year). The most restrictive programs designate specific institutions where Promise aid can be used. According to Perna and Leigh’s (2018) inventory, 56% of non-state-sponsored Promise programs restrict use to 2-year institutions. Our analysis focuses on these 2-year college Promise programs.
A second major dimension along which Promise programs vary is program eligibility criteria. While some programs are generally available to all students attending school or residing in a particular place, others have targeted eligibility criteria. The most common eligibility criteria are financial (e.g., student must be eligible for Pell Grants) or merit-based (e.g., student must maintain a minimum high school GPA; Perna & Leigh, n.d.).
Third, Promise programs differ in the method used to disburse financial aid. Some programs are last-dollar, meaning they require students to exhaust all other state and federal financial aid before receiving Promise funds, in contrast to first-dollar programs, which do not have this requirement. One benefit for policymakers of designing a last-dollar program is that a smaller amount of funding is needed to sustain the program (Pingel et al., 2016). Critics of last-dollar programs, however, argue these programs are regressive because they distribute little aid to lower-income students, for whom tuition and fees are largely covered by Pell Grants and, if available, state grant aid (e.g., Jones & Berger, 2018). Funding for last-dollar Promise programs tends to flow to middle-income and higher-income students (Poutre & Voight, 2018a, 2018b).
In our models, we consider two of these design features—aid eligibility and aid disbursement—to understand whether they have differential effects on enrollments of student groups at Promise-eligible institutions. The third feature we examine is whether a program covers the full amount of tuition for 2 years, 60 credits, or the equivalent of an associate degree, since some programs are less generous and cover only 1 year of tuition or award a specific financial amount (e.g., only $1,000). 3 Fourth, we consider whether programs offer other supports, such as advising or mentoring opportunities in addition to the financial award (Miller-Adams, 2015; Perna & Leigh, n.d., 2018).
Literature Review
Research on Promise programs is nascent, but rigorous research in recent years illuminates the expected impact of these programs on college enrollments. Extant research on Promise programs shows these programs increase college enrollment among eligible students, particularly at the institutions where students can use their Promise aid (Bartik et al., 2017; Billings, 2018; Carruthers & Fox, 2016; Li & Gándara, 2020; Nguyen, 2020; Page et al., 2019). This research also detects shifts from non-eligible institutions to Promise-eligible institutions, further supporting our expectation that enrollments will increase substantially at Promise-eligible colleges. For instance, Carruthers and Fox (2016) found that Knox Achieves, the precursor to the statewide Tennessee Promise, increased enrollments at community colleges but also decreased enrollments at 4-year colleges, where students could not use their Promise funds.
Another study on a Promise program similar to those included in our study is a mixed-methods analysis of an unnamed Promise program in the Pacific Northwest associated with a single community college (Pluhta & Penny, 2013). That program did not impose any need- or merit-based eligibility criteria. It only guaranteed coverage of students’ tuition and fees for 1 year. The descriptive analysis revealed that in the 3 years before the implementation of the Promise program, only 20 students at the eligible high school enrolled in college; after the Promise program, that number had risen to 51 students (Pluhta & Penny, 2013). While not causal, these findings shed additional light on the large percent increases in enrollment associated with a free community college program.
Finally, in the study most similar to our own, Nguyen (2020) examined the effects of the Tennessee Promise, a statewide free community college program with a last-dollar design. Similar to our study, the author examined changes in enrollment at the institutional level, rather than examining program effects on students’ individual choices. In that study, Nguyen (2020) conservatively estimated a 40% increase in enrollments at eligible community colleges, as well as modest substitution away from 4-year universities in the state. Moreover, the author found large increases for Black and Hispanic students.
Turning to differences based on program design features, previous studies suggest first-dollar programs (e.g., Kalamazoo Promise) may have greater effects on student enrollment in college than last-dollar programs (e.g., Knox Achieves, Pittsburgh Promise, and Oregon Promise). In particular, the Kalamazoo Promise led to an estimated 11 percentage-point increase in college-going rates (Billings, 2018), compared to roughly 5 percentage-point increases from Knox Achieves, the Pittsburgh Promise, and the Oregon Promise (Carruthers & Fox, 2016; Gurantz, 2019; Page et al., 2019). Although, as mentioned previously, Nguyen (2020) found large enrollment effects of the Tennessee Promise, a last-dollar program, at eligible institutions.
Notwithstanding evidence from Tennessee, one interpretation of this evidence is that the size of the financial benefit may correlate positively with enrollment effects, since first-dollar programs tend to disburse more aid. Alternatively, it is possible that the process of accessing first-dollar aid is less burdensome than accessing last-dollar aid; for the latter, students always have to fill out the Free Application for Federal Student Aid (FAFSA), a barrier to enrollment for many students (Dynarski & Wiederspan, 2012). A recent review of college-access and financial-aid programs confirms the effectiveness of reducing administrative burdens for improving college access for disadvantaged students (Herbaut & Geven, 2019). Together, this literature suggests Promise programs will yield positive effects on enrollments. Effects may be greater for programs that are first dollar, either because they are more generous or because they have lower “hassle costs” (Anderson & Goldrick-Rab, 2018, p. 155; Herd & Moynihan, 2019).
We also expect differences across demographic groups. Specifically, we anticipate that Promise programs will have greater effects on the enrollment of students who are classified as female and racially minoritized for a number of reasons. First, a recent study examining the mechanisms by which college-access programs work revealed that effects were greater for females, partly since they estimated more meager labor-market opportunities without attending college than males did (Carrell & Sacerdote, 2017). Separately, two studies found that the Kalamazoo Promise had stronger effects on the enrollment of females than males (Bartik et al., 2017; Billings, 2018).
Similar to findings on the Kalamazoo Promise, an early study of the Pittsburgh Promise showed effects on college enrollments were smaller for students who identify as male (Bozick et al., 2015). This finding may be attributed to the fact that males eligible for the Pittsburgh Promise were more likely to delay college enrollment than females (Iriti et al., 2012). One major distinction between the Pittsburgh Promise and Kalamazoo’s program is that all students in the Kalamazoo Promise catchment zone were eligible for the scholarship (Billings, 2018). In contrast, to be eligible for the Pittsburgh Promise, students had to meet certain GPA and attendance criteria (Page et al., 2019).
We also garner insights from statewide merit-aid programs. Statewide merit programs are distinct from programs we examine in this study primarily in that they have stricter merit eligibility criteria and are not limited to 2-year colleges. However, these programs are instructive for our analysis because, similar to the programs in our study, their eligibility is based on place, and they generally promote a “free college” message. Research on statewide merit-aid programs suggests these programs may have stronger effects on females than males. For instance, one study of two statewide merit-aid programs, one in Georgia and one in Arkansas, found stronger, positive effects of these programs on females’ college degree attainment than males’ (Dynarski, 2008). Differences across race/ethnicity were also detected; in particular, positive effects were more pronounced among Hispanic, non-White women. Differences in high school performance explained some of this difference between males and females, since the scholarships were merit based (Dynarski, 2008). Similarly, a study of Florida’s Bright Futures Program, also a statewide merit-aid program, found that the program was associated with slightly larger enrollment increases for females, although the difference was not statistically significant (Zhang et al., 2013).
Turning to differences across racial/ethnic groups, we expect Promise programs to have greater effects on the enrollment of racially minoritized students at eligible community colleges for various reasons. First, these students’ college aspirations and pursuits are often suppressed by systemic barriers, including lower educational expectations for racially minoritized students among school faculty and staff members (Diamond et al., 2004; Ferguson, 2003; P. C. Gándara & Contreras, 2009; Howard, 2019; Stanton-Salazar, 1997), disproportionality in school discipline that negatively affects racially minoritized students (Noguera, 2009; Skiba et al., 2011), and segregation within schools (Noguera, 2008; Oakes, 2005). Promise programs can convey the message that “college is for all,” potentially challenging the systemic barriers that suppress college aspirations and enrollment for racially minoritized students. In addition, we expect the “free college” message to be especially impactful for racially minoritized students since these students tend to have lower levels of income and wealth (Dettling et al., 2017; U.S. Census Bureau, 2018) and may be more likely to overestimate the price of college (Grodsky & Jones, 2004; Tierney & Venegas, 2006).
Previous research on the differentiated effects of financial aid and college-access programs across racial/ethnic groups is mixed (Goldrick-Rab et al., 2009). Some studies have found that Black, Hispanic, and Native American students are more responsive to financial aid than White students (Linsenmeier et al., 2006). In contrast, Kane (1994) did not find conclusive evidence of differences between Black and White students in responses to financial aid. However, that study showed that Black students are more responsive to sticker (published) price changes than White students, a finding that is consistent with Heller’s (1997) literature review and Denning’s (2017) more recent study on student price sensitivity to community-college tuition changes. In some ways, Promise programs resemble sticker price changes since they can change students’ perceptions of college affordability. For these reasons, we expect Promise programs to be associated greater enrollment increases for racially minoritized students.
Billings (2018) found modest, positive effects of the Kalamazoo Promise on Black and Hispanic students; however, these effects were smaller than those for White and Asian students. Bartik and colleagues (2017) found similar enrollment effects for White and non-White students. In contrast to this evidence from the Kalamazoo Promise program, research suggests statewide merit-aid programs have a greater positive effect on the college enrollment of non-White students than that of their White counterparts (Dynarski, 2004). Cornwell and colleagues (2006) found similar results in Georgia, but Dynarski (2000) concluded that the Georgia HOPE, a statewide merit aid program, widened the Black–White gap in college attendance. Studies of merit-aid programs in Massachusetts (Heller, 2006) and Florida (Zhang et al., 2013) did not detect a greater benefit for non-White students. In the study most similar to ours, Nguyen found that the Tennessee Promise had a significant positive effect on the enrollment of Black and Hispanic students at eligible community colleges, with greater effects on Black student enrollment.
Our study examines how a certain type of Promise program—that which is tied to a single, 2-year college—affects enrollment at eligible institutions. By examining multiple programs simultaneously, we explore how different design characteristics relate to effects across various demographic groups. Our study also differs from others on Promise programs in that we use institution-level, rather than student-level, data (see Nguyen, 2020 for an exception). By focusing on institutions, this study illuminates how enrollments change at eligible colleges and has implications for capacity building in response to Promise program adoption.
Data and Sample
Promise Programs
To create our national sample of Promise programs, we used data from the W. E. Upjohn inventory of Promise programs (Miller-Adams et al., 2019), as well as the Penn AHEAD inventory (Perna & Leigh, n.d.) and Billings’s (2018) dissertation. We also gathered data from each program’s website, including which college was eligible to receive Promise funds, the establishment year of the program, the active year (i.e., the first year scholarship funds were awarded to students), and details on the design characteristics of the program, as described previously. Table 1 lists the programs in our study and their key features.
Promise Programs, States, Participating Institutions, Active Years, and Program Characteristics
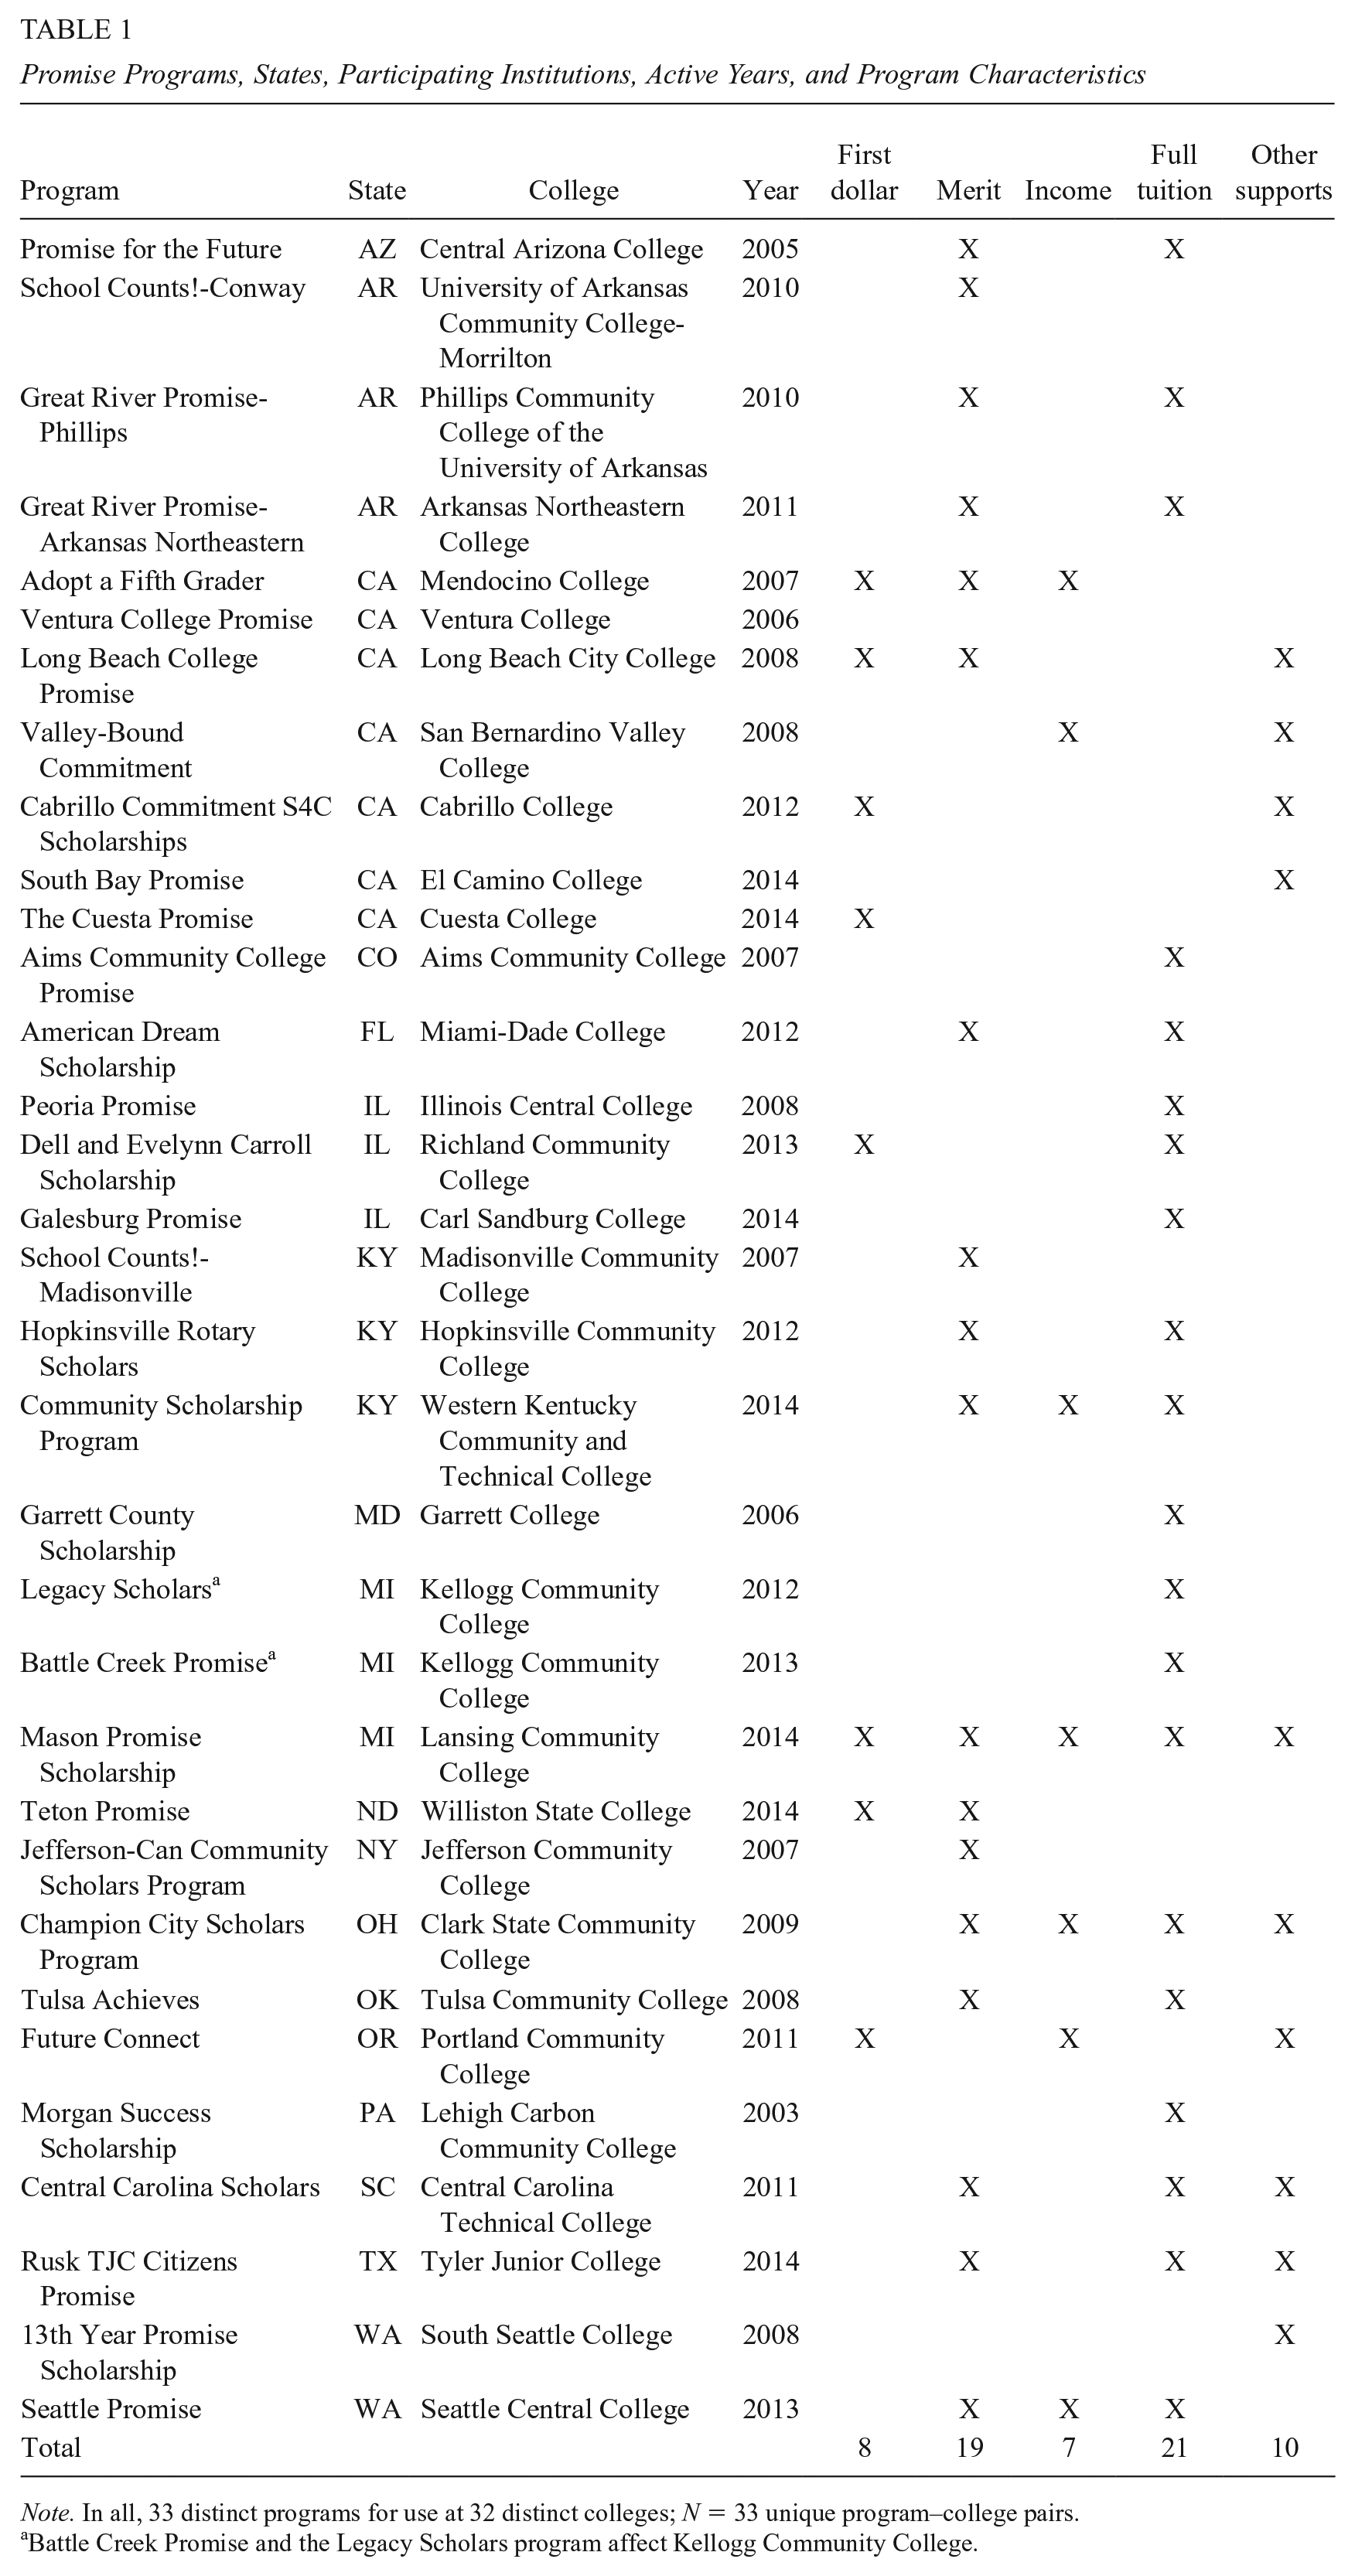
Note. In all, 33 distinct programs for use at 32 distinct colleges; N = 33 unique program–college pairs.
Battle Creek Promise and the Legacy Scholars program affect Kellogg Community College.
We used several criteria to define the sample of Promise programs in our dataset. First, the Promise program had to specify a single, public, 2-year college at which funds could be used. If we included programs that were eligible for use at multiple colleges, it would be challenging to decipher how the program affected enrollment at each eligible college. For instance, we excluded the Rockford Promise in Illinois, which students can use at either a 2-year college (Rock Valley College) or a 4-year university (Rockford University). Similarly, we excluded the well-known Kalamazoo Promise because it was tied to every public and private 2- or 4-year college in Michigan. Colleges affected by Promise programs that were not in our treatment group (i.e., because the program was tied to more than one college) were also excluded from our comparison groups. According to the W. E. Upjohn Institute’s database, the eligible population for the programs in our sample is considerably smaller (77,138) than the eligible population for all Promise programs that are associated with community colleges (157,376; Miller-Adams et al., 2019).
Second, we restricted our sample to programs that began allocating funds for students in 2014 or earlier, since 2015 is the last year for which we have data on key variables. The third criterion for sample inclusion required the program to offer a financial award, thus excluding programs offering only mentorship or other supports. Our final sample consists of 33 Promise programs, which are tied to 32 distinct colleges (Kellogg Community College was eligible for two Promise programs). The first program in our sample (Morgan Success Scholarship) became active in 2003. Our dataset covers Academic Years 2000–2001 to 2014–2015.
Institutional Data and Sample
We collected data on the 32 Promise-eligible colleges, which we define as our treatment group, from IPEDS. 4 To address our research question of how the enrollment of first-year students of different racial/ethnic and gender groups changed at a college following the initiation of a Promise program, compared to a college that did not have a program, it was crucial to construct an adequate comparison group. Essentially, we were interested in the causal effect of a Promise program, calculated as the difference between enrollments at a college if it randomly received the Promise program treatment, and the counterfactual, or enrollments at the same college if it were randomly excluded from Promise program eligibility (Rubin, 1974). Since it is impossible to observe the counterfactual, we sought to create a group of colleges that are similar to the treated colleges, yet not subject to a Promise program, to allow for causal inference (Morgan & Winship, 2007).
Comparison Groups
We first constructed comparison groups that included colleges in close geographic proximity to the 32 treated colleges. These colleges are more likely to be similar to treated colleges on variables related to enrollment (e.g., unobservable economic conditions). Generally, geographically proximal comparison groups have the advantage of better approximating experimental estimates (Cook et al., 2008). We used the latitude and longitude coordinates of treated colleges in IPEDS and calculated the geodesic distance in miles—that is, the shortest distance between two coordinate sets—to the 10 nearest colleges. Distance was measured using the Vincenty inverse formula for ellipsoids, an iterative method to calculate the ellipsoidal distance between two points on the surface of a spheroid (Thomas & Featherstone, 2005).
Comparison colleges also had to meet specific criteria to best match the characteristics of the treated colleges. For inclusion in our comparison group, colleges were required in all years to have a “public” control designation in IPEDS (excluding private and for-profit colleges) and award at least an “associate degree” as the highest degree (excluding colleges that award certificates only but including technical colleges that award associate’s degrees). We excluded colleges holding a “special focus” Carnegie classification (e.g., health colleges, art and design schools, tribal colleges). To keep our comparison group constant across time, we restricted our sample to those colleges that were active during all years of observation, excluding colleges that merged, opened, or closed during the period.
We additionally excluded from our comparison group all colleges that were treated but were also geographically close to another treated college. In other words, a treated college could not serve as a comparison college for a nearby treated college. We did allow individual colleges to operate as a comparison for more than one Promise program. For instance, Edmonds Community College met our criteria and served as a comparison college for both Seattle Central and South Seattle.
We then matched each treated college up to the seventh nearest comparison college; the inclusion of colleges located at a greater distance resulted in the loss of sample size and an unstable comparison group. The median distance between each treated college and its nearest 7 colleges is 46 miles. Thus, for our first series of models, our comparison group consists of the nearest one to seven colleges to each treated college (Comparison Group 1).
One potential limitation of using a comparison group that includes the nearest colleges to each treated college is that these nearby colleges could experience enrollment losses as a result of Promise program implementation in the treated college (e.g., Nguyen, 2020). As a result, our estimates of Promise program effects on enrollments could be biased upward, since we would be comparing enrollments at treated colleges to enrollments at colleges whose enrollments are declining in response to a Promise program at a nearby (treated) college.
To address the concern that we might be overestimating the effects of Promise programs on enrollment, we ran a separate series of models excluding from the comparison group the four colleges closest to the treated colleges. In other words, in this series of models, only the nearest five to seven colleges were included in the comparison group (Comparison Group 2). In the Appendix (A1), available in the online version of the journal, we also report results using the nearest one to four colleges as the comparison group and present them alongside estimates for the models using the nearest five to seven colleges. This comparison suggests that Promise programs associated with a single public, 2-year college might divert White and Hispanic students away from the nearest community colleges. For students in these racial/ethnic groups, the estimated effects of a Promise program are slightly larger for the nearest four colleges than for those that are farther away (nearest 5–7 colleges). These findings suggest Promise programs could depress enrollment of White and Hispanic students at nearby (non-eligible) colleges, inflating the size of the estimated effect of Promise programs on treated colleges. We did not find a similar potential spillover effect for any other demographic group.
Last, we conducted a third series of analyses with a comparison group constructed using coarsened-exact matching (CEM; Comparison Group 3). CEM is a data pre-processing technique used to improve balance between treated and comparison groups (Iacus et al., 2012). We employed this matching technique both to improve pre-treatment covariate balance across the treated and untreated groups and to circumvent potential bias from spillover effects of Promise programs on geographically nearby colleges. This method pruned the data by matching treated colleges to untreated colleges that are most similar on pre-treatment characteristics that could affect our enrollment outcomes of interest (Blackwell et al., 2010).
Specifically, we first identified the independent variables that had statistically significantly different values (p < .05) across the treated and comparison groups before treatment: tuition and fees (logged, in 2015 dollars), urbanicity (i.e., rural, urban, or city), county population (logged), and county income per capita (logged, in 2015 dollars). We then matched treated and untreated units on various combinations of these variables using the automated-computation CEM feature (Blackwell et al., 2010). Our preferred model is the one that optimized sample size along with reduction in the multivariate distance between treated and untreated groups, which is measured using the L1 statistic (Iacus et al., 2008). This model matches treated and untreated colleges on the following variables: rural, city, and county income per capita. In our main results, we present findings from all three comparison groups (i.e., nearest 7 colleges, nearest 5–7 colleges, and CEM).
Outcome Variables
For each college and year, we collected data from the IPEDS Fall Enrollment survey on the total fall enrollment of first-time, full-time degree- or certificate-seeking undergraduates for each demographic group. This outcome captures initial enrollment in postsecondary education in the fall following high-school graduation and represents the population of students targeted by Promise programs, since the majority of these programs require full-time college enrollment in a credential-granting program immediately following high school.
We collected separate enrollment numbers for students classified as female and male in each of the following racial/ethnic groups using IPEDS categories: Asian, Native Hawaiian, or other Pacific Islander; Black or African American; Hispanic or Latinx; and White. It is important to acknowledge the severe limitations inherent in IPEDS data. First, this dataset, as most large-scale quantitative datasets, assume gender is binary (female/male). IPEDS data are collected from higher education institutions, which collect students’ “gender” identities by offering only two choices: “male” and “female.” We acknowledge that the conclusions we draw related to gender are limited and problematic, and this dichotomous categorization of gender serves to further marginalize and erase people who identify differently. Likewise, the categories of race and ethnicity in IPEDS are limited, especially by constraining the options for racial/ethnic identity and by not disaggregating categories further. This aggregation hamstrings our ability to examine heterogeneity within racial categories, even though previous research reveals the meaningful variability within racial/ethnic categories in education (e.g., Nguyen et al., 2019; Teranishi & Nguyen, 2012). Last, these data do not allow us to examine the group of American Indian or Alaska Native students since the sample was too small to obtain meaningful estimates (i.e., the mean for each group in the treated and comparison groups ranged from three to five students).
Control Variables
Institutional Controls
To identify the effect of Promise programs on enrollments at eligible colleges, we included in our models a series of institution-level covariates from IPEDS that affect full-time, first-time enrollment numbers. First, we included the college’s in-state tuition and fees prices for full-time undergraduates (logged and Consumer Price Index [CPI]-adjusted to 2015 dollars), since prior research shows prices at community colleges affect enrollment (Denning, 2017). Second, we included indicator variables for the college’s degree of urbanization, categorized as rural, suburban, or city, since urbanization is related to college choice (Roderick et al., 2011).
County Controls
Since local economic and social conditions are associated with students’ decisions to enroll in college (Kim & Nuñez, 2013), particularly at community colleges, we incorporated county-level controls. Specifically, we included each county’s personal income per capita, logged and in 2015 dollars (Bureau of Economic Analysis); population size, logged (U.S. Census Bureau, 2018); and annual average unemployment rate of the total civilian, non-institutional population (Bureau of Labor Statistics). Income-per-capita captures the economic health of individuals in the county where each college is located, which may affect the relative appeal of attending Promise-eligible colleges. Unemployment rate and population size represent conditions that may reflect overall demand for higher education (Hillman & Orians, 2013). Summary statistics for the treated colleges and the three comparison groups appear in Table 2. Variables that were logged for the analysis are displayed in their untransformed units.
Summary Statistics for Treated Group and 3 Comparison Groups
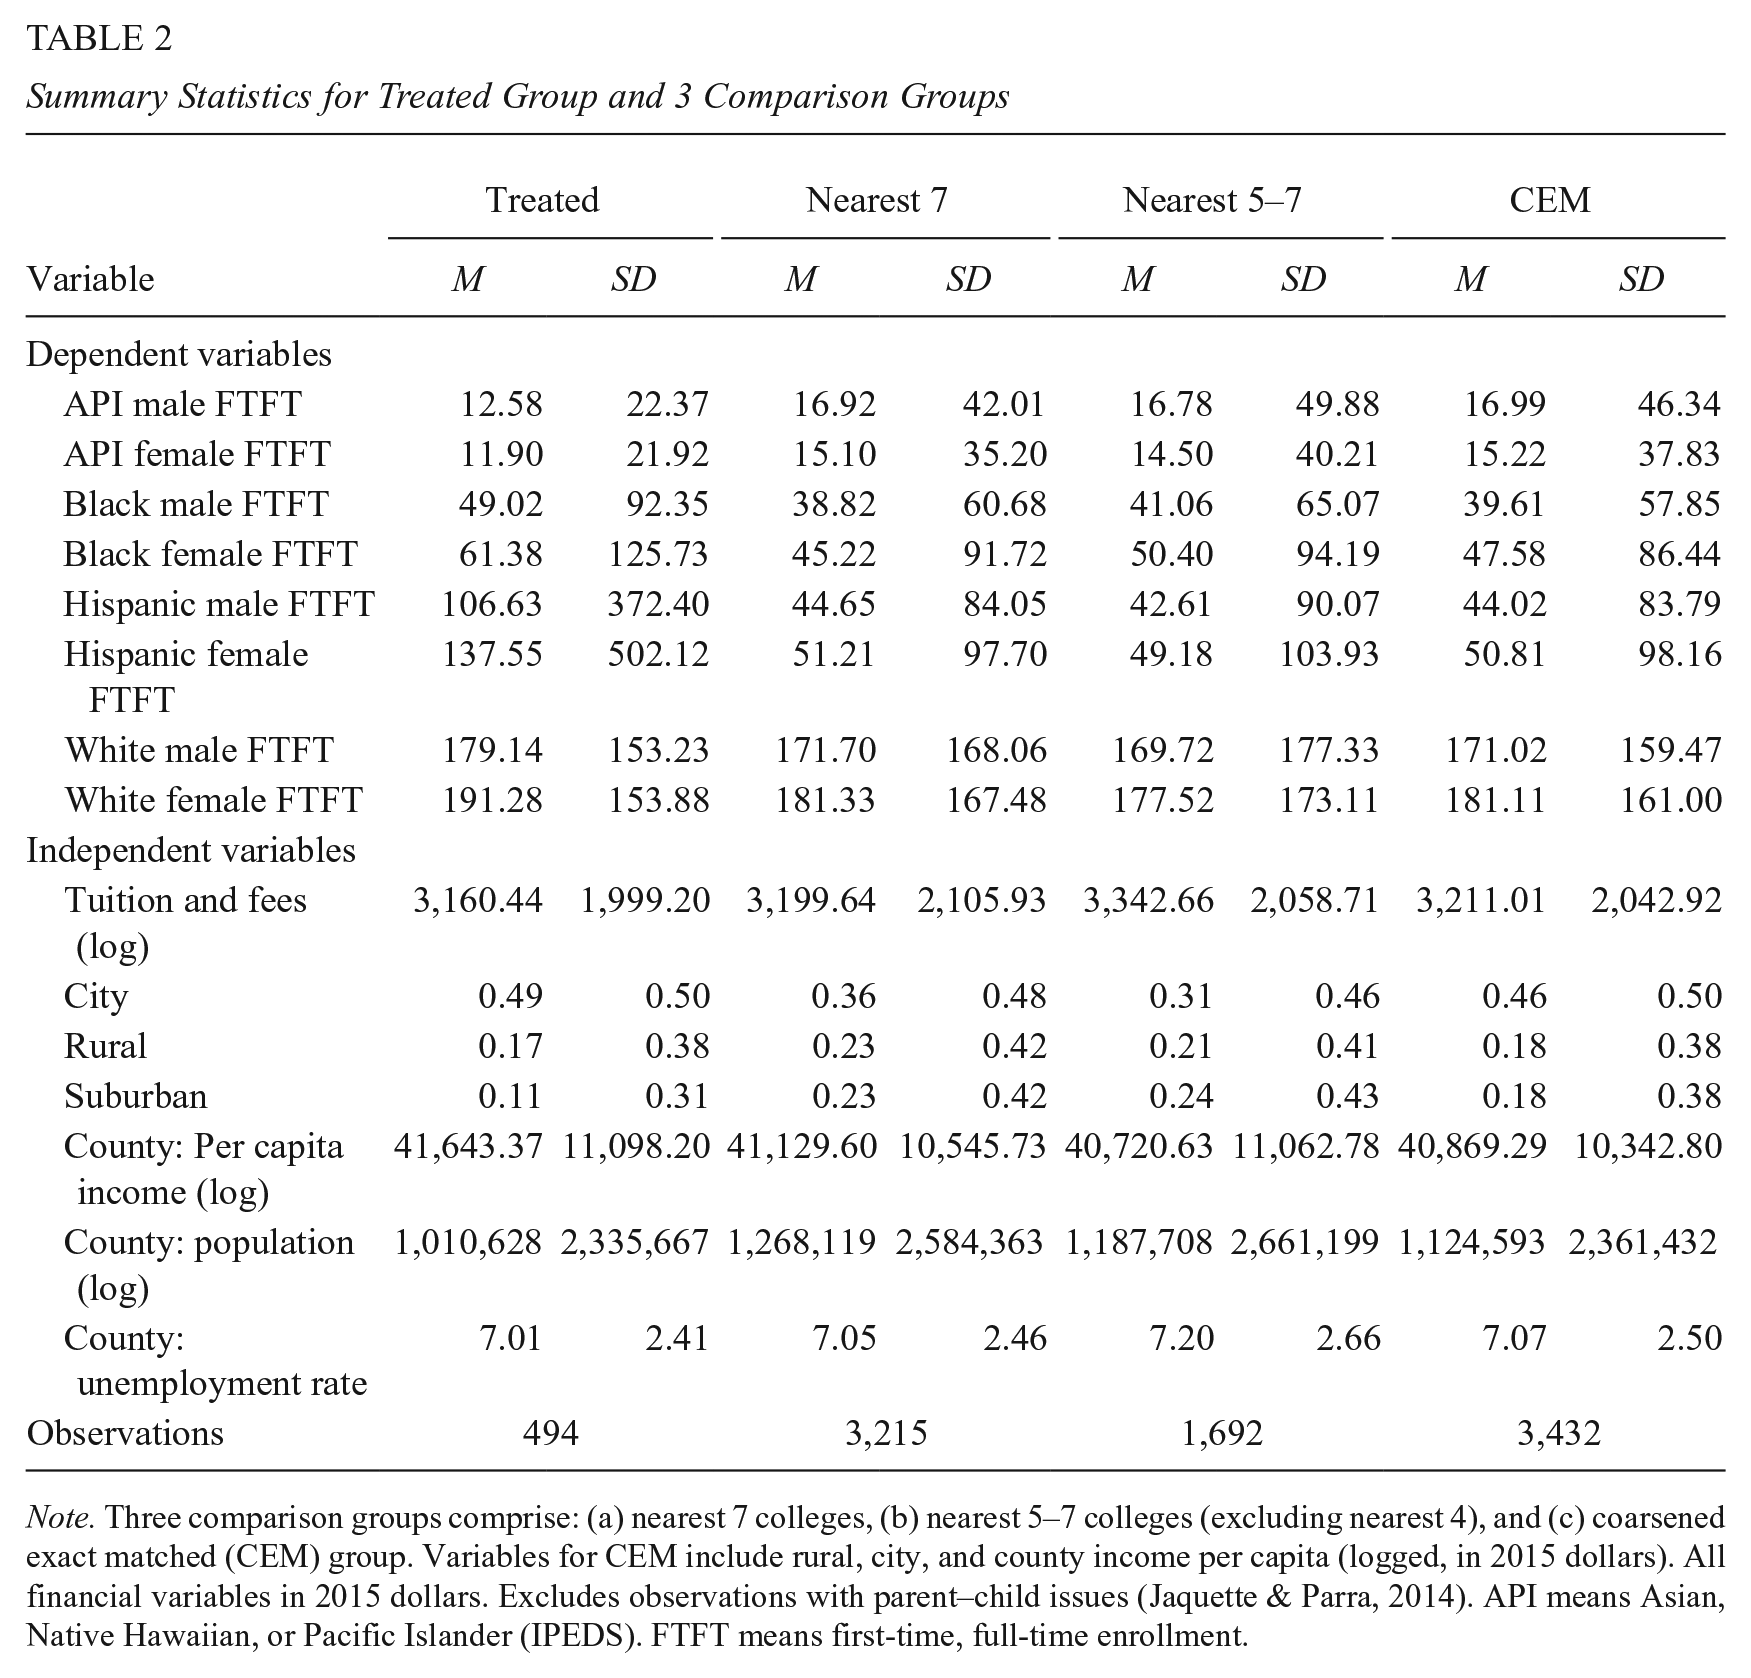
Note. Three comparison groups comprise: (a) nearest 7 colleges, (b) nearest 5–7 colleges (excluding nearest 4), and (c) coarsened exact matched (CEM) group. Variables for CEM include rural, city, and county income per capita (logged, in 2015 dollars). All financial variables in 2015 dollars. Excludes observations with parent–child issues (Jaquette & Parra, 2014). API means Asian, Native Hawaiian, or Pacific Islander (IPEDS). FTFT means first-time, full-time enrollment.
Analytic Technique
Our panel dataset encompassed years before and after Promise programs were adopted, providing a data structure to employ difference-in-differences (DiD) modeling to answer both research questions. Our primary DiD approach relies on fixed-effects estimation in ordinary least squares to isolate aggregate-level changes due to program implementation. This technique takes advantage of time-induced variation to control for potential observable and unobservable differences between treated and comparison groups that can mask intervention effects (Angrist & Pischke, 2009; Bertrand et al., 2004).
To address the first research question regarding the relationship between Promise programs and student enrollments by race/ethnicity and gender classification, we estimated the following model:

where
Under certain DiD assumptions, the program effect
Specifically, the event-study model differs from the DiD model (Equation 1) in that the single treatip term is replaced by a set of indicator variables indicating leads (years before treatment implementation) and lags (years after treatment implementation) (see Furquim et al., 2019). Treatment time (the year when a program was implemented) can vary across units, and is indicated by k in Equation 2:

In this model, we have a different coefficient for each jth lead or lag, ranging from –m to q, where m is the number of leads and q indicates the number of lags (Furquim et al., 2019).
To address our second research question on whether variations in the design features of Promise programs generate differences in enrollment outcomes, we modified Equation 2 by adding new variables to represent design characteristics: (a) first-dollar (versus last-dollar), (b) merit-eligibility criteria (versus no merit criteria), (c) income-eligibility criteria (versus no income criteria), (d) covers the full cost of tuition for 2 years, or the equivalent credit hours needed to earn an associate degree, and (e) offers additional supports (e.g., mentoring, advising).
We conducted multivariate regression analyses separately using the three comparison groups described previously. Formally, we estimated the following model:

where
Threats to Validity
When employing DiD designs for causal inference, there is one major threat to internal validity: non-parallel trends between the treated and comparison groups (Cunningham, 2018). The parallel trends assumption states that treated and comparison groups would have exhibited similar trends in the outcome absent program intervention (Angrist & Pischke, 2009; Cunningham, 2018). Of course, it is not possible to know what trends in enrollment would have been like without Promise programs. In the absence of a direct test of parallel trends, we deduce that if trends were similar before treatment, we might reasonably expect them to have been the same after treatment (Cunningham, 2018).
As noted earlier, the construction of a comparison group is vital to estimating aggregate program impacts in a DiD framework (St. Clair & Cook, 2015). To infer causality and yield unbiased estimates, the counterfactual scenario requires an approximation of the outcomes of the treated colleges under control conditions (i.e., if treated colleges had not become eligible to receive Promise program funds). If treated and comparison colleges differ in unobservable ways that produce different outcomes, irrespective of the treatment, we cannot be certain of the degree to which changes in enrollment can be attributed to the Promise program intervention or to other differences, policy changes, or external events unaccounted for in our model. We sought to craft a compelling counterfactual scenario by constructing three different comparison groups (described previously), all of which yield qualitatively similar estimates.
Beyond employing multiple comparison groups, we explored whether our data met the parallel trends assumption using three methods. First, we visually inspected our data by plotting the outcome development over time for treated and comparison colleges (Figure 1). These plots show greater volatility in Black male and female enrollments among treated colleges than comparison colleges in the years preceding a Promise programs. However, more formal tests of pre-treatment trends show less cause for concern.
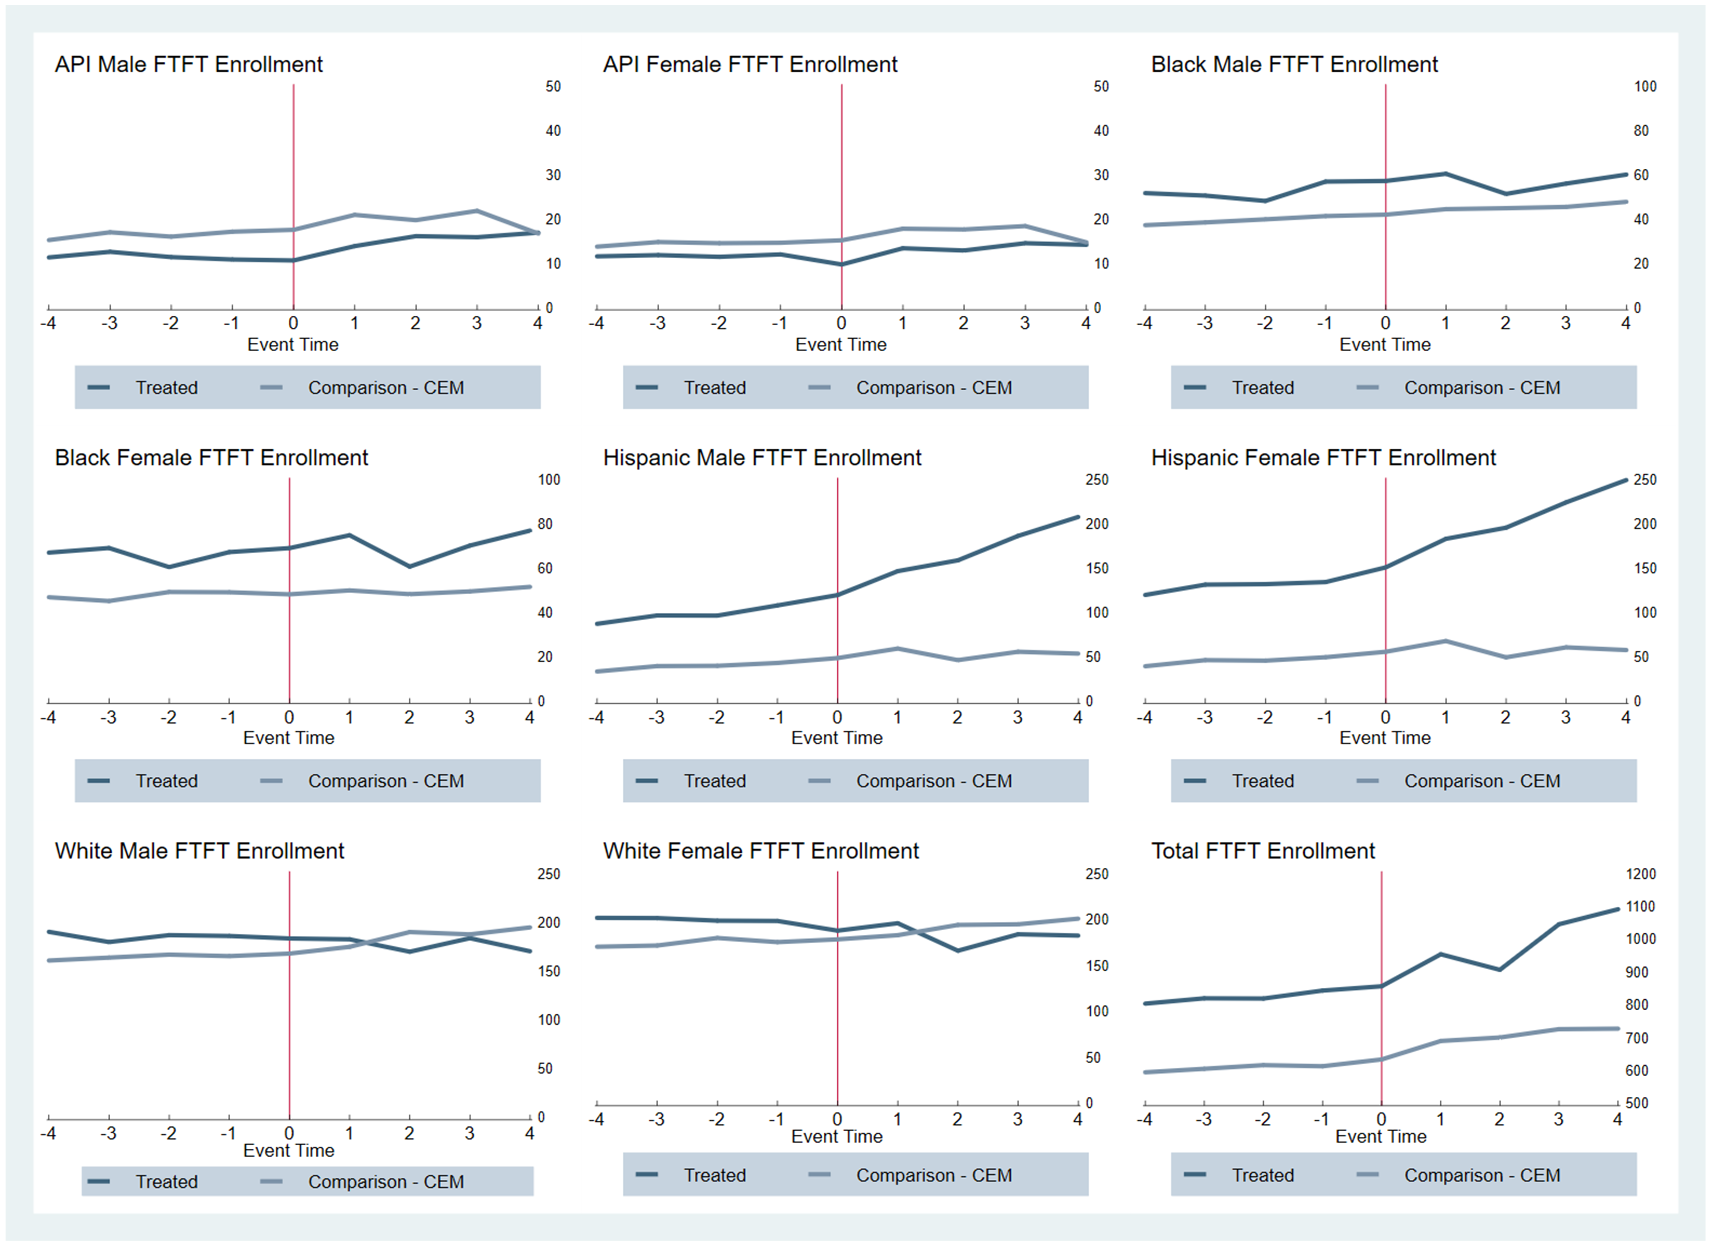
Trends in first-time, full-time enrollment relative to program implementation (CEM comparison).
In particular, to complement the visual inspection of pre-treatment trends, we conducted time-based placebo tests. We coded colleges with Promise programs as “treated” 3 years before they became active and modeled the DiD as in our main analyses (Equation 1). If the interaction between the indicator capturing the 3 years before treatment and the indicator capturing membership in the treatment group were positive, we would have evidence of significant differential pre-treatment trends. The placebo interaction was not significant across any of our models (online Appendix A2).
Third, we employed event-study analyses, which provide an additional test of whether our models detect “effects” of Promise programs before treatment, but also yield insight on how the outcome (in our case, fall enrollment) develops over time (Goodman-Bacon, 2018). Identifying significant treatment “effects” of leads in the event-study model (Equation 2) would cast doubt on the validity of our findings, since this would indicate significant differences in trends between our treatment and comparison groups in the years preceding Promise programs (Angrist & Pischke, 2009). For the event studies, we used the CEM comparison group, which is agnostic to geography and circumvents the concern with externalities on geographically proximal colleges. The event studies did not detect pre-treatment trends. We discuss the results from the event studies, which complement our main findings, in the Results section.
As a final robustness check, we estimated the average treatment effect on the treated (ATT) using an alternative DiD estimation approach, the flexible conditional DiD (Dettmann et al., 2020). This method builds on recent approaches to reduce bias in DiD, particularly when dealing with heterogeneous treatment effects (e.g., Callaway & Sant’Anna, 2019; de Chaisemartin & d’Haultfoeuille, 2019; Goodman-Bacon, 2018). The flexible conditional DiD is appropriate when there are differential treatment times (e.g., Promise programs implemented in different years), as well as potential dynamic treatment effects (effects varying over time), which could bias estimates in a two-way fixed-effects approach (Dettmann et al., 2020).
The flexible conditional DiD method involves two stages: a preprocessing phase using a matching technique followed by the DiD estimation (Dettmann et al., 2020). This approach differs from the traditional DiD approach in that each treated unit is assigned individual controls. The DiD estimator takes a weighted average across individual treatment effects (i.e., conditional differences in outcome development between treated units and their controls). In this approach, treated units can only be matched to controls observed at the same time. While this reduces bias, it can also reduce the sample size considerably (Dettmann et al., 2020). We implemented this approach to estimate average treatment effects in the 5 years following Promise program implementation (adding years limits the sample further in the data preprocessing phase). This additional estimator substantiates our main findings on Promise program effects on enrollments of different demographic groups at eligible colleges, as discussed in the Results.
Additional Diagnostics
For both research questions, we employed additional model diagnostics. First, we conducted DiD regressions and generated predicted residuals to examine whether they fit a normal distribution, which showed a negatively skewed distribution. Therefore, we chose to log all variables representing enrollment numbers, population, and financials (tuition and fees, county personal income per capita) to obtain residuals that were more normally distributed.
Furthermore, serial correlation in the error terms of a DiD estimation can produce downwardly biased standard error estimates, risking Type I errors and thus finding significant effects when none exist (Bertrand et al., 2004). For that reason, we conducted a Wooldridge (2010) test, which revealed serial correlation in the idiosyncratic errors among all outcome variables. To correct for bias introduced by serial correlation, we incorporated robust standard errors clustered at the program-college level, thereby adjusting the variance-covariance matrix to accommodate correlated residuals within clusters (program-college pairs). This approach yields more efficient estimates of intervention effects (Bertrand et al., 2004), reduces bias in the standard errors (Angrist & Pischke, 2009), and ascertains that estimates are robust to the homoscedasticity assumption (Rabe-Hesketh & Skrondal, 2012).
Next, recent studies have shed light on potential concerns with two-way fixed effects DiD. The estimate from these models is the weighted average of numerous DiD comparisons (Goodman-Bacon, 2018). The weights for each comparison can vary with the size of the group as well as at what point in the panel the treatment started. One major concern with this approach is that there could be negative weights attached to the individual estimates (e.g., from comparing a group treated later in the panel to one treated earlier), which could bias the average treatment estimates (Goodman-Bacon, 2018). To examine potential concerns with bias in our main DiD two-way fixed-effects models, we tested the weights associated with individual group estimates using de Chaisemartin and d’Haultfoeuille (2019) twowayfeweights module in Stata. Results from that test showed that the weights for each individual comparison were positive (0 negative weights) across all of our models.
Beyond these diagnostic tests and robustness checks, we corrected for multiple comparisons. As described previously, our analytic approach involved testing multiple hypotheses regarding the effects of Promise programs on enrollments of various student groups. Multiple comparisons can inflate the risk of committing Type 1 error (Porter, 2016). Since we conducted a large number of tests, we employed a Benjamini and Hochberg (1995) correction, which reduces the likelihood of Type 1 error but also preserves power. This is the multiple-comparison test correction used by the What Works Clearinghouse (Porter, 2016; U.S. Department of Education, 2014). Specifically, this method controls the False Discovery Rate, or the expected share of all rejected hypotheses that were true null hypotheses (Benjamini & Hochberg, 1995). We restricted the False Discovery Rate to a conservative 5%, allowing for 5% of our rejected hypotheses (finding a statistically significant effect) to be true nulls (no effect exists). The process we followed for performing this correction is described in McDonald (2014). The results presented below apply these adjustments, and thus employ more conservative thresholds of statistical significance than the traditional unadjusted p-value.
Results
Promise Program Impacts on Student Enrollment
Our first research question asks whether Promise programs affect full-time, first-time enrollments at eligible colleges, and whether differential impacts exist between demographic groups. We present results from the DiD and event-study analyses in turn.
Difference-in-Differences
Table 3 shows estimates for the outcome of first-time, full-time, credential-seeking undergraduate students in each group for Comparison Groups 1 to 3. Across these models, Promise programs appear to have no effect on the first-time enrollment of Asian, Native Hawaiian, or Pacific Islander females or males. On the other hand, substantial positive, significant effects emerged for all other racial/ethnic groups, among both females and males. Effects, in percentage terms, are largest for the groups of Black and Hispanic students.
Effect of Promise Programs on First-Time, Full-Time Fall Enrollment (Log)
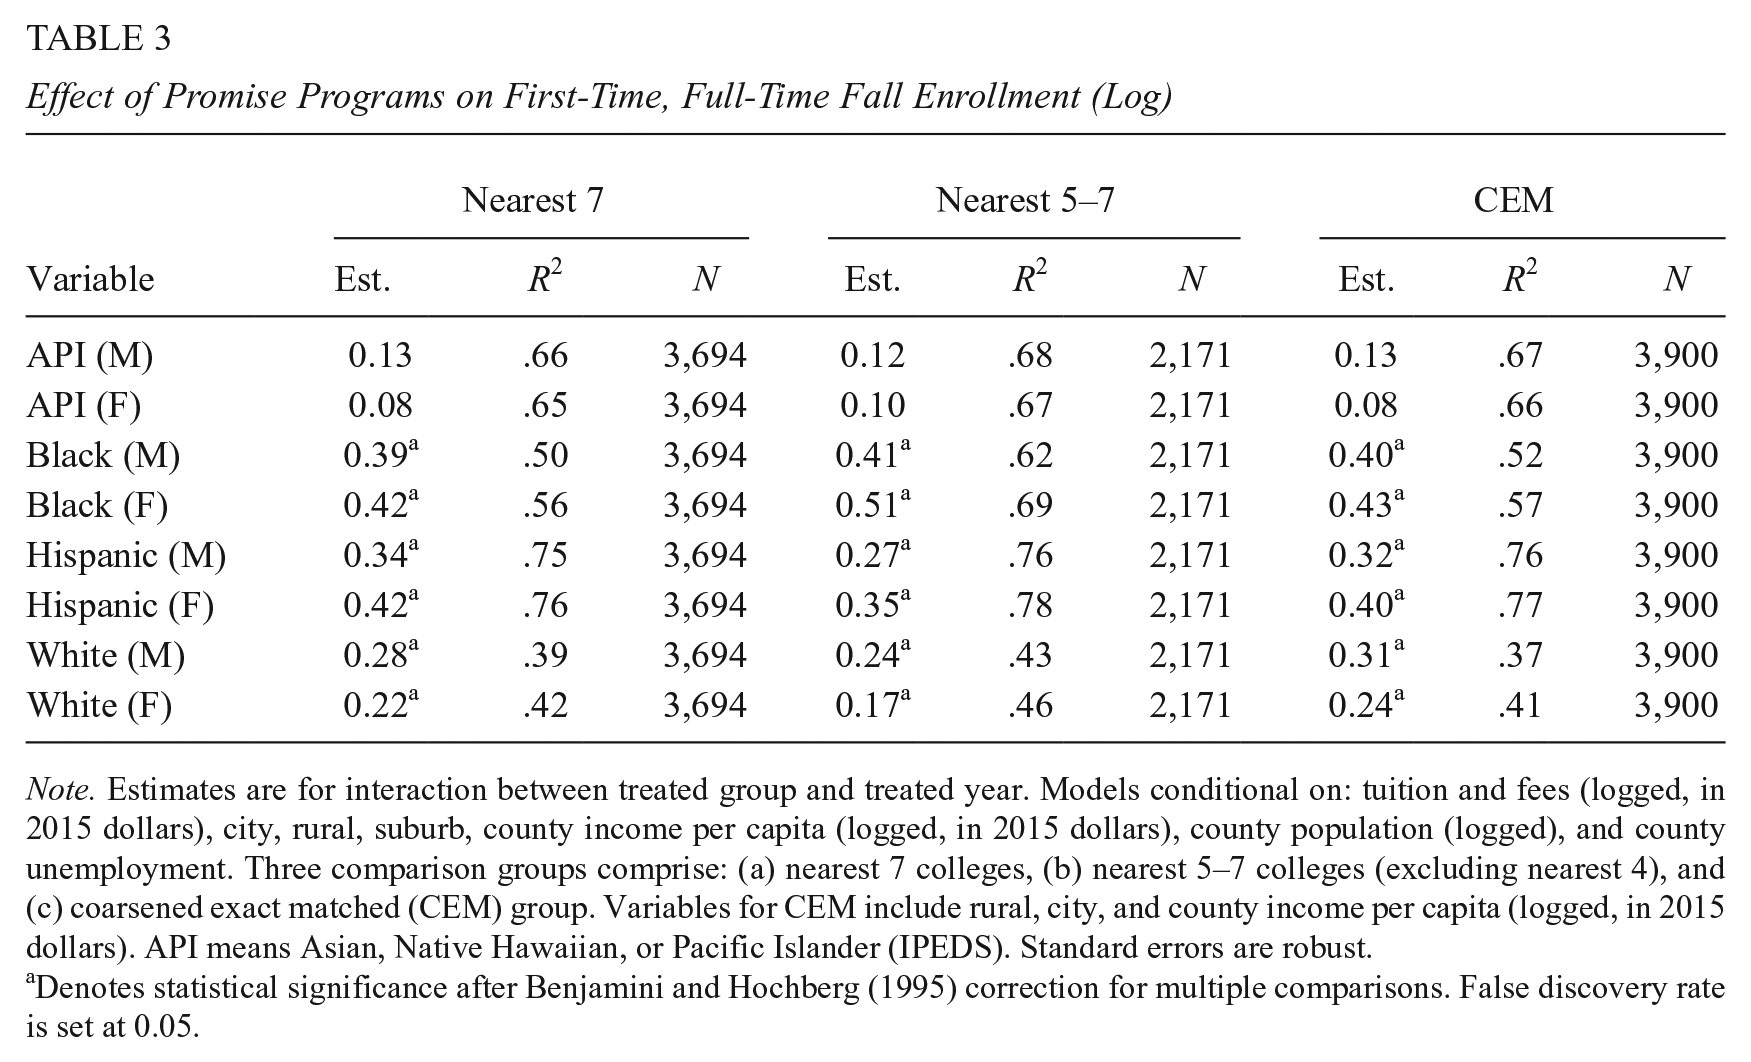
Note. Estimates are for interaction between treated group and treated year. Models conditional on: tuition and fees (logged, in 2015 dollars), city, rural, suburb, county income per capita (logged, in 2015 dollars), county population (logged), and county unemployment. Three comparison groups comprise: (a) nearest 7 colleges, (b) nearest 5–7 colleges (excluding nearest 4), and (c) coarsened exact matched (CEM) group. Variables for CEM include rural, city, and county income per capita (logged, in 2015 dollars). API means Asian, Native Hawaiian, or Pacific Islander (IPEDS). Standard errors are robust.
Denotes statistical significance after Benjamini and Hochberg (1995) correction for multiple comparisons. False discovery rate is set at 0.05.
Looking at the model using the nearest seven colleges (Comparison Group 1), Promise-eligible colleges experienced a 47% increase in the enrollment of Black males (exponentiating the coefficient 0.39 equals 1.47, or 47%), 49% estimated effect from Comparison Group 3, and a 51% increase in Black female enrollment (53% estimated effect from Comparison Group 3). 5 For the average Promise-eligible college, this increase was equivalent to approximately 21 Black male students and 27 Black female students.
Results for Hispanic students show similar enrollment increases to those for Black students. As illustrated in Table 3, the estimated effects are similar across models: 40% increase for Hispanic males from Comparison Group 1 and 37% from Comparison Group 3 and 52% increase for Hispanic females from Comparison Group 1 (49% from Comparison Group 3). The estimated number of new Hispanic students enrolling in eligible colleges is 20 for male students and 30 for female students (from Comparison Group 1 models).
Last, estimates for White student enrollments suggest that Promise programs significantly increased the first-time enrollment of White male students by approximately 32% (an additional 55 students), and had a slightly more modest impact on the enrollment of White female students (a 24% increase, equivalent to 44 students). Although, as we discuss below, event studies suggest these effects for White students appear to be concentrated in later years of the program. Estimates for White male and female students from Comparison Group 3 are 37% and 27%, respectively. Across all of our models, estimated effects of Promise programs on the group of Asian, Native Hawaiian, or Pacific Islander students were negligible.
In summary, our findings show that on average, Promise programs significantly increase the enrollments of all student groups except Asian, Native Hawaiian, or Pacific Islander students (male and female). Percent effects are largest for Hispanic and Black students, especially female students. Indeed, the racial/ethnic composition of colleges appears to change with Promise programs. To investigate this, we modeled the effect of Promise programs on the share of first-time, full-time fall enrolled students from each demographic group (online Appendix A3). Across models, the share of enrolled students who are Hispanic increases significantly with Promise programs (1–2 percentage points). For Asian, Native Hawaiian, or Pacific Islander students, coefficients are negative, though only significant in the CEM model, suggesting the share of these students enrolled in eligible colleges could decrease modestly with Promise programs.
Event-Studies
To complement our primary models addressing the first research question, we investigated how the effect of Promise programs on enrollment changed over time using event-study analyses, as described previously. We plotted the results from these models, using the CEM comparison group (Figure 2). Coefficient estimates for the event studies appear in Table 4.
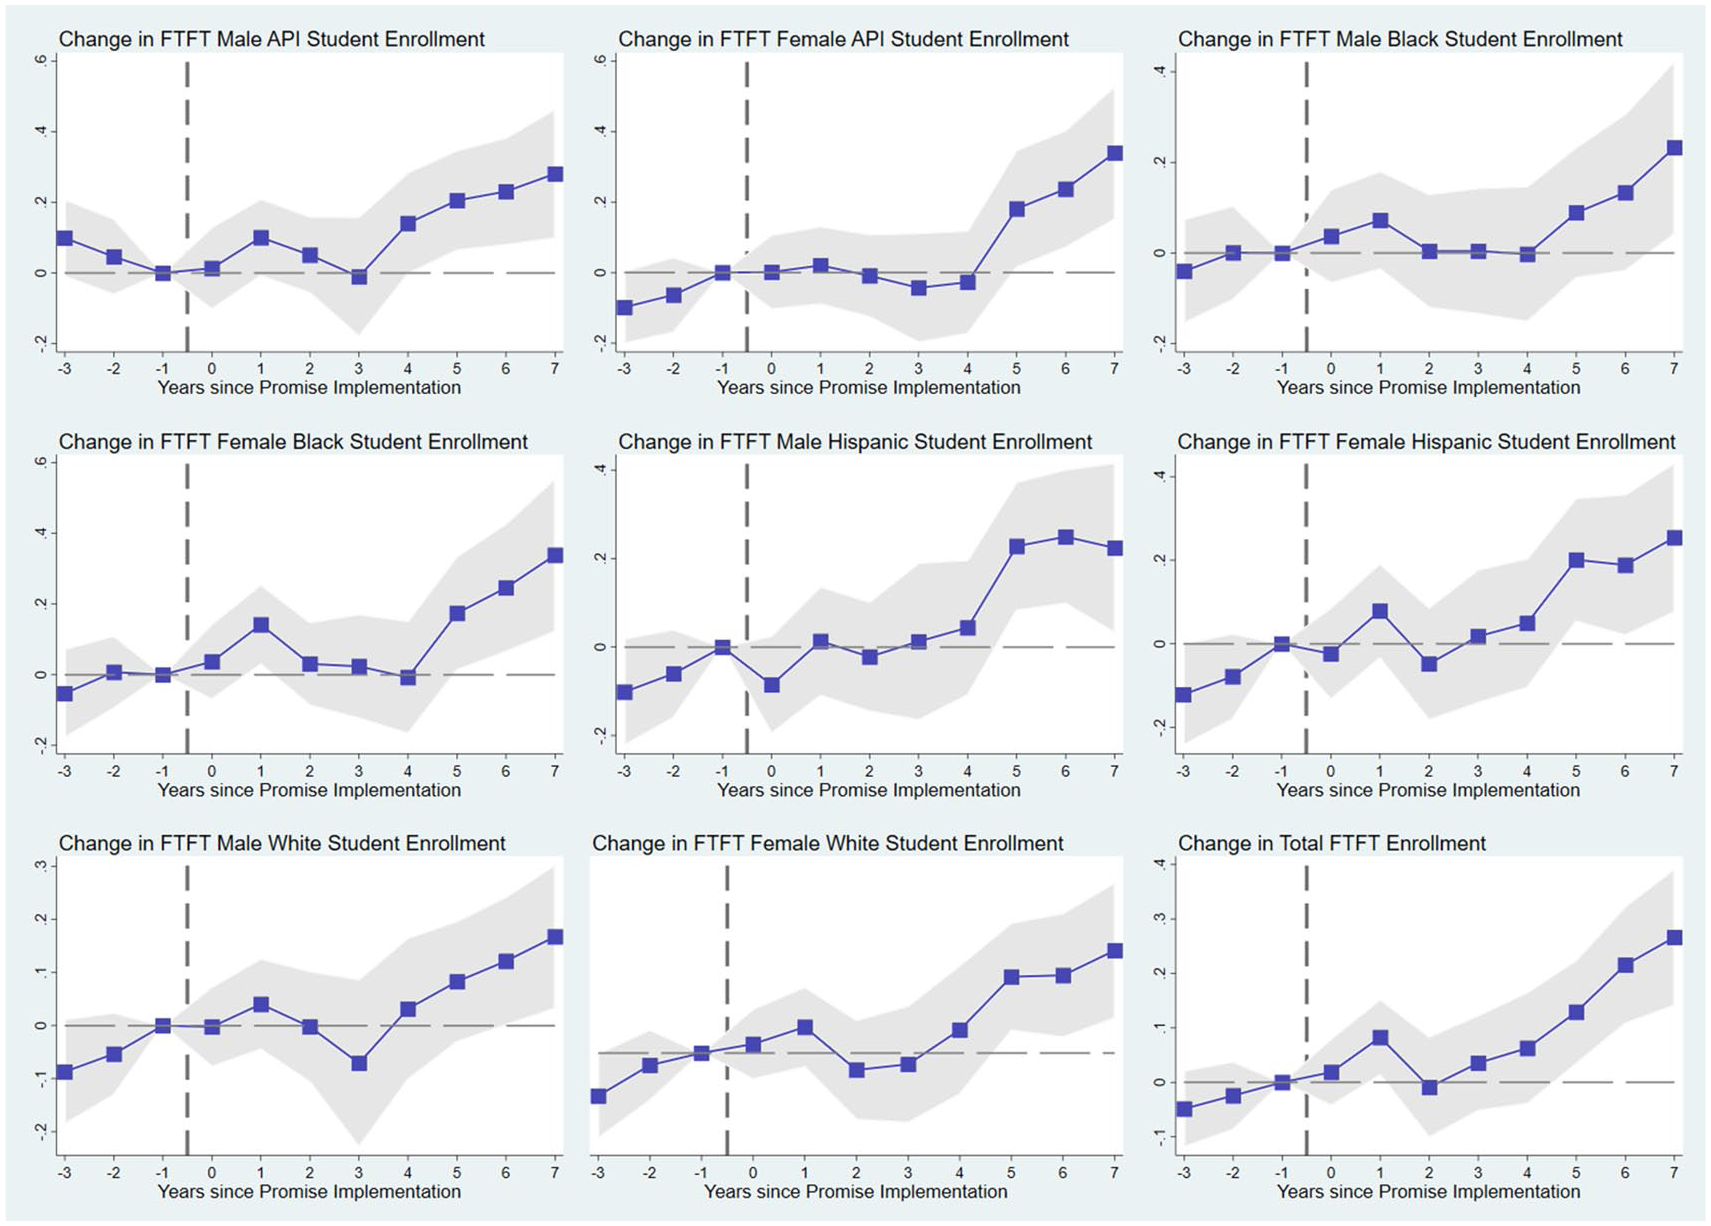
Event studies, promise programs and FTFT enrollment (CEM comparison).
Event Studies of Effect of Promise Programs on First-Time, Full-Time Fall Enrollment (Log), Coarsened-Exact Matching Comparison Group

Note. Event studies conditional on: tuition and fees (logged, in 2015 dollars), city, rural, suburb, county income per capita (logged, in 2015 dollars), county population (logged), and county unemployment. Variables for CEM include rural, city, and county income per capita (logged, in 2015 dollars). API means Asian, Native Hawaiian, or Pacific Islander (IPEDS). Standard errors (parentheses) are robust. CEM = coarsened-exact matching.
p < .05. **p < .01. ***p < .001.
First, event-study results do not show evidence of pre-treatment trends for any models in the 5 years leading up to a Promise program. Beyond these insights, the event studies illustrate that Promise programs have a large positive effect on enrollment in the first year of the program. This effect drops considerably in subsequent years but resumes starting Year 5 and grows substantially in later years of the program. This pattern is relatively consistent across demographic groups, although the magnitude of the effects vary (see Figure 2).
Unlike the DiD results, the event studies detect significant enrollment increases among Asian, Native Hawaiian, or Pacific Islander students at colleges with Promise programs, but only in later years (starting in the fourth year of a program). Still, these numbers are not large enough to increase the share of this demographic group within community colleges, as discussed previously and shown in online Appendix A3.
As a final robustness check, we implemented DiD using the flexible conditional DiD approach (Dettmann et al., 2020). The results from that analysis appear in the online Appendix (A5). Those ATT estimates are largely consistent with results from the two-way fixed effects DiD and the event studies, with a few notable differences. First, this analysis does not detect significant effects of Promise programs on first-time, full-time enrollment of White students or Black male students. Moreover, the magnitude of the effects for Black female and Hispanic male and female students is smaller than that from the two-way fixed effects DiD. However, the flexible conditional DiD approach is limited to 5 years after treatment, given considerable loss in an already limited sample size (n = 126) that would result from adding post-treatment years. As the event studies show, enrollment surges occur in later years of program implementation (in most cases, starting in Year 5). The conditional DiD estimates do not account for the large enrollment increases suggested by the event studies, including for White students, occurring in later years of Promise programs and could thus present an underestimate of the overall program effects, particularly for White students.
Promise Program Effect Variation by Design Features
Our second research question asked whether the effects of Promise programs on student enrollment at eligible colleges differed based on Promise program design characteristics. The results from this analysis across the three different comparison groups appear in Table 5. These findings suggest that first-dollar programs have a positive effect on the enrollment of White students, a finding that is consistent across models.
Effect of Promise Program Features on First-Time, Full-Time Fall Enrollment (Log)
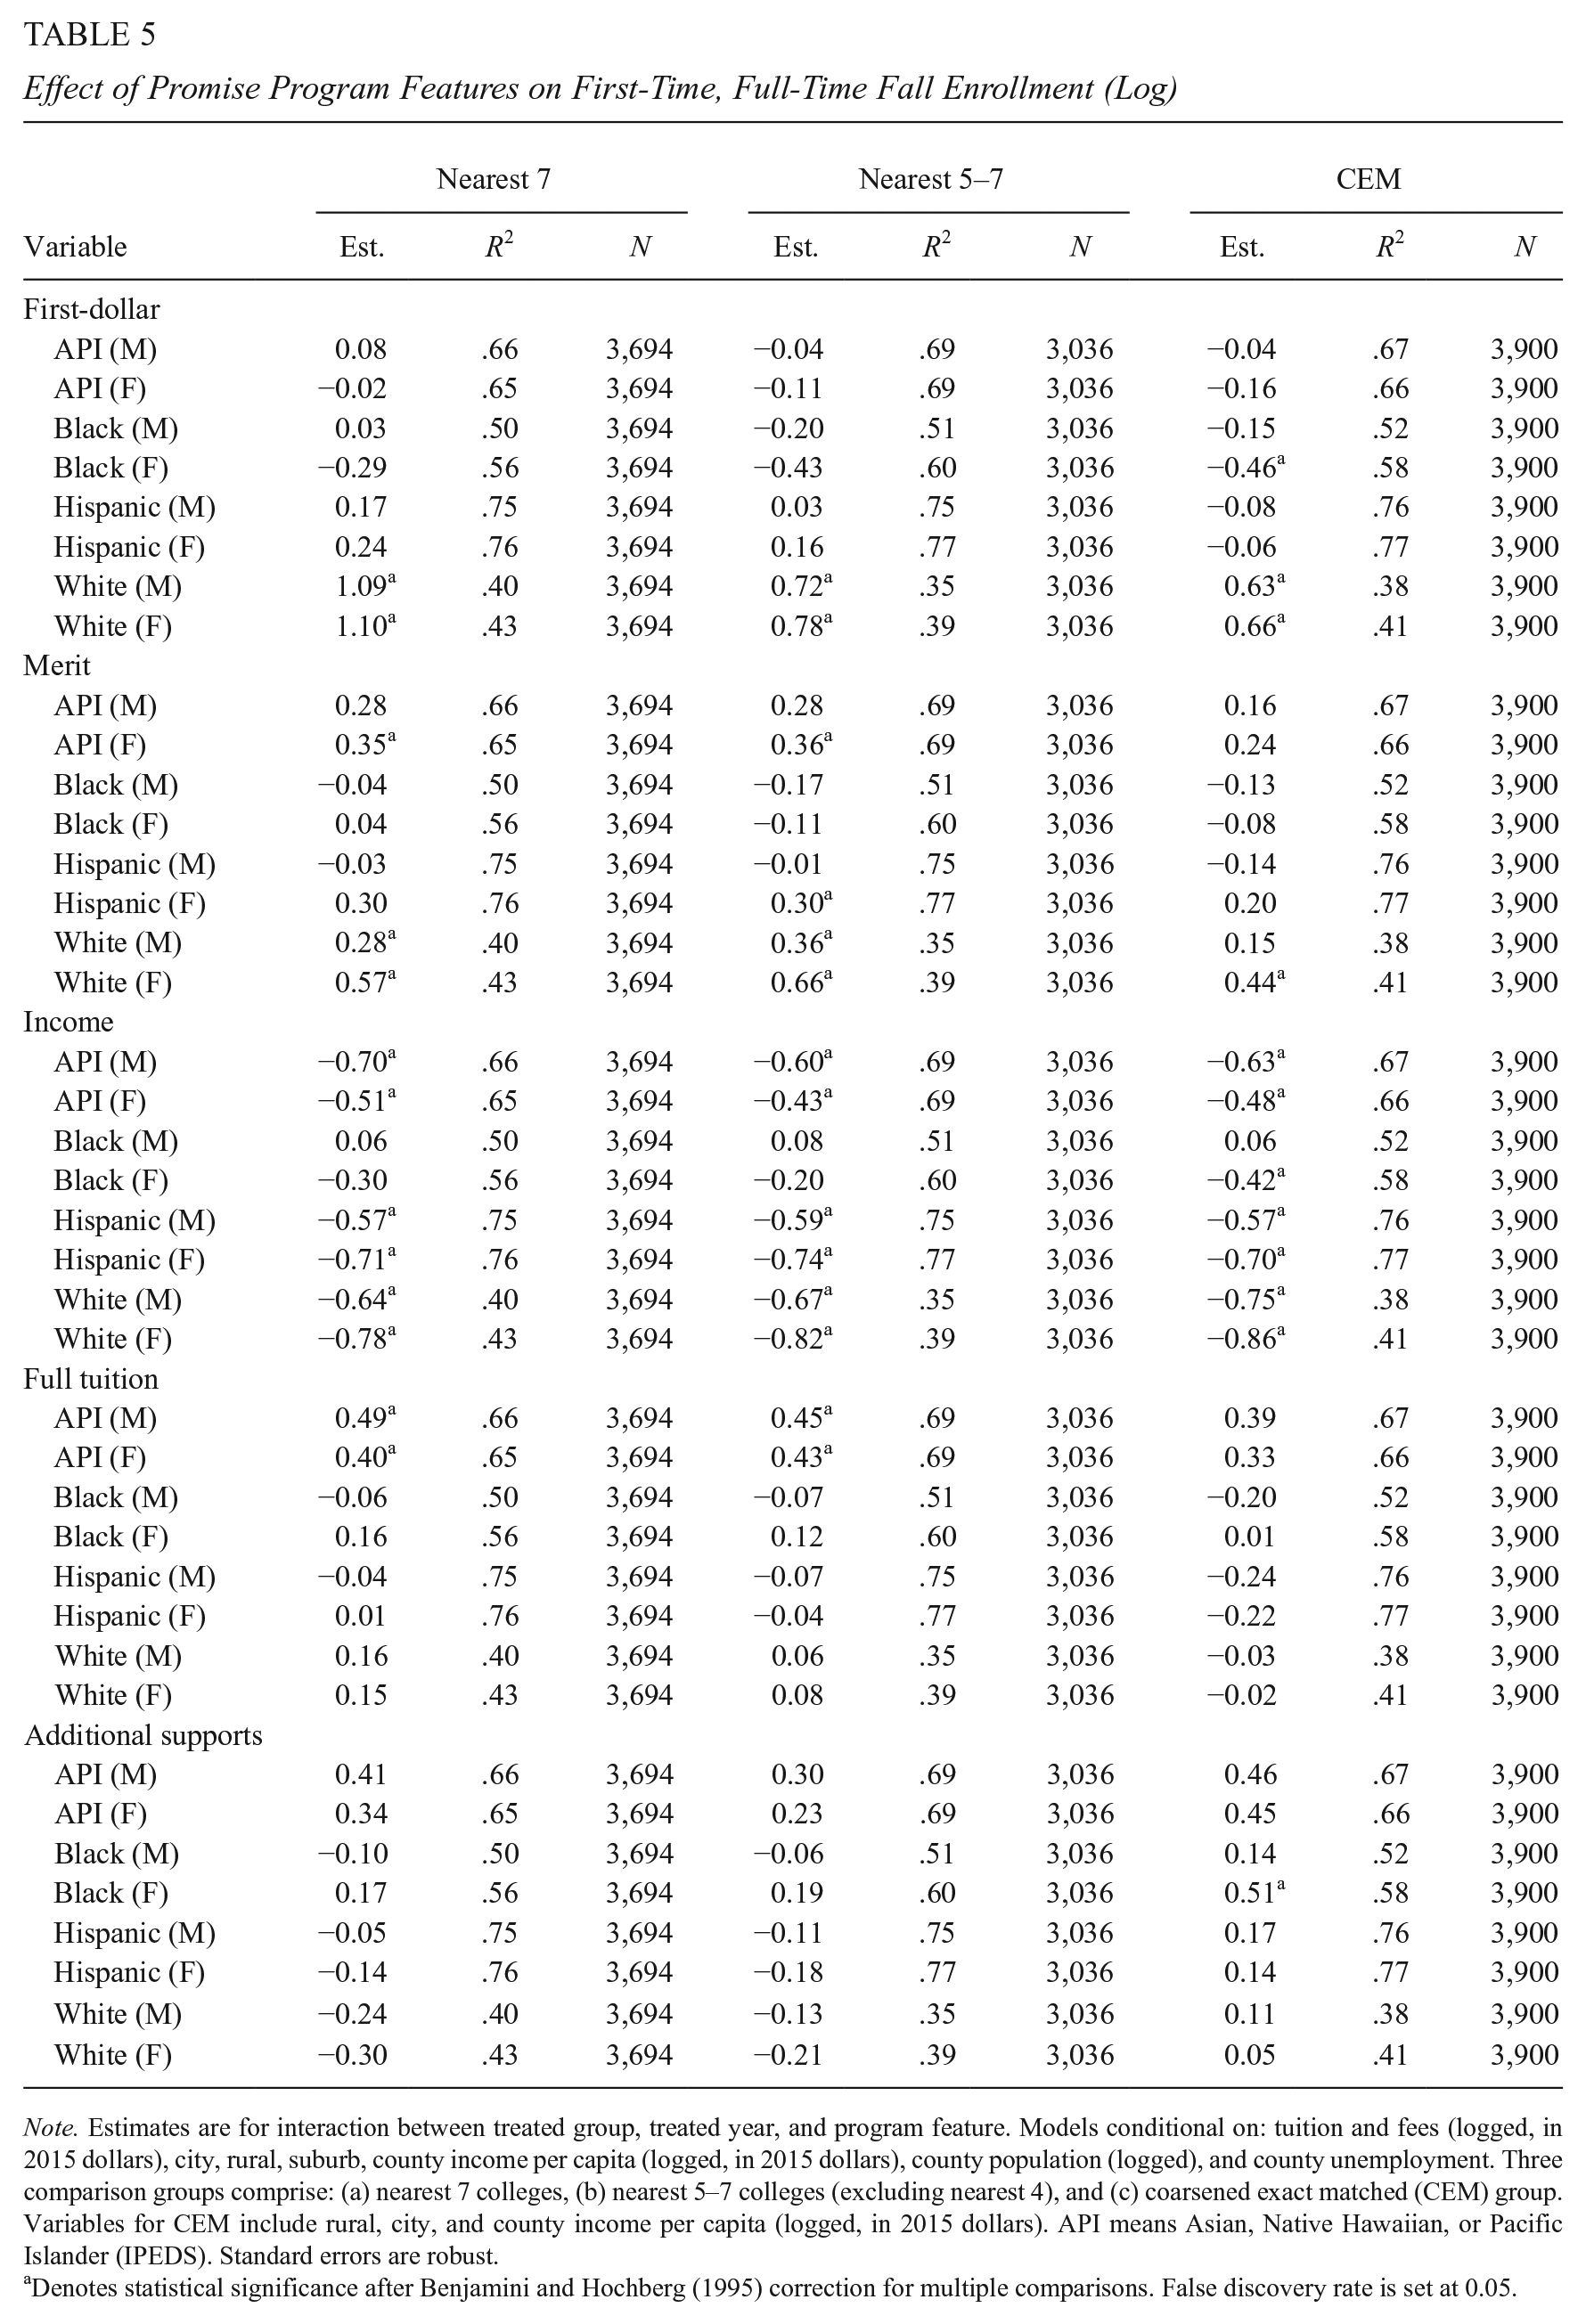
Note. Estimates are for interaction between treated group, treated year, and program feature. Models conditional on: tuition and fees (logged, in 2015 dollars), city, rural, suburb, county income per capita (logged, in 2015 dollars), county population (logged), and county unemployment. Three comparison groups comprise: (a) nearest 7 colleges, (b) nearest 5–7 colleges (excluding nearest 4), and (c) coarsened exact matched (CEM) group. Variables for CEM include rural, city, and county income per capita (logged, in 2015 dollars). API means Asian, Native Hawaiian, or Pacific Islander (IPEDS). Standard errors are robust.
Denotes statistical significance after Benjamini and Hochberg (1995) correction for multiple comparisons. False discovery rate is set at 0.05.
Income criteria are associated with negative effects on enrollment in eligible colleges of all students, except Black male students (for which effects are insignificant). Despite these significant findings, only seven programs (of 33) in our dataset have income criteria. Turning to merit requirements, where we have greater variability within the independent variable of interest, our models suggest merit criteria have positive effects on the enrollment of female students, especially White female students and to a lesser extent Asian, Native Hawaiian, or Pacific Islander and possibly Hispanic students (only significant in Comparison Group 2).
Next, programs that cover full tuition for 2 years are associated with increased enrollment of Asian, Native Hawaiian, or Pacific Islander students. Finally, programs with additional supports (e.g., mentoring and advising) yield mostly insignificant results. The CEM model detects a positive effect of offering additional supports on the enrollment of Black female students. Coefficients for Asian, Native Hawaiian, or Pacific Islander male and female students are also large (from 0.23 to 0.46), but they are not statistically significant after the Benjamini-Hochberg correction for multiple comparisons.
In summary, first-dollar Promise programs, those that award aid regardless of students’ other financial aid, have larger effects on the enrollment of White students than last-dollar programs. Programs with merit requirements (as compared to those without merit requirements) are particularly effective at increasing enrollment in eligible colleges of students classified as female, especially White females. Third, programs with income requirements are associated with lower enrollment, relative to programs without income requirements across all student groups, except Black male students. Programs that cover full tuition for 2 years, relative to those that only cover partial tuition, are associated with increased enrollment of Asian, Native Hawaiian, or Pacific Islander students. Programs with additional support services appear to increase the enrollment of Black females, an effect detected only in the CEM model.
Limitations
We note four limitations to our analysis of Promise program effects on enrollments at eligible colleges, beyond the limitations of IPEDS data we noted previously. First, we relied on institution-level data to model micro-level (i.e., student) decisions. Because our primary interest was in how demographics change at eligible colleges, we believe this unit of analysis is appropriate. This analysis also provides practically useful insights for college administrators and other stakeholders regarding anticipated changes in enrollments of different student groups following Promise program implementation.
Second, we were unable to examine variation in Promise program effects by students’ income, since income status is often related to Promise-program eligibility. Third, the changes in first-time, full-time enrollment we observe could in part be due to changes in enrollment intensity (i.e., more students enrolling full-time instead of part-time). To examine this possibility, we modeled Equation 1 using total undergraduate enrollment (both part-time and full-time) as the dependent variable for all demographic groups. Those results (online Appendix A4) show even larger estimated effects of Promise programs on enrollment, suggesting the changes we observe are largely driven by new students enrolling in eligible community colleges and not changes in enrollment intensity.
Last, it is not possible to infer causality with certainty, since we relied on extant data and quasi-experimental techniques for this analysis. However, by employing numerous comparison groups and robustness checks, we have made ample efforts to bolster the internal validity of our results. We also present results from numerous modeling strategies to maximize transparency and allow the reader to interpret the results, consistent with the American Educational Research Association’s (2006) standards for reporting social science research.
Discussion and Implications
This study examined how Promise programs that can be used at a single, 2-year college affect the enrollment of students across different demographic groups. We also explored how enrollment effects vary according to Promise program-design features. We found that racially minoritized female students experienced the greatest enrollment increases—in percentage terms—under these single-college Promise programs for community colleges.
In particular, this study reveals large percentage increases in enrollments for colleges with Promise programs (23% on average across the years of the program). These findings of the positive effects of Promise programs on enrollment are qualitatively similar to those from previous studies on Promise programs for community colleges. A study of Knox Achieves, a Promise program for community colleges in Tennessee, estimated intent-to-treat program effects on enrollment ranging from 11% to 17% (Carruthers & Fox, 2016). While that study did not examine program effects on institutions, it provided suggestive evidence that enrollments would increase considerably in eligible colleges. For instance, to estimate the potential impact on a single college, we look at Pellissippi State Community College, which is the only community college in Knox County, where students were required to reside to be eligible for Knox Achieves. If Knox Achieves only induced enrollment at Pellissippi, and all participating students enrolled full-time as required by the Promise (an overestimate), enrollment at Pellissippi would more than double. Although that is a liberal estimate since students could use Knox Achieves aid at other community colleges in the state, it provides some evidence suggesting large enrollment increases at eligible colleges following Promise program implementation.
Indeed, a recent study most similar to our own but examining a single program also finds large, positive Promise program effects on enrollment. In particular, Nguyen (2020) examined the effects of the Tennessee Promise on eligible community colleges. That study estimated a conservative 40% positive effect of the Tennessee Promise on enrollment at eligible colleges. Moreover, similar to our study, Nguyen found large, significant enrollment increases for Black and Hispanic students.
Similar to Nguyen (2020) and Carruthers and Fox (2016), our effect sizes are considerably larger than those associated with incremental tuition price changes. For instance, Deming and Walters (2017) found small and insignificant effects of tuition increases on college enrollment. However, prior research suggests that Promise programs are distinct from standard tuition price reductions in numerous ways. First, students respond less dramatically to modest price reductions than they do to more generous college subsidies (Herbaut & Geven, 2019). Second, Promise programs are different from other subsidies, even generous ones. For instance, in addition to reducing price, Promise programs can create a college-going culture in schools and communities and change students’ perceptions of affordability by conveying a “free college” message (Miller-Adams, 2015). Indeed, qualitative evidence of Promise programs documents changes in school culture as well as students’ academic motivation and postsecondary aspirations associated with Promise programs (e.g., Gonzalez et al., 2011, 2014; Miron et al., 2012). In summary, Promise programs differ from incremental price reductions in significant ways that can yield more substantial changes in students’ college choices (Miller-Adams, 2015).
Beyond average effects over the program’s life, in this study we were interested in variation in program effects over time. Our event-study results suggest that enrollment surges appear to be concentrated in the first year of the program, followed by reductions in subsequent years, and greater increases as the program matures (starting in year five). Understanding these trends, both the magnitude of effects on enrollment and how these effects manifest over time, could be instructive to community college officials starting or redesigning a Promise program.
Turning to heterogeneous effects across demographic groups, this study finds that Black and Hispanic students, especially females, experienced the largest percent enrollment increases of all demographic groups. This finding is also consistent with previous literature suggesting racially minoritized students might be more sensitive to financial aid (e.g., Linsenmeier et al., 2006). Similarly, research on the Kalamazoo Promise found that students classified as male or racially minoritized were more likely to enroll in less selective universities (Billings, 2018), although looking at all eligible institutions, including the flagships, Bartik and colleagues (2017) found similar effects of the Kalamazoo Promise across racial/ethnic groups.
One important finding for college officials is that the demographic composition of community colleges appears to change with Promise programs. In particular, we detected significant increases (1–2 percentage points) in the percent of students enrolled in Promise-eligible colleges who identify as Hispanic. It is critical that community colleges are prepared to serve racially minoritized students with adequate resources as well as strategies that are culturally relevant and informed by members of racially minoritized communities (Bensimon, 2017; Felix & Castro, 2018). Trends in Promise program adoption and evidence of their effects underscore the urgency of these efforts.
One key insight from our study is that more generous programs might be more likely to attract students categorized as White or Asian, Native Hawaiian, or Pacific Islander students. In particular, our study revealed that the first-dollar program feature had a large and significant effect on the enrollment of White students, but not other demographic groups. Turning to the full-tuition feature, Asian, Native Hawaiian, or Pacific Islander students are more likely to enroll in Promise colleges when the program covers full tuition. White and Asian, Native Hawaiian, or Pacific Islander students historically have the highest levels of educational attainment in the aggregate (although there is wide variation within groups). From the perspective of vertical equity, which calls for greater resources for those with greater need (Berne & Stiefel, 1984), this finding suggests the Promise programs we examine may not be distributing resources equitably. Although percent increases in enrollment resulting from Promise programs are larger among historically underserved students, for more generous programs, effect sizes are larger among White and Asian, Native Hawaiian, or Pacific Islander students. This finding magnifies extant concerns with last-dollar programs, which by design award more aid to more financially advantaged students (Jones & Berger, 2018). Our findings suggest racially minoritized students are more likely to participate in last-dollar programs but less likely to receive aid from them.
Last, the study’s findings related to eligibility criteria are illuminating. Programs with merit requirements have larger positive effects on the enrollment of female students at these colleges than programs without merit requirements, a finding that is consistent with Dynarski (2008). Programs with income criteria have consistent negative effects on enrollment of all groups, except Black male students. This negative effect of income requirements could be related to higher administrative burdens (e.g., requiring proof of income or FAFSA completion) associated with accessing these programs. The potential administrative costs (for students) of including income criteria in Promise programs should be weighed against the benefits from the perspective of vertical equity and efficiency of targeting Promise aid to students who need it most. Future research, including qualitative investigations, should examine how students respond to different program-design elements, including income requirements, and how these responses differ across demographic groups. Future research should also examine students’ success after enrolling in a 2-year college via a Promise program and how success varies based on Promise program features and across demographic groups. Last, researchers should attend to the variation in impacts of financial aid and college-access interventions for students with racial/ethnic and gender identities that are not captured in our data.
Supplemental Material
Denisa_Gandara_Online_Appendix – Supplemental material for Promise for Whom? “Free-College” Programs and Enrollments by Race and Gender Classifications at Public, 2-Year Colleges
Supplemental material, Denisa_Gandara_Online_Appendix for Promise for Whom? “Free-College” Programs and Enrollments by Race and Gender Classifications at Public, 2-Year Colleges by Denisa Gándara and Amy Li in Educational Evaluation and Policy Analysis
Footnotes
Declaration of Conflicting Interests
The author(s) declared no potential conflicts of interest with respect to the research, authorship, and/or publication of this article.
Funding
The author(s) disclosed receipt of the following financial support for the research, authorship, and/or publication of this article: This research was supported by a grant from the American Educational Research Association which receives funds for its “AERA Grants Program” from the National Science Foundation under NSF Grant #DRL-1749275. Opinions reflect those of the author(s) and do not necessarily reflect those of the granting agencies.

Notes
Authors
DENISA GÁNDARA is an assistant professor of education policy and leadership at Southern Methodist University. Her work examines higher education policy, politics, and finance with a focus on populations that have historically been underserved in higher education.
AMY LI is an assistant professor of higher education at Florida International University. Her research focuses on higher education finance and public policy, specifically performance funding, Promise programs, student loan debt, state appropriations, and policy adoption.
References
Supplementary Material
Please find the following supplemental material available below.
For Open Access articles published under a Creative Commons License, all supplemental material carries the same license as the article it is associated with.
For non-Open Access articles published, all supplemental material carries a non-exclusive license, and permission requests for re-use of supplemental material or any part of supplemental material shall be sent directly to the copyright owner as specified in the copyright notice associated with the article.
