



Abstract
Verification is a federally mandated process that requires selected students to further attest that the information reported on their Free Application for Federal Student Aid (FAFSA) is accurate and complete. In this brief, we estimate institutional costs of administrating the FAFSA verification mandate and consider variation in costs by institution type and sector. Using data from 2014, we estimate that compliance costs to institutions in that year totaled nearly US$500 million with the burden falling disproportionately on public institutions and community colleges, in particular. Specifically, we estimate that 22% of an average community college’s financial aid office operating budget is devoted to verification procedures, compared with 15% at public 4-year institutions. Our analysis is timely, given that rates of FAFSA verification have increased in recent years.
Every year approximately 6 million of the 20 million students who apply for federal financial aid through the Free Application for Federal Student Aid (FAFSA) undergo further scrutiny of their application (Cochrane et al., 2010; Dynarski & Scott-Clayton, 2006; Page et al., 2020). This process, termed verification, may impede students’ access to the nearly US$120 billion in aid the U.S. Department of Education (ED) awards every year (Federal Student Aid, 2018). Verification is a federally mandated process that requires students to further attest that the information reported on their FAFSA is accurate. ED selects students to be verified through an unpublished risk model (AlQaisi et al., 2020; Hoover, 2017). Some students selected must attest to relatively straightforward inputs like family size. For others, however, the verification process requires that they provide their college or university with official financial documentation (e.g., a W-2 to verify parental income) or even have their parents file an amended tax return (AlQaisi et al., 2020; Evans et al., 2017). Then, the student’s institution—not ED—is responsible for reviewing and approving the documentation.
The more complex a student’s financial situation, the longer the verification process may take (Friedmann & Martorell, 2018). Students who complete the application process later may receive less aid than they otherwise could have qualified for (McKinney & Novak, 2015) or no aid at all if they fail to complete verification (Cochrane et al., 2010).
The stated purpose of the verification process is to assure federal financial aid is distributed to students who are “rightly” entitled to it. ED’s primary concern is the Pell grant, given that it is the most extensive need-based aid program and comprises the majority of nonrepayment federal aid (Bettinger et al., 2012). Pell-eligible FAFSA filers are flagged for verification at 6 times the rate of non-Pell-eligible filers (Wiederspan, 2019), with more than one quarter of FAFSA filers being selected for verification (National College Attainment Network [NCAN], 2018b). Nevertheless, the vast majority of students selected experience no change in the federal aid for which they were eligible (Evans et al., 2017; NCAN, 2018a). With little apparent effect on the aid for which students ultimately qualify, verification serves as a potentially unnecessary hurdle to college matriculation and success, especially for lower-income and historically marginalized students (Campbell et al., 2015; Davidson, 2014; Evans et al., 2017; Graves, 2019; Page et al., 2020; Wiederspan, 2019).
Given this disproportionate burden on low-income students, FAFSA verification may also create a disproportionate burden on institutions these students are likely to attend. The verification requirement is an unfunded mandate that suffers from the general weakness of such policy instruments. Namely, the mandate’s enforcement is costly to the entity responsible for complying with it (McDonnell & Elmore, 1987). As colleges and universities are responsible for administrating verification, policymakers should be concerned with the compliance burdens that the requirement creates, especially as financial aid offices often have limited resources and have experienced budget declines in recent years (AlQaisi et al., 2020; Cochrane et al., 2010; Davidson, 2014; National Association of Student Financial Aid Administrators [NASFAA], 2015, 2020).
In this brief, we estimate the institutional costs of complying with and administrating the federal FAFSA verification mandate. We consider variation in costs by institution type and sector (e.g., 2-year publics, 4-year publics, and 4-year privates) and contextualize these costs by comparing them with institutional student services expenditures. Using data from 2014, we estimate annual compliance costs to institutions of nearly US$500 million overall, with the burden falling disproportionately on public institutions and community colleges, in particular. Specifically, we estimate that the average community college devotes 22% of its financial aid office operating budget to verification procedures, compared with 15% for public 4-year and 1% for private 4-year institutions. Our analysis is timely, given that rates of FAFSA verification have increased recently (Douglas-Gabriel, 2017; Smith, 2018).
Analysis and Results
Our analysis employs data from the Integrated Postsecondary Education Data System (IPEDS). Published annually by the National Center for Education Statistics, IPEDS is a database including all U.S. postsecondary institutions that participate in federal student financial aid programs. For each institution, we obtain undergraduate counts, the proportion of full-time, first-time (FT-FT) students receiving any financial aid (federal, state, or institutional aid), and the proportion of FT-FT students receiving Pell funds specifically. We assume that students who receive state or institutional aid also completed the FAFSA and therefore fall under the verification requirement.
Ideally, for each institution, we would observe the share of all undergraduates who received any financial aid; however, this is not reported in IPEDS. Therefore, we assume that aid receipt rates for FT-FT students provide a reasonable estimate for students overall. We acknowledge that this assumption is not ideal but reason that the direction of any bias in our estimates resulting from our analytic decisions is ambiguous (as discussed further in the supplemental appendix in the online version of the journal). For each institution, we estimate the number of undergraduates receiving Pell grant funding and the number receiving non-Pell aid by multiplying each institution’s FT-FT Pell and non-Pell aid receipt percentages by their total undergraduate enrollment. We calculate these counts separately by Pell status as rates with which students are selected for verification vary by Pell eligibility (Oster et al., 2020; Wiederspan, 2019).
We focus on 2014 IPEDS data to align with other information sources we rely on (discussed below). Our analytical sample includes 2,837 not-for-profit institutions that serve students who receive Title IV funds and, as such, fall under the verification mandate. On average, institutions in our sample have enrollments of about 4,500 undergraduates who received some form of aid. Average enrollments are largest among 4-year publics (approximately 9,000 students) compared with 2-year publics (4,700) and 4-year privates (2,000). Of students receiving aid, 57% received Pell funding specifically, with higher rates of Pell reliance at 2-year publics (72%), compared with 4-year publics (51%) and privates (45%).
Next, we estimate the number of financial aid recipients each institution would have had to verify by Pell status. We know of no national source for verification rates for non-Pell-eligible students. Therefore, we rely on verification rates in the state of Iowa, which, as reported by Wiederspan (2019), differ substantially by Pell status. From Wiederspan (2019), we impose a 60% verification rate for Pell students and a 10% rate for non-Pell students. Imposing these rates, we estimate that institutions, on average, verified 39% of undergraduates who received aid. We estimate that 2-year publics verified nearly half (46%) of aid recipients compared with lower rates at 4-year publics (35%) and privates (38%). These estimates align with previously reported verification rates (Cochrane et al., 2010; NCAN, 2018a; Oster et al., 2020; U.S. Department of Education, 2019). Note that in IPEDS we only observe students who receive aid once enrolled. Therefore, our estimates provide a lower bound for the number of students each institution verified as counts do not include students who applied to but did not enroll in a particular institution.
Next, we consider the costs that verification imposes on each institution. Doing so requires an estimate of the process’s per-student cost. To inform this estimate, we draw on a 1999 U.S. Inspector General report, which provides the last major audit of the verification process. At that time, the federal government estimated that the institutional cost to verify one student was US$81 (1999$). Using the Higher Education Price Index (Commonfund Institute, 2017), we adjust this to US$134 in 2014$. To account for possible increases in efficiency of verifying students between 1999 and 2014, we round this US$134 cost down and conservatively assume an institutional cost of US$100 per student verified. The report provides little information regarding how the cost calculation was constructed beyond indicating that it includes salary “plus other costs” (U.S. Department of Education, 2002). We reason that these other costs likely include staff fringe benefits and other transaction costs of the verification process. In short, costs that would still be present today.
Based on a US$100 per-student cost, we estimate that in 2014 the average institution spent US$170,000 processing verifications and that total cost across institutions was US$481 million. In Figure 1, Panel A, we present estimated total cost by institutional sector, and in Panel B, average cost by sector. Verification costs fall more to public institutions, with 2-year publics spending US$225 million and 4-year publics spending US$189 million. The 4-year private sector faces a considerably lower compliance cost burden (US$67 million).
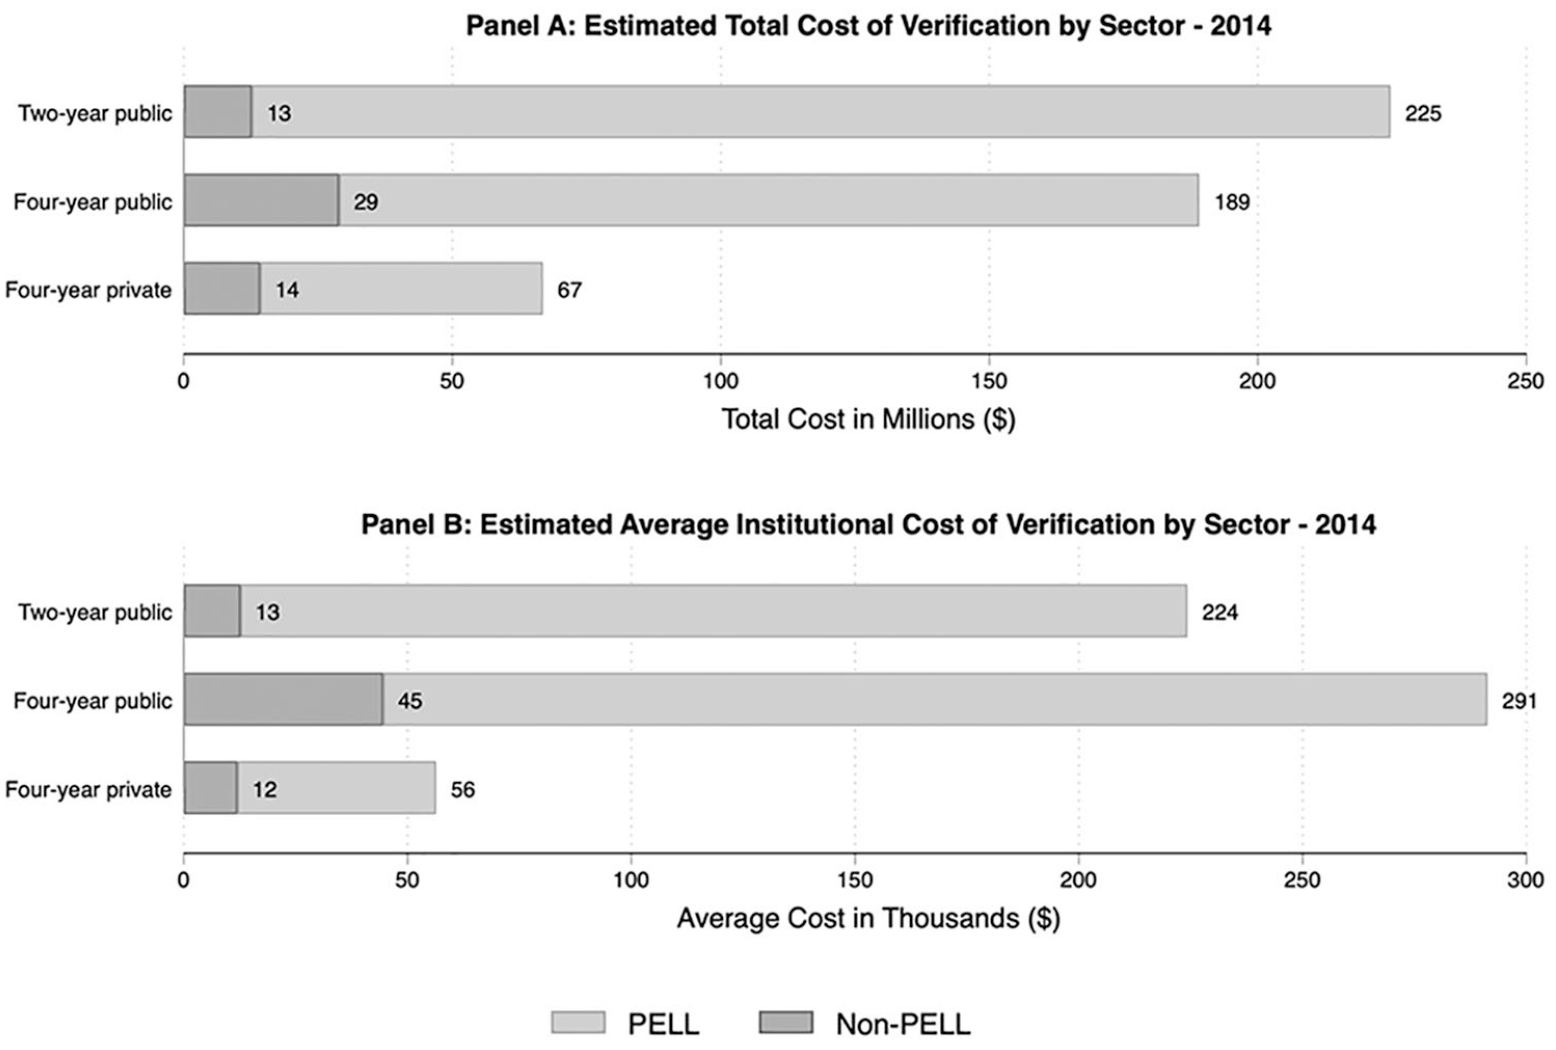
Estimated cost of verification, by sector (2014).
Of course, one might expect public institutions to face higher costs, given that they serve more students overall and a higher proportion of Pell students. Rather than by size, we scale our estimates by institutional resources. To do so, we first draw on information from the NASFAA Administrative Burden Survey for estimates of average financial aid office operating budget by postsecondary sector (NASFAA, 2015). NASFAA is a U.S. advocacy group for financial aid administrators. NASFAA conducts its burden survey on a several-year cycle with the last administration occurring in 2014. NASFAA administered this survey to its entire membership of 2,700 postsecondary institutions, with about one quarter responding. Recognizing that nonresponse bias may influence results, we introduce a second approach to scaling below.
On average, responding institutions reported an annual financial aid office operating budget of US$3.4 million, with levels ranging substantially from an average of nearly US$1 million at 2-year publics to US$6.3 million for 4-year privates. Using these estimates, we scale average institutional verification costs as a function of average financial aid office operating budget. In Figure 2, Panel A, we present results. Four-year and 2-year public institutions devote a sizable share of their financial aid operating budget to administrating verification. The average 4-year public devotes 15% of its financial aid office operating budget to conducting verification, compared with 1% at the typical 4-year private institution. The average community college spends US$224,000 annually, or 22% of its aid office budget on verification. This equates to approximately three full-time staff dedicated to processing verifications. Our estimates align with a recent NASFAA (2020) report in which financial aid offices reported spending 20% or more of their operating budget processing verifications.
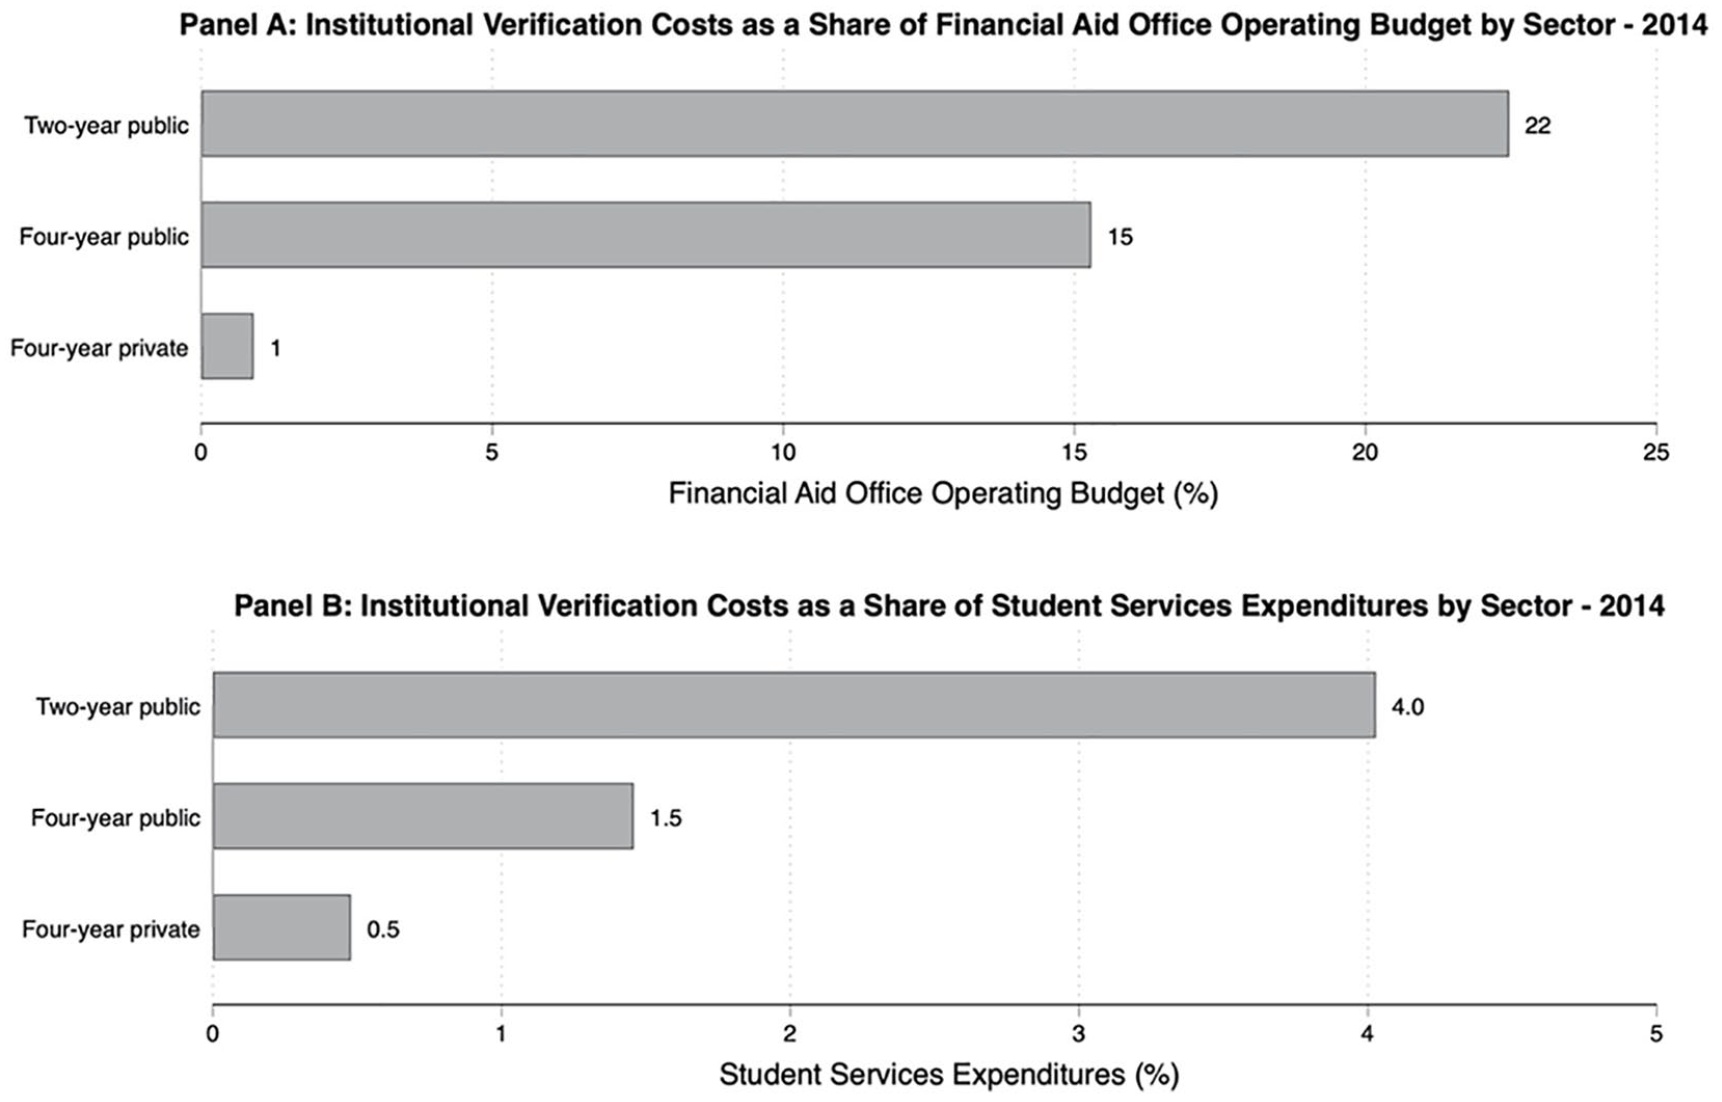
Estimated average institutional verification costs as a share of financial aid office operating budget and total student services expenditures, by sector (2014).
Nonresponse bias may render the NASFAA survey an imperfect source of information. Therefore, we also scale institution-level verification expenditures by total student services expenditures (as reported in IPEDS). This variable includes all operating expenses associated with student services, inclusive of financial aid administration. Although IPEDS does not report financial aid administration costs more narrowly, a benefit of this measure is that we observe it for all schools in our sample. In Figure 2, Panel B, we present average verification cost as a share of student services expenditures by sector. These results tell a similar story. The average 4-year public devotes 1.5% of its student services budget to the verification process, compared with 0.5% at the typical 4-year private. This rate is again higher for community colleges, which, on average, spend 4% of student services budgets on verification, a rate 8 times higher than for private, 4-year institutions.
Discussion and Implications
In 2014, administrating verification processes cost U.S. higher education nearly US$500 million, the equivalent of more than 130,000 additional Pell grants (or 2% of Pell awardees) in that year (in 2014, the average Pell grant was $US3,768; U.S. Department of Education, 2017). These costs are borne disproportionately by public institutions and community colleges, in particular. Community colleges devote a larger percentage of their financial aid operating and student services budgets to managing FAFSA verification. This is concerning, given that community colleges enroll nearly half of all undergraduates (Ma & Baum, 2016), and they disproportionately serve the least well-resourced students who, as a result, most need financial aid to support their access to higher education (Campbell et al., 2015; Davidson, 2014; McKinney & Novak, 2015). In short, it is costlier for community colleges to meet the verification mandate to facilitate their students’ access to financial aid.
More broadly, financial aid offices can be “characterized by limiting operating resources,” and financial aid administrators have experienced an increase in administrative burden due to increases in the rate with which students are selected for verification (NASFAA, 2015). This increase in verification prevalence has, according to NASFAA, crowded out other supports that financial aid offices might provide (e.g., emergency aid counseling) that may be especially important for lower-income and historically marginalized students. In addition, increased verification rates add stress to the college-going process for these very students (Campbell et al., 2015; Cochrane et al., 2010).
Of course, a key question is whether current verification processes are preventing the misappropriation of federal aid. Recent evidence suggests the answer is no. A 2019 federal audit report on verification concluded that ED failed to monitor its process for selecting students for verification, and there was “no reasonable assurance that the verification processes effectively identified FAFSAs with errors that would result in improper payments” (U.S. Department of Education, 2019). This is consistent with evidence noted above that most students required to navigate verification had little to no change in their aid eligibility (AlQaisi et al., 2020; Evans et al., 2017; NCAN, 2018a). As a point of comparison, it is notable that the federal government flags low-income FAFSA filers for further scrutiny at nearly 60 times the rate with which federal tax returns are selected for audit (Dynarski & Scott-Clayton, 2006). Such comparisons lead financial aid administrators to question why students are repeatedly required to “prove they are poor” (Megahed, 2019).
With the recent passage of the FUTURE Act, Congress has signaled potential improvements to FAFSA verification. The FUTURE Act will further enhance direct data-sharing agreement between the U.S. Treasury and ED, allowing for automatic data transfer from the Internal Revenue Service (IRS) to ED. This, in theory, should reduce the rate with which income fields are flagged for verification, as income would be “preverified.” However, such changes may not lessen the burden on students with more complex household financial situations.
Furthermore, ED has recently announced a decrease in the verification selection rate for the upcoming 2021–2022 FAFSA filer cohort (Hoover, 2020). This comes after ED completed an internal unpublished cost-benefit analysis that determined that verification costs exceeded benefits when more than 18% of all FAFSA filers were flagged for verification (Hoover, 2020). This is a move in the right direction; however, Pell-eligible students likely will continue to be verified at higher rates, given their recent overrepresentation among those selected.
Beyond these steps, we call for greater transparency in how ED selects students for verification, an external audit of the current processes, and careful consideration of how compliance expenditures could be repurposed to address other pressing needs within the financial aid system. The verification mandate deserves further scrutiny given that it places a disproportionate burden on institutions serving the neediest students and especially as more students with financially precarious circumstances may seek postsecondary education during a period of global recession (U.S. Census Bureau, 2018).
Supplemental Material
sj-docx-1-epa-10.3102_01623737211001420 – Supplemental material for Disproportionate Burden: Estimating the Cost of FAFSA Verification for Public Colleges and Universities
Supplemental material, sj-docx-1-epa-10.3102_01623737211001420 for Disproportionate Burden: Estimating the Cost of FAFSA Verification for Public Colleges and Universities by Alberto Guzman-Alvarez and Lindsay C. Page in Educational Evaluation and Policy Analysis
Footnotes
Acknowledgements
We thank Kevin Totty for his support and generous time in discussions that led up to the creation of this manuscript. We thank Danielle Lowry, Emily Howe, Dr. Aizat Nurshatayeva, Dr. Aaron Anthony, Dr. Richard Correnti, Dr. Najeeb Shafiq, and attendees at AEFP for their insightful comments. Special thanks to Bill DeBaun, Dr. Dennis A. Kramer, Charlotte Etier, and Dr. Paco Martorell for their insightful reviews that lead to the revision of this manuscript. The opinions expressed are those of the authors. All errors are our own.
Declaration of Conflicting Interests
The author(s) declared no potential conflicts of interest with respect to the research, authorship, and/or publication of this article.
Funding
The author(s) received no financial support for the research, authorship, and/or publication of this article.

Authors
ALBERTO GUZMAN-ALVAREZ is a PhD student in the Learning Sciences and Policy Program at the University of Pittsburgh. His research focuses on quantitative methods and their application to educational policy issues around college access.
LINDSAY C. PAGE is an associate professor of research methodology and a research scientist in the Learning Research and Development Center at the University of Pittsburgh. Her research focuses on quantitative methods and their application to questions regarding the effectiveness of educational policies and programs across the preschool to postsecondary spectrum.
References
Supplementary Material
Please find the following supplemental material available below.
For Open Access articles published under a Creative Commons License, all supplemental material carries the same license as the article it is associated with.
For non-Open Access articles published, all supplemental material carries a non-exclusive license, and permission requests for re-use of supplemental material or any part of supplemental material shall be sent directly to the copyright owner as specified in the copyright notice associated with the article.
