
Abstract
Research using school discipline and infraction data has contributed to public policy conversations by helping elucidate the effects of and disproportionate experience of school disciplinary outcomes. This research brief presents results from an analysis of the public availability of such data from state departments of education. Findings suggest that while public availability of discipline data has not changed significantly over the past decade, states are more likely to disaggregate such data by subgroups. Unfortunately, such data remain generally focused on a small number of exclusionary practices rather than nonpunitive or nonexclusionary alternatives. Infraction data are slightly less available than discipline data and significantly less likely to be disaggregated by subgroup.
The availability of data on school discipline (i.e., the formal responses to infractions taken by schools such as suspensions or expulsions) and infractions (i.e., the behaviors interpreted by school personnel as violations of school rules, such as fights or weapons possession) has the potential to inform these research, policy, and practice conversations. Yet, these data have not always been as accessible as researchers, policymakers, and the public may desire. Federal data sets often include data only for a sample of schools or years (as is the case for the School Survey on Crime and Safety) and may only be released several years after collection.
The most comprehensive of federal data sets to include discipline and infraction data, the Civil Rights Data Collection (CRDC) has moved to a publicly available census of all schools; however, their data are released with a significant time delay (at the time of this writing in 2023, the most recently available CRDC data are from the 2017 iteration) that limits its ability to inform current practice and policy. The CRDC is also only collected every other year, preventing a full panel of data. What is more, the CRDC only asks about a limited number of disciplinary outcomes and infractions (namely, punitive disciplinary approaches such as suspension and expulsion and serious infractions like fights and weapons offenses), providing little evidence on alternative nonexclusionary disciplinary approaches and low-level infractions.
These shortcomings of federal data are addressed in some states’ administrative data, which, in a number of cases, are provided annually, posted within months of the end of a school year, and provide further information on a wider range of indicators. However, the variables included in state data sets can vary across contexts. For example, a review of state department of education (DOE) websites in 2013 found that 20% of states did not publicly report any discipline data (The Center for Civil Rights Remedies, 2013). Among those that did, states were more likely to report aggregate data at the state level rather than individual school level. Particular to equity, only around a third of states reported discipline data disaggregated by race/ethnicity, gender, or special education status (The Center for Civil Rights Remedies, 2013).
To advance school discipline and safety research and effectively inform policy and practice, it is necessary to consider the types, quality, and availability of discipline and infraction data. This research brief serves to inform these conversations by describing the availability of such data from state departments of education. In doing so, it updates and, by including infraction data, expands on work conducted a decade ago by the University of California, Los Angeles Civil Rights Project (The Center for Civil Rights Remedies, 2013).
The findings provide a picture of the availability of discipline and infraction data as well as the types of data made publicly available from state departments of education. While this brief focuses on summaries of findings across states, the accompanying spreadsheet (available at https://education.ufl.edu/eprc/2023/03/18/disciplinedata/) provides details on the availability of data in specific states serving as a resource for researchers and other interested entities. As described next, the compilation of available data reflects what is publicly available and was able to be found via searches of state DOE websites.
Method
We searched state DOE websites for publicly available school discipline and infraction data. Our search was conducted in the fall 2021 and involved two members of the research team searching for available data and double coding available data found for each state. To allow for comparisons over time, our coding scheme closely mirrored that used in a compilation of discipline data conducted a decade ago (The Center for Civil Rights Remedies, 2013) but also added infraction data.
Data were collected through a systematic search of each state’s (and [District of Columbia’s]) DOE website in the fall 2021. We restricted our search to available data from state departments of education. We recognize that data of interest may be available from other entities such as universities, nonprofits, and individual school districts. While searching for such sources was beyond the scope of our data collection, we note that some districts provide publicly available aggregate data, and many researchers do make use of nonpublic student-level data from districts and other sources. In addition, we also did not include cases in which state DOEs reported federal data from the CRDC on their DOE website, given that these data were both dated and are available for all states from the federal government. As such, our search focused on and our findings are specific to the data available from state DOEs on their websites.
We developed a coding protocol that closely mirrored that used in a prior study of discipline data (The Center for Civil Rights Remedies, 2013). First, we coded a binary indicator of whether discipline data were available and the level of aggregation (state, district, and school level). For example, the state of Arkansas reported discipline data at the state and district level but not at the individual school level.
For states where discipline data were found for any of the three levels (state, district, or school), we coded specific details of the type and how the data were recorded. We included five measures of exclusionary discipline data: in-school suspensions (ISSs), out-of-school suspensions (OSSs), a combined total of ISS and OSS, expulsions, and a combined total of suspensions and expulsions. Across these, we also coded whether the data were reported as number/percent of students or of incidents (recognizing that these can differ as individual students may experience a disciplinary consequence more than once in a given year). We also documented whether type of infraction (reason why disciplinary actions were taken) was reported. For example, some states report the frequency of suspensions for specific infractions such as fights.
In addition to measures of exclusionary discipline, we documented whether data included disciplinary actions other than the ones reported above, which could include both punitive (e.g., detention, corporal punishment) as well as nonpunitive or nonexclusionary responses (e.g., conflict resolution, counseling, and peer mediation). Finally, we recorded whether data were disaggregated by race/ethnicity, gender, and special education status.
Unlike prior work, we also examined whether state DOEs provided public access to infraction data. Like the discipline data, we documented whether infraction data were available at the state, district, and school level using a binary indicator. Such infraction data included cases where the data were linked to disciplinary outcomes (e.g., number of weapons offenses that led to suspension) but also instances where infraction data were provided directly (number/percent of weapons offenses), without a link to particular disciplinary outcomes. Like the discipline data, we coded whether infractions were provided as the number/percent of infractions or of students engaged in such infractions. We also differentiated between those that provided data on serious infractions (e.g., weapons, fights, threats, sexual assaults) and less serious infractions (e.g., disrespect, code of conduct violations, alcohol/tobacco possession). Where infraction data were available, we then coded whether they were disaggregated by race/ethnicity, gender, and special education status.
Data collection and coding were split between four researchers with each researcher coding the states assigned to them and then double coding another researcher’s assigned states. Any differences that were found while double coding were noted and discussed collectively as a group to reach consensus. Where possible, we emailed DOE representatives for states where we could find no data to confirm the lack of available data. That said, given the complexity of state DOE websites, we recognize that our manual search of state DOE website may have missed some publicly available data. We also recognize that websites and availability of data are continually changing. In addition, many states have mechanisms for requesting data through research requests or public records requests, which may yield additional available data beyond the scope of our search. Given this, findings should be interpreted as a snapshot of publicly available discipline and infraction data on state DOE websites in 2021 that was readily found through a reasonable search process.
Key Findings
In the sections that follow, we present results of our data collection for school discipline and infraction data.
Availability of School Discipline Data
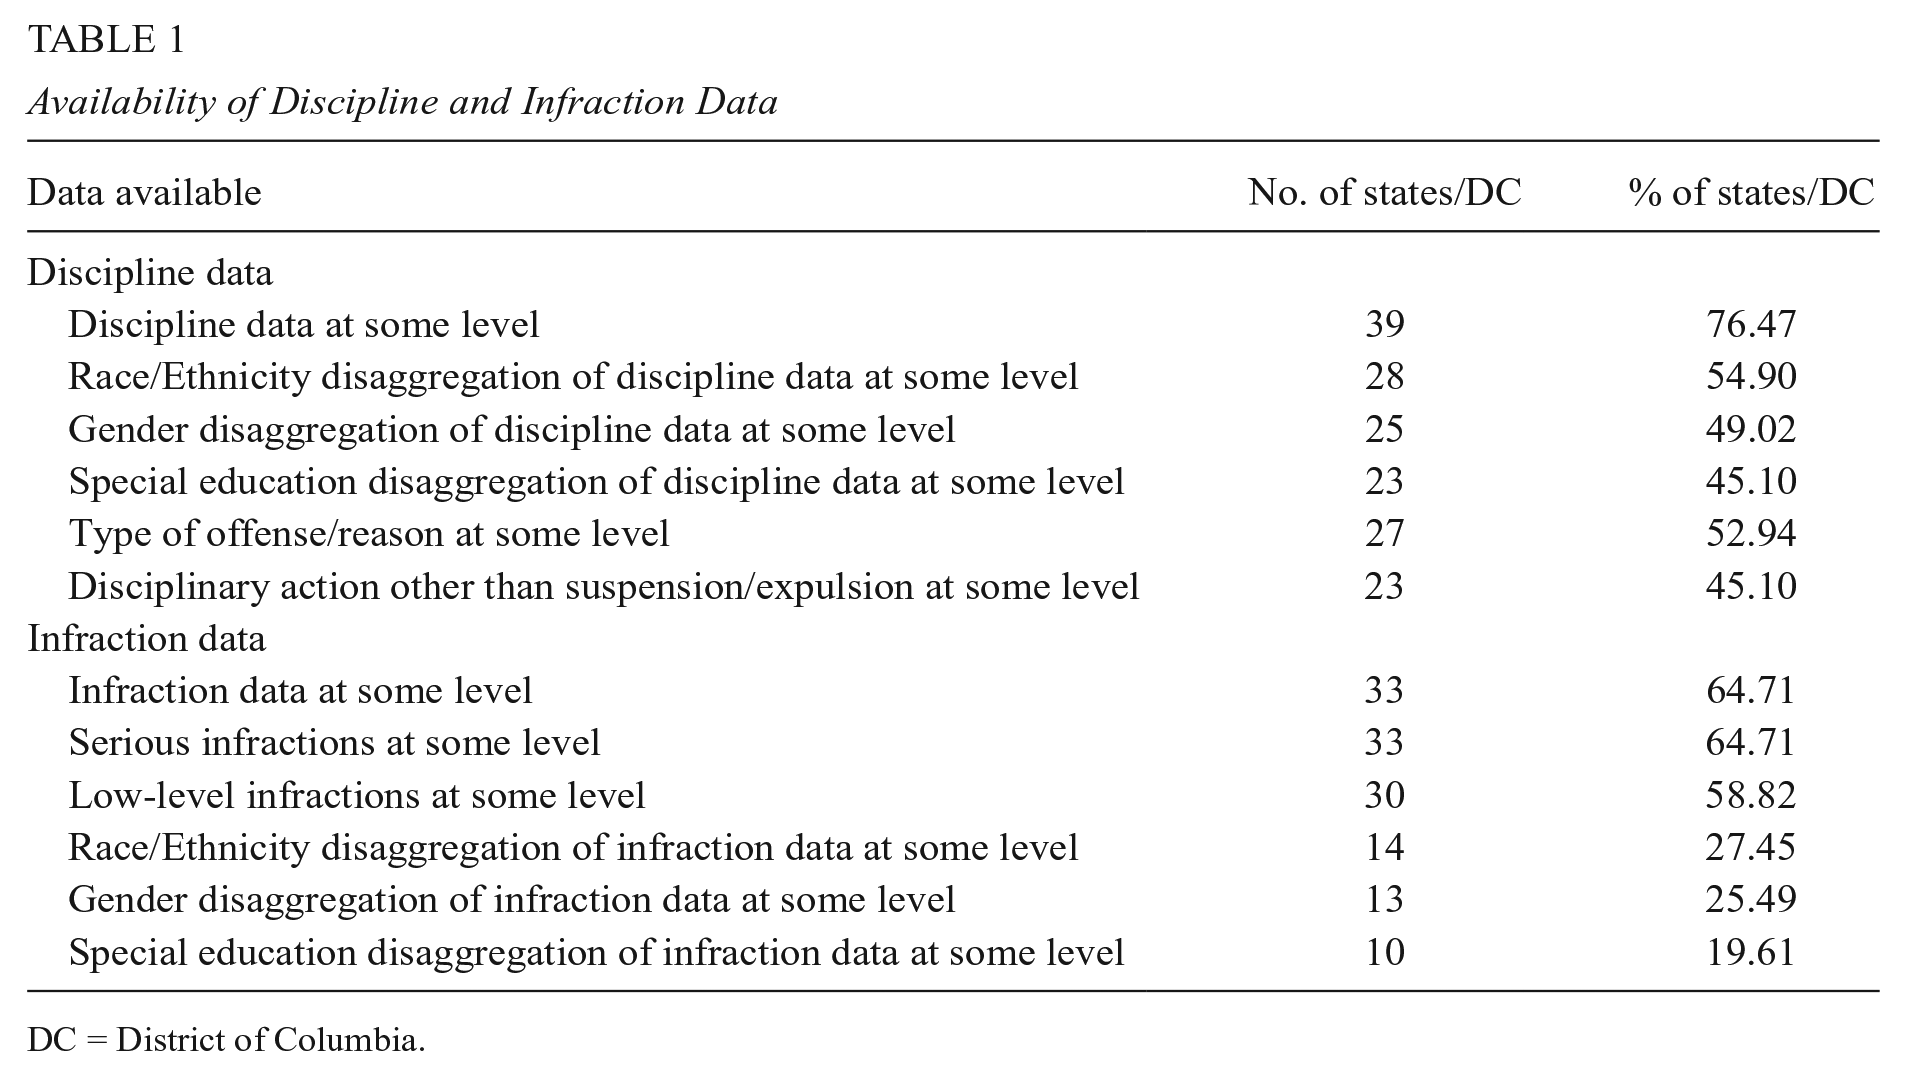
Overall, the availability of discipline data from state DOEs has not changed significantly over the past decade. We were able to identify 38 states plus the District of Columbia (76.47%) with publicly available school discipline data (see Table 1). This was slightly lower than the 80% identified in 2013 by the UCLA Civil Rights Project. In other words, despite increased attention to school discipline over the past decade, states have had little change in publicly disclosing school discipline data.
Availability of Discipline and Infraction Data
DC = District of Columbia.
That said, when state DOEs did make discipline data available, they were significantly more likely to disaggregate the data across subgroups than they were nearly a decade ago. We found that around 50% of states reported data (whether at the state, district, or school level) disaggregated by race, gender, and special education status. In 2013, only one third of states disaggregated data in these ways. Geographically, the availability of discipline data and the disaggregation of data were generally dispersed across regions including both conservative and more liberal states (see panel A of Figure 1).

School-level data and disaggregation by race/ethnicity by state.
Compared with discipline data, we found that the availability of data on infractions was slightly less common though still available for most states (64.71% of states/DC; see Panel B of Table 1). When such infraction data did exist, however, it was almost 50% less likely to be disaggregated by student subgroups. As shown in Table 1, about a quarter of states disaggregated infraction data by race or gender and around one in five did so for special education status. This lack of disaggregation may inhibit researchers’ ability to examine disproportionalities in school personnel’s decisions about whose behavior is identified and responded to as a violation of school discipline policy, an important first step in the disciplinary process.
Variation in Data Aggregation and Format
Although most states made discipline and infraction data available, we document significant variation in the types and format of data collected and reported by state departments of education. First, we note that both discipline and infraction data were most common at an aggregate state level. Discipline data were most common at the aggregate state level (68.63%) with only half of the states (52.94%) reporting data disaggregated to the school level. Infraction data were available for 56.86% of states aggregated to the state level but only 49% and 43% of states at the district and school level, respectively.
In Table 2, we document further variation in the formats of available discipline and infraction data disaggregated by state, district, and school levels. As shown, while exclusionary practices like suspension and expulsion were commonly reported, states varied in whether such data were reported individually by exclusion type (expulsion, OSS, and ISS) or in combined categories. In some cases, states reported ISS and OSS combined or OSS and expulsion combined. Similarly, states varied in whether they reported these data as the number of students experiencing a disciplinary consequence or the number of disciplinary consequences administered. As shown in Table 2, states were about evenly split in whether they reported duplicated or unduplicated counts of such disciplinary incidents. This distinction is important, given the propensity for many students, particularly those from marginalized subgroups, to experience multiple disciplinary events in a year.
Discipline and Infraction Data Characteristics by Level

Note. Table presents the number (N column) and percentage (% column) of states with publicly available data with specified characteristics.
While alternatives to exclusionary discipline have gained significant traction over the last decade, less than half of the states reported data on disciplinary actions other than suspension and expulsion. Where they did, many of the other reported actions were still punitive or exclusionary in nature, such as corporal punishment or detention. Relatively few states reported the frequency of nonpunitive or nonexclusionary practices. There were a few exceptions, such as in Pennsylvania where a number of responses, including counseling, peer mediation, and conflict resolution, were reported as well as Arkansas where parent conferences were reported.
In contrast to discipline data, infraction data were 3 to 4 times more likely to be reported as the number or percentage of incidents rather than the number of students who committed a particular infraction. Where infraction data were reported, data generally included some less serious infractions alongside more serious infractions. While most data sources included serious infractions like weapons and physical violence, most also included low-level infractions like tobacco and alcohol. Many also included infractions like bullying. Routine behavioral infractions like disruptions or disrespect were less common but included in some states.
Recommendations and Opportunities for Future Analysis
The available data and variation therein provide a range of opportunities for analysis by public stakeholders, schools, and other government organizations, as well as researchers. We provide the following research questions as examples of the types of questions researchers may address using publicly available discipline and infraction data and then detail further the unique value of publicly available discipline and infraction data:
Research Question 1 How do particular discipline or safety policy changes (e.g., updates to a districts’ code of conduct; state bans on exclusionary discipline for truancy) relate to changes in exclusionary discipline or incident rates?
Research Question 2 How do underlying rates of infractions relate to disciplinary consequences administered in schools?
Research Question 3 How do discipline rates and disparities therein differ when measured using different metrics?
First, while differences in collection and reporting of discipline and infraction data across states preclude the creation of a single national data set from state data, where data are collected using consistent metrics (such as the number of students experiencing an OSS), analysts can compile longitudinal data sets with annual data across a number of states. Compared with federal sources like the CRDC, such data would include annual (rather than every other year) data with quicker availability to the public, allowing more immediate analysis of trends, comparisons across states, and examination of relationships between policy and practice changes and discipline or infraction rates (Example Research Question 1).
Next, we note that the availability of data sets with more detailed data on infraction types and those that link type of infraction to disciplinary outcome provides the public with a powerful resource to understand the flow between infraction to disciplinary outcome (Example Research Question 2). For example, Iowa reports the number of incidents of particular infractions (ranging from minor infractions like dress code violations to serious ones like physical injury) that led to particular disciplinary outcomes. While researchers may have such data through access agreements to nonpublic data, the availability of such data publicly allows a wider range of stakeholders to engage in similar analyses.
The variation across state data sets in terms of choice of metric as well as level of aggregation provides an opportunity then for analysts to examine how different metrics relate to observed rates of discipline and disparities therein, potentially shedding light on issues of equity that may be masked by certain data collection and reporting choices (Girvan et al., 2019). For example, researchers could examine whether disparities appear larger or smaller when comparing the metrics used in the federal CRDC with differing metrics (e.g., counts of disciplinary consequences as compared with counts of students disciplined) used in particular states (Example Research Question 3).
While the existing publicly available discipline and infraction data provide rich opportunities for extending research by addressing such questions, there are also opportunities to extend the value of states’ publicly available discipline data. We include several recommendations here for future updates to states’ publicly available data:
States without publicly available discipline and infraction data should consider releasing such data each year in publicly accessible formats.
States should consider expanding the availability of subgroup disaggregated discipline and infraction data, while taking care to be clear that disparities may reflect in part differential enforcement of discipline across groups.
States should consider collecting and providing more detailed data on the use of alternatives to exclusionary discipline. Such data could include both indicators of use of school-wide programs like restorative practices as well as data on specific responses to student infractions like a peer mediation session. While implementation of these alternatives varies across districts and schools, there are examples of states that collect such data using general categories like “counseling” and “conflict resolution” that could be used as models.
States should consider releasing more detailed infraction data. Such data could include a wider range of both serious and nonserious infractions as well as, for those not already doing so, data on the extent to which particular infractions are linked to specific disciplinary outcomes like suspension.
Limitations
We recognize that the estimates captured in this research brief reflect that found through a search of state DOE websites. Many states and school districts may make discipline data and infraction data available through other mechanisms (such as through research requests) or may publish aggregate findings related to discipline and infractions while not making underlying data available. While our focus was on publicly available data from state DOEs, we note then that researchers and members of the public may have other avenues for accessing discipline and infraction data.
We also acknowledge that the availability of data, even with many indicators, does not ensure data quality. There are documented cases of underreporting of discipline/infraction data and states where reporting of such data by school districts is not required for all students (e.g., Whisman, 2015). In addition, even if reported accurately, discipline and infraction data represent the interpretation and response to misconduct by school personnel, a process that can be biased (Lewis & Diamond, 2015; Okonofua & Eberhardt, 2015). This means that discipline and infraction data do not provide a true measure of underlying student behavior but rather the imperfect nexus of student behavior and school personnel interpretation. Furthermore, such data do not necessarily reflect the disciplinary programs and policy choices of schools, which could be reported as some states do alongside discipline and infraction data. While similar data quality issues also apply to the federal CRDC (Losen & Martinez, 2020), we note the importance of critically analyzing the quality of data provided by states. For a resource for laws related to discipline data reporting, we point readers to the National Center on Safe Supportive Learning Environment’s Compendium of School Discipline Laws and Regulations which includes a compilation of state laws related to monitoring and accountability of school discipline.
Finally, we recognize that the public availability of such data is dynamic, potentially changing since the time of our data collection. For example, the state of Alabama’s DOE was in the process of overhauling their website at the time of our data collection, resulting in identification of data in a preliminary search but no available data during our formal search. In the spreadsheet (https://education.ufl.edu/eprc/2023/03/18/disciplinedata/), we provide detailed information on available data by state as well as welcome suggestions for updates as additional data are identified or made available. We envision future updates to the spreadsheet so that it serves as an ongoing resource for researchers and policymakers.
Conclusion
This brief has highlighted the public availability of statewide school discipline and infraction data from state departments of education. Our results update and expand on estimates conducted a decade ago and document important changes over time. Despite increased attention to school discipline over the past several decades, our results suggest that around one in five states still does not make discipline data publicly available via DOE websites. Where data are available, they are typically limited to information on the exclusionary practices of suspension and expulsion, and, for most states, are available only in an aggregate form at the state or district level.
As public debate over school discipline continues, there is a need to step back and examine the broader disciplinary environment in schools. To further research, policy, and practice, there is a need for expanded public access to school discipline and infraction data. For researchers and policymakers, such availability of data holds promise for informing these conversations and monitoring progress toward safe, effective, and equitable schools.
Footnotes
Acknowledgements
The authors appreciate the input and feedback of the organizing committee (Samantha Viano, Alvin Pearman, Joseph Gardella, and Benjamin Fisher) and participants of the Improving Data for School Discipline Research conference.
Declaration of Conflicting Interests
The author(s) declared no potential conflicts of interest with respect to the research, authorship, and/or publication of this article.
Funding
The author(s) disclosed receipt of the following financial support for the research, authorship, and/or publication of this article: This research was supported by a grant from the Education Research Conferences Program of the American Educational Research Association.
Authors
F. CHRIS CURRAN, PhD, is an associate professor and director of the Education Policy Research Center at the University of Florida. His research focuses on enhancing equity in education through the study of school safety, discipline, and early childhood policy.
LELYDEYVIS BOZA, BS, is a doctoral student and graduate research assistant in Educational Leadership and Policy at the University of Florida. Her research focuses on the inequities faced by Latina/o/x students in K–12 and the role activism can play in their self-advocacy.
KATHARINE HARRIS-WALLS, MEd, is a doctoral student and graduate research assistant in Educational Leadership and Policy at the University of Florida. Her research focuses on issues of equity in education including test score disparities in math and science and opportunity hoarding.
TIFFANY S. TAN, BS, is a doctoral student and graduate research assistant in Educational Leadership and Policy at the University of Florida. Her research focuses on the experiences of preservice and in-service teachers of color, specifically in the areas of retention and recruitment.