
Abstract
School boards are central to local education policy and governance in the United States. Given their localized nature, the methods of electing school boards vary widely. Most boards are elected on a nonpartisan basis—where candidate partisan affiliation does not appear on the ballot—but in some states, there has been a shift toward partisan elections. Our paper focuses on North Carolina, where a sizable fraction of districts has recently shifted to partisan elections. Using a difference-in-differences approach, we find that partisan elections affect the partisan, racial, and gender composition of boards. We then explore impacts beyond politics, testing for changes in school and student outcomes.
In most districts across the country, school board elections are nonpartisan, meaning that candidates do not run in affiliation with a political party and their party is not indicated on the ballot. That approach is an artifact of Progressive Era reforms aimed at insulating local education governance from national politics (Adrian, 1952). Recently, however, a growing number of districts have shifted to partisan school board elections, raising questions about how electoral rules influence not just who gets elected but also the policies school boards pursue. In North Carolina, where our study is set, the number of districts holding partisan elections has more than doubled over the past two decades, from 14 out of 115 districts in 2000 to 36 by 2021. We examine whether these shifts in election structure have altered board composition and student and teacher outcomes.
Methodologically, we take advantage of the fact that a large number of school districts in North Carolina have shifted from holding nonpartisan to partisan school board elections in recent years; we can therefore provide causal estimates of shifting to partisan elections in a difference-in-differences (DIDs) framework. We first test the impacts of partisan elections on political outcomes: namely, whether partisan elections alter the composition (party, but also race and gender) of candidates elected. We then turn to impacts on policy outcomes, focusing on personnel outcomes, such as teacher turnover within impacted districts, and school-level outcomes, such as the share of students achieving at grade level.
Theoretically, the shift to partisan elections may have little impact if candidates already run as partisans, even if their affiliation is not listed on the ballot. And there is some anecdotal evidence of that; for example, in Wake County, North Carolina, school board elections are nonpartisan, but in 2024, “[e]very school board race but one features a Wake Democrats[. . .]-endorsed candidate running against a Wake Republicans[. . .]-endorsed opponent.” 1 On the other hand, if candidates do not run clearly as partisans or if voters are not aware of their messaging on that front, the shift may lead voters to choose candidates of their own party, rather than choosing candidates based on expertise, experience, or any other preferred candidate characteristic, which in turn may impact both the composition of boards and the resulting policy outcomes. We find stronger evidence of the latter. Specifically, our main results are as follows:
The shift to partisan elections increases the likelihood that a Republican candidate is elected, but that result is largely driven by elections in Republican-leaning counties.
Considering other aspects of representation, the shift to partisan elections negatively impacts the likelihood that a female or Black candidate wins. This appears to be explained by candidates’ partisan affiliation (the increased likelihood of Republican victory).
Partisan elections are associated with an increase in the rate of students suspended or expelled and a suggestive decrease in student test score growth. We do not observe consistent evidence of changes in teacher turnover or composition, nor district spending patterns.
Our paper offers some of the only evidence that we are aware of on how partisan elections (vs. nonpartisan elections) shape school board composition and policy outcomes, and it does so in an environment that allows us to provide causal evidence on these questions. In short, our paper provides new evidence documenting that how school boards are elected matters for who is on the board and for outcomes in schools.
Relevant Prior Work
Our paper poses two (linked) empirical questions: (a) Do partisan (vs. nonpartisan) elections change the composition of school boards? And, (b) do partisan elections impact student and teacher-level outcomes within impacted districts? These questions are linked in the sense that the main channel through which we expect that partisan elections impact student and teacher-level outcomes would be through changes in who is on the school board. With that in mind, we first note that—independent of whether a school board uses partisan or nonpartisan elections—there is strong evidence that who is represented on school boards has important impacts on outcomes within school districts. Macartney and Singleton (2018) study the impacts of partisan composition of school boards in North Carolina, and—in a regression discontinuity framework—find that the addition of a Republican member is associated with an increase in within-district segregation. Kogan et al. (2021) find that increased nonwhite representation on California school boards increases both the share of nonwhite principals within the district and increases test scores for nonwhite students. Lastly, Shi and Singleton (2023) find that the election of teachers to school boards in California leads to increases in teacher salaries but no increases in student outcomes.
Thus, we argue that it is reasonable to expect that student and teacher outcomes may change in response to partisan elections if partisan elections change the composition of elected board members. There is limited evidence on that question in the context of education, which is a key contribution of our paper. One important exception is the work of Crawford (2018), who conducts a survey and finds that school board members elected through nonpartisan elections are more polarized than partisan-election counterparts. He suggests, as an explanation, that “candidates in nonpartisan elections may be more likely to signal their preferences because they lack a party label to do it for them” (Crawford, 2018). This highlights a channel and a potential desire of school board candidates, even in nonpartisan elections, to connect with partisan-aligned voters. On the other hand, Hess and Leal (2005) study how a variety of contextual factors, including the usage of partisan versus nonpartisan elections, are correlated with the nature of school board campaigns. They find little relationship between the use of partisan elections and total campaign expenditures or interest group activity to support campaigns. That does not rule out that partisan elections shape the composition of who is elected, but it does suggest that partisan elections play a smaller role in the nature of school board campaigns than one might expect. 2
All of that being said, while there is relatively limited evidence on the impacts of partisan versus nonpartisan elections for school boards, there is a literature on partisan versus nonpartisan elections for other offices that is informative for our paper. A core question is whether partisan elections change the partisan composition of elected officials, in particular—which is one dimension of board composition that we consider. That returns to a core issue we posed in our introduction: if candidates run as partisans even in nonpartisan elections, the shift in election type may have no impact on who is elected. Existing work has addressed that question in the context of elections for mayor (Schaffner et al., 2001), city council (Welch & Bledsoe, 1986), and state courts (Bonneau & Cann, 2015; Squire & Smith, 1988). Some of this work finds that nonpartisan elections weaken the link between voters’ partisan affiliation and candidate choice, while others show that even minimal partisan cues in nonpartisan elections (e.g., party endorsements) can prompt voters to revert to party-aligned choices. Overall, the evidence from other offices is mixed on whether nonpartisan election rules meaningfully alter the partisan composition of elected officials.
The existing literature from outside of the context of school boards also addresses whether partisan elections impact behavior or performance of elected officials. We briefly discuss this work in part because it points to another channel through which partisan (vs. nonpartisan elections) may shape student and teacher outcomes. Theoretically, in partisan elections, voters may choose preferred candidates solely based on partisan alignment; in nonpartisan elections, voters may instead select candidates on the basis of their expertise or experience for the position (Ash & MacLeod, 2020; Lim & Snyder, 2021). In studies of judicial elections, both Lim and Snyder (2015) and Ash and MacLeod (2020) find that the adoption of partisan elections impacts voter choice and also leads to the election of judges who are judged by peers to be less qualified or are less productive. If these results extend to school boards, we would expect that partisan elections are associated with worsened outcomes within school districts (increased teacher turnover and, in the longer run, declines in student outcomes). However, the judicial context is very different from the school board context, so it is not ex ante clear that the same patterns would hold.
On the other hand, partisan elections may lead to increased policy responsiveness, due to greater attention from voters (Schaffner et al., 2001; Squire & Smith, 1988). Outside of school boards, but still in the realm of local governing bodies, Tausanovitch and Warshaw (2014) study how a variety of electoral institutions at the local level—including partisan elections—impact policy responsiveness of municipal governments. Municipal governments find similar patterns of responsiveness across cities with partisan and nonpartisan elections.
To synthesize the above: there are therefore (at least) three potential channels through which partisan elections may impact school and district-level outcomes. If voter attention effects dominate (i.e., if partisan elections lead to great policy accountability), we may expect an improvement in measures such as teacher turnover, student test scores, and student discipline with partisan elections. That could occur even if the observable composition of boards does not change. If, on the other hand, effects of elected official expertise dominate (like in the referenced research on judicial elections), those outcomes may erode with partisan elections. And, finally, as documented in some of the first works described in this section, a variety of dimensions of board member identity (partisan affiliation, race/gender, etc.) are related to board policymaking and student/teacher outcomes. If school boards change along these dimensions (which we directly test), based on the existing recent empirical work, we may expect that partisan elections change student and teacher outcomes in ways that are contingent on how partisan elections reshape board composition. We note that this final channel is largely distinct (but not necessarily mutually exclusive) from the “expertise” channel, but that we will not be able to disentangle these two channels empirically.
Policy Context: School Boards in North Carolina
School Board Duties and Additional Details on Election Administration
School boards in North Carolina have wide-ranging duties to manage all aspects of local public school finances, personnel matters, and policy. The North Carolina School Board Association notes that “[c]reating an exhaustive, detailed list of a local board of education’s duties would be an overwhelming task,” but it summarizes five primary duties of boards in the state as follows: “(1) Providing every child with the opportunity to receive a ‘sound basic education’ during a minimum of 185 days or 1,025 hours of instruction covering at least nine calendar months; (2) Setting educational policy within the limits of its authority and overseeing the implementation of its policies and the state’s educational program; (3) Making decisions about the superintendent’s personnel recommendations; (4) Managing the financial affairs of the unit; and (5) Providing adequate school facilities.” 3
More broadly, school boards are responsible for setting the overall vision for public education in their districts and establishing goals, performance standards, and accountability measures to support that vision; while superintendents and staff handle day-to-day operations, boards are charged with policymaking and oversight on issues ranging from curriculum to budgeting to district leadership (Land, 2002). That role has put school boards at the center of locally managing contentious, nationalized issues; that has been especially true in recent years, with local school boards at the center of debates and decision-making on critical race theory (and race/ethnicity in the curriculum more generally), LGBTQ issues, and responses to the COVID pandemic (Kitchens & Goldberg, 2024; Shah et al., 2024).
School board elections in North Carolina mostly occur in November of even years. However, school board election timing and institutions are not uniform across the state; roughly 29% of the elections in our sample occur earlier in the year (in the spring) and a smaller share occur in odd years (7%). We control for election timing in all analyses. Seventy-eight percent of the contests in our data are for a single seat; the remaining elections are filling multiple (2–5) seats.
Movement from Nonpartisan to Partisan School Board Elections in North Carolina
As noted in the introduction, as of the year 2000, 14 of the 115 districts in North Carolina held partisan school board elections. No additional districts shifted to partisan school board elections until 2011. Between 2011 and 2020, 26 districts did so, and by 2024, more than 50 school boards in the state will be elected in partisan elections according to current legislation. This is an important change in the education landscape with implications that are not yet well understood.
In North Carolina, shifts to partisan school boards are not decided within the districts themselves but are instead acts of the state legislature. Although North Carolina is considered a swing state in presidential elections, the state legislature has been heavily Republican since 2010. The shift to partisan elections has largely been pushed by Republican members of the legislature. 4 In 2015, a bill for all school board elections in the state to be partisan failed to gain sufficient traction in the state legislature, and the subsequent shifts to partisan elections occurred through “local bills,” which are bills affecting few counties that—while voted on by the legislature—do not need to be approved by the governor.
Press accounts generally note that Republicans in the state argue that a shift to partisan elections would give voters a clearer picture of candidates’ ideological positions, while they note that Democrats in the state are generally opposed to the shift and express concerns that partisan elections will lead voters to vote along party lines and exacerbate polarization within school boards. 5 In reporting from a local news station in Raleigh, one Democratic state representative is quoted as saying that Republicans’ efforts to move to partisan elections “[. . .] is sort of like a power grab. [. . .] All of the bills that are being put forth are being put forth by the leading party, and we know that there is an effort nationwide to make all local elections partisan.” They go on to note that a Republican lawmaker who introduced one such bill disputes that view. 6
In similar reporting, but focused on Cabarrus County’s first partisan school board election in 2024, a Republican candidate argued that the partisan elections “helped people identify candidate values.” Another Republican candidate argued that voters “do their homework” and “[s]o I don’t think it changes a ton.” A Democratic candidate, meanwhile, argues that “[the partisan election] pulls us from the real issues and all uniting behind our kids and fighting for common interests.” 7
Finally, while our paper is focused on North Carolina, we note that there are other states where at least some districts use partisan elections for the school board. 8 Moreover, at the time of writing, Republican state legislators in Indiana are promoting legislation that would allow for partisan school boards in that state. Many of the same arguments made by Republicans and Democrats in North Carolina are being echoed in current debates on the topic in Indiana. 9
Methods and Data
We estimate stacked DIDs models, leveraging shifts from nonpartisan to partisan school board elections in North Carolina. We study two main sets of outcomes: school board composition and political outcomes (candidate- and election-level) and policy outcomes (school- and district-level). Our primary focus is on the latter—education policy-related outcomes—but understanding the effects on school board composition and political outcomes is necessary for understanding downstream changes to education outcomes initiated by school boards. We have data on political outcomes from 2010 through 2020, and we have data on policy outcomes from 2006 through 2020—though many outcomes within the data are available only for a subset of these years.
The “stacked” DIDs approach (Cengiz et al., 2019) groups units (in this case, school districts) based on the year that treatment begins (referred to generally in this paper as “treatment year groups” or just “groups”). In our setting, “treatment” is the switch to partisan elections. The approach then creates panels of data for each of these groups. To create each panel, a window of time around the treatment year is selected; in our case, we take 4 years before and after the treatment year. Each panel consists of only the units treated in that year and units not treated within a window around that period. In our case, we take a window of 4 years before and after the treatment year. For example, districts that switched to partisan elections in 2014 are grouped and separated into a panel consisting of data years 2010 to 2018 for school districts treated in 2014, plus, as control units, those not treated at all (until after 2018 at the earliest).
The panels, each of which are clean non-staggered treatment DID setting, are then “stacked” to allow for a single regression to aggregate effects across all of the panels. The specification used in the “stacked” dataset is identical to a simpler two-way fixed effects difference-in-differences (TWFE-DID) approach, except that time and unit fixed effects are interacted with dummies indicating the distinct panels, defined by treatment year. Thus, identification stems from comparisons within each panel so that treated units are only being compared to “clean”—not previously treated and not soon-to-be-treated—controls. Because many of our specifications include interactions between treatment and other variables (e.g., candidate partisan affiliation), we further interact “treatment group” identifiers with any interacted variables. Finally, in the stacked DIDs estimates, we cluster standard errors at the district-by-treatment group level.
School Board Composition and Political Outcomes
Our first section of analysis considers the effects of switching to partisan school board elections on the candidate pool and voter turnout. In nonpartisan elections, many individuals may be nominated to be on the ballot. However, in partisan elections, each political party may decide to nominate only one candidate. This would reduce the size of the candidate pool. The partisan composition of the candidate pool may also change if Republicans or Democrats become more or less likely to run when their partisan affiliation is advertised to voters on the ballot. For example, a Democratic candidate may be less likely to run in a heavily Republican school district after a switch to partisan elections if they think the switch to partisan elections eliminates any chance of electoral success. Switching to partisan elections may also affect the gender, race, or incumbency composition of the candidate pool. Voters may also respond to the switch to partisan elections by increasing or decreasing their likelihood of voting. For example, a voter who is not engaged with local school issues may not vote in a nonpartisan school board election, as they are unfamiliar with the candidates’ positions. However, if they know the partisan affiliation of the candidates, they may use this extra information to infer the candidates’ positions and therefore feel more confident about selecting a candidate who is more likely to be aligned with their preferences, increasing their likelihood of voting.
To formalize the setup, we estimate the following stacked DIDs specification, where the outcome of interest Ydtg (e.g., the number of candidates or total votes per capita) for district d, year t, and treatment-year group g is regressed on an indicator for whether the district’s school board election in year t is partisan:

where δ dg are district fixed effects within treatment-year group g and τ tg are time fixed effects within treatment-year group g. The subscript g therefore indexes the treatment cohort (or “stack”) to which each observation belongs. β1 is our coefficient of interest, capturing the impact of shifting to a partisan election.
Estimates from this model tell us how switching to partisan elections affects electoral inputs. The education policies we are ultimately interested in analyzing, though, are more directly affected by electoral outputs: the results of school board elections. Our second section of analysis considers the differential impacts of partisan elections on school board composition, in particular, candidates with different characteristics (party, race, gender). For instance, we test whether, at the candidate-level, a shift to partisan elections has a differential impact on the electoral success of Republican candidates relative to Democratic candidates. (If not, it suggests that partisanship was already built into the nominally nonpartisan elections that had been in place.) To do so, we require data on candidate-level election outcomes as well as on candidate characteristics.
We obtain school board election returns from the North Carolina State Board of Elections (NCSBE) website. The data report candidates’ names, the office they were running for, vote totals, and—after 2014—the number of seats being filled and whether the candidate in question won. The data only report candidates’ partisan affiliation if the election was partisan.
Data prior to 2014 do not indicate whether a candidate won. School board elections often fill multiple seats with a single race; the data prior to 2014 also do not list how many seats are being filled. However, separate data on candidate filings are also available from the NCSBE website list the number of seats to fill for each contest. With the combination of these datasets, we can identify which candidates were ultimately elected.
To identify candidates’ partisan affiliation regardless of whether they ran in a partisan or nonpartisan election, we draw on North Carolina Voter Registration files (also from the NCSBE website). The voter files list the universe of registered voters in the state. We match candidates from the election returns to the voter files by name and location. 10 From the data, we obtain the partisan affiliation, as well as the race and gender, of candidates.
Of 3,927 total candidate-year observations, only 442 (roughly 11%) are left with no information about partisan affiliation; this would occur for candidates running in nonpartisan districts who we were unable to match to the voter files. Of candidates with partisan information, both from election returns and voter files, the partisan affiliation matches in 89% of cases.
Supplemental Table A1 (available in the online version of this article) summarizes school board candidate characteristics across our sample but also splits by districts that ever or never employ partisan elections. The table also summarizes characteristics of counties, split in the same way, drawing on data on registered voters in North Carolina.
With these data, a baseline estimating equation takes the following form:

where Wincdtg is a dummy variable equal to 1 if candidate c (in district d, in election year t, and treatment-year group g) wins, and 0 otherwise. δ dg and τ tg are district and year fixed effects defined within treatment-year group g. 11 Partisandt equals 1 if the district’s election in period t is partisan, and 0 otherwise. β1 is therefore our main DID coefficient of interest, estimating the causal effect of adopting partisan elections.
However, the equation above does not test for differential effects of partisan elections by different candidate characteristics, and therefore cannot answer whether partisan elections drive differential support for candidates based on partisan affiliation. To answer that our estimating equation is:

Note that when we define a candidate as a Republican, as in this equation, we employ a two-party definition; thus, Republican in this equation equals 1 if the candidate is a Republican, and equals 0 if the candidate is a Democrat. Thus, β1 identifies the causal effect of partisan elections on Democratic candidate success. β2 identifies the differential causal effect on Republicans. If partisanship is already built into nonpartisan elections in this setting, we would expect β2 = 0; that is, partisan elections should not change the baseline difference between Democrat and Republican candidates’ success.
We also include specifications where instead of interacting Partisan with Republican, we interact it with race, gender, or incumbency information.
Finally, in some specifications, to account for differential partisan success driven by higher ticket races in a given election cycle, we interact our time fixed effects with Republican. We also include candidate characteristics, namely race, gender, and incumbency, in some specifications.
Finally, we primarily report results from stacked DIDs models, as numerous authors have recently highlighted that TWFE-DID estimates can be biased in an environment with (a) staggered rollout of treatment (as in our setting) and (b) heterogeneity in dynamics of treatment effects (which is reasonable to expect in our setting; Baker et al., 2022; Goodman-Bacon, 2021). The central problem with the standard TWFE-DID with staggered treatment rollout is that already-treated units serve as controls for later-treated units, which can lead to violations of parallel trends. That being said, for completeness, we report results for the more basic TWFE-DID in the online appendix, which yield generally similar results.
Policy Outcomes
Estimates from the models above establish the extent to which switching to partisan school board elections affects the partisan affiliation of elected school board members. But do changes to school board composition affect local short-run education policies and outcomes? To answer this, we draw on data from the North Carolina Department of Public Instruction’s School Report Cards. 12 As the name suggests, these are data compiled by the state so that they can report information about school quality to interested North Carolinians on their School Report Card website. The data report a variety of school- and district-by-year level measures. We focus on a subset of measures that are of theoretical interest and that have wide coverage during our sample period; unfortunately, some of the available measures do not cover a sufficient number of years to be useful to us. Specifically, we draw on measures in four categories:
Teacher-related measures: teacher turnover, share of teachers with advanced degrees, share of teachers with at least 10 years of experience, and share of teachers with high evaluations. All are initially measured at the school-by-year level.
School management-related measures: principal turnover. Measured at the district-by-year level.
Student-related measures: Education Value-Added Assessment System (EVAAS) growth (test score year-to-year value-added measure), share of students who passed their end-of-grade (EOG) exam, share of students promoted to the next grade, and rate of suspensions and expulsions per 1,000 students. Initially measured at the school-by-year level.
Funding-related measures: log of per pupil expenditures, share of expenditures allocated to salary and benefits, and share of expenditures allocated to supplies and equipment. Measured at the district-by-year level.
School-by-year outcomes are aggregated to the district-by-year level in the empirical analysis (weighting by the relevant school size metric) to reduce noise and because that is the level of identifying variation. Results using school-level variation are qualitatively similar, but with two differences that we will note. Summary statistics of the education outcomes in 2014—the final year before any switches to partisan elections are observed in our study period—are provided in Supplemental Table A2 (available in the online version of this article). The first two columns compare school districts that have ever switched and school districts that never switched to partisan elections; the third column reports the overall mean. There are no striking differences in observable characteristics between “treated” and “control” districts.
On average, 16% of teachers turn over every year. We take teacher turnover as a potentially important proxy for teacher dissatisfaction with new policies implemented by the school board. However, we cannot rule out that any changes in teacher turnover are instead driven by changes in terminations of teachers initiated under a new school board. The additional teacher-related measures are aimed at assessing whether the composition of teachers changes (e.g., if teacher turnover increases, does the school systematically lose the most experienced teachers?).
School superintendency is another channel through which school boards may influence schools. The above teacher-level measures capture some channels through which school superintendents may effect change, but we recognize that “softer” dimensions, such as management approach and leadership style, that may be equally important but less quantifiable, are not reflected in this set of outcomes. Although we do not have data on school superintendents, one school management-level outcome we do observe is principal turnover. This outcome has some of the limitations of teacher turnover discussed above but provides another indicator of potential employee dissatisfaction, this time at the school management level. Ten percent of principals turn over every year.
We also test for impacts on test scores (EVAAS growth and percent passing the EOG exams). EVAAS growth is a scaled measure of school value-added that ranges from 50 to 100. Schools with scores between 50 and 70 are considered to have not met year-to-year test score growth expectations. We do not necessarily expect our treatment to immediately impact test scores, but changes in educational inputs (such as teachers and curricula) that occur as a result of school board policy changes may yield achievement effects in the time frame of our study. However, school boards do have broad control over disciplinary policy within school districts, and as such, we may expect more immediate impacts on disciplinary incidents.
Finally, school boards typically adopt and administer annual budgets, so we anticipate that partisan elections that affect school board composition may also impact school funding. We consider the three primary measures of school finances listed above.
For all of these outcomes, our main estimating equation is similar to Equation 2, except that analyses are at the district-by-year level.

We include district and year fixed effects, interacted with treatment year group. Standard errors are clustered at the district-by-treatment year group level.
Results
School Board Composition and Political Outcomes
First, we explore whether there are changes in the pool of school board candidates and voter turnout coinciding with the switch to partisan school board elections. Supplemental Table A3, model (1) (available in the online version of this article), shows that there is a decline in the number of candidates following a switch to partisan elections. This is to be expected given there are only two candidates competing for each seat in partisan elections—a Democrat and a Republican—when previously there may have been more than two candidates competing for each seat. Supplemental Table A3, model (2) (available in the online version of this article), reports the effect on votes cast per capita, a measure of voter turnout, revealing no effect. Supplemental Table A4 (available in the online version of this article) reports additional effects of the switch to partisan elections on candidate composition, showing a decrease in the share of Democratic candidates, an increase in the share of Republican candidates, and no compositional effects related to the gender, race, or incumbency of candidates. This could be a function of partisan elections having only one candidate from each party and Democrats being more likely than Republicans to run before the switch to partisan elections. Taken together, these preliminary findings point to the possibility that candidate composition may be a channel through which there are effects on candidate success and subsequent policy outcomes. 13
Second, we explore whether there are changes in school board electoral outcomes when there is a switch to partisan elections. Table 1 shows the results on whether partisan school board elections alter the party composition of the candidates who win the election, using a stacked DIDs approach. As stated in the previous section, TWFE-DID estimates are reported in the Supplemental Appendix (Table A5 in the online version of the journal) with similar findings. 14
Impact of Partisan Switch on Partisan Composition of School Boards (Stacked DID)

Note. This table reports estimates from stacked DIDs models. The unit of observation is a candidate-year. The outcome variable equals 1 if the candidate wins the election and 0 otherwise. Each column represents a regression model with a different set of controls. Standard errors are clustered at the district-by-treatment year group level. Robust standard errors in parentheses. DID = difference-in-difference.
p < .1. **p < .05. ***p < .01.
In circumstances where a partisan advantage exists for either party, how much of the predictive power of partisanship for election outcomes stems from partisan elections? Models (2) through (5) of Table 1 (and the same columns from Supplemental Table A5 in the online version of the journal) examine this question. Model (2) corresponds to Equation 3, where Partisan is interacted with Republican. We report the overall effect on a Republican candidate’s winning probability in partisan elections in the second-last row of the table (the row labeled Lin. Comb.), which is the linear combination of the estimated coefficients on Partisan and Partisan × Republican.
Based on the results of model (2), the shift to partisan elections increases the likelihood that a Republican candidate is elected. The differential effect is positive and statistically significant (0.588), providing evidence that the switch to partisan elections impacts Republican and Democratic candidates differently, with Republicans performing better, on average. Overall, Republican candidates’ winning probability is increased by 24.6 percentage points following a switch to partisan elections. The narrative holds when accounting for differential partisan success driven by higher ticket races in a given election cycle (model [3], which includes both district-party-group and year-party-group cohort fixed effects, where the group is the treatment cohort), when adding controls for the race and gender of the candidate (model [4], our preferred set of controls), and in a very rich specification controlling for both observed and unobserved candidate characteristics (model [5], which includes candidate fixed effects, but has the disadvantage of identifying effects using the smaller number of repeat candidates).
All of these conclusions hold under the TWFE approach (Supplemental Table A5 in the online version of the journal) as well, albeit with different magnitudes of estimates. Results are also robust to the inclusion of incumbency indicators (Supplemental Table A6 in the online version of the journal), although we have to construct incumbency indicators using matching, as they are not identified in the raw data, resulting in the loss of the first 4 years of data, in which it is not possible to identify incumbents. 15 We also draw similar conclusions from models at the election-level rather than candidate-level (Supplemental Table A7 in the online version of the journal). 16
Figure 1 displays the event-study estimates of shifting to partisan elections employing the stacked DID approach. Panel (a) shows the effect on winning elections for Democratic candidates; Panel (b) shows the differential effect on winning elections for Republican candidates relative to Democratic candidates. Given that there is a smaller share of observations in odd years, we estimate a variant of Equation 3 where we include indicator variables for whether candidate-level observations are 3 to 4 years before the switch to partisan elections, 0 to 1 years after the switch, and more than 1 year after the switch. These event-study estimates are relative to observations 1 to 2 years before the switch to partisan elections, the reference category. Our main motivation for conducting this analysis is to test for the presence of pre-trends, the possibility that winning probabilities for both or either parties were already trending before the switch to partisan elections. The pre-period estimated coefficients are not statistically different from zero in either of the panels, suggesting that pre-trends are not driving the observed impacts on winning probabilities from switching to partisan elections. Table 2 explores whether partisan elections alter the gender, racial, or incumbency composition of candidates elected in addition to affecting the party composition of candidates elected. In model (1), Partisan is interacted with an indicator variable for Black candidates, in model (2), Partisan is interacted with an indicator variable for female candidates, and in model (3), Partisan is interacted with an indicator variable for incumbent candidates. Note that these specifications include all the controls from our preferred model (3) in Table 1, including the relevant demographic characteristic of the candidate interacted with each set of fixed effects.
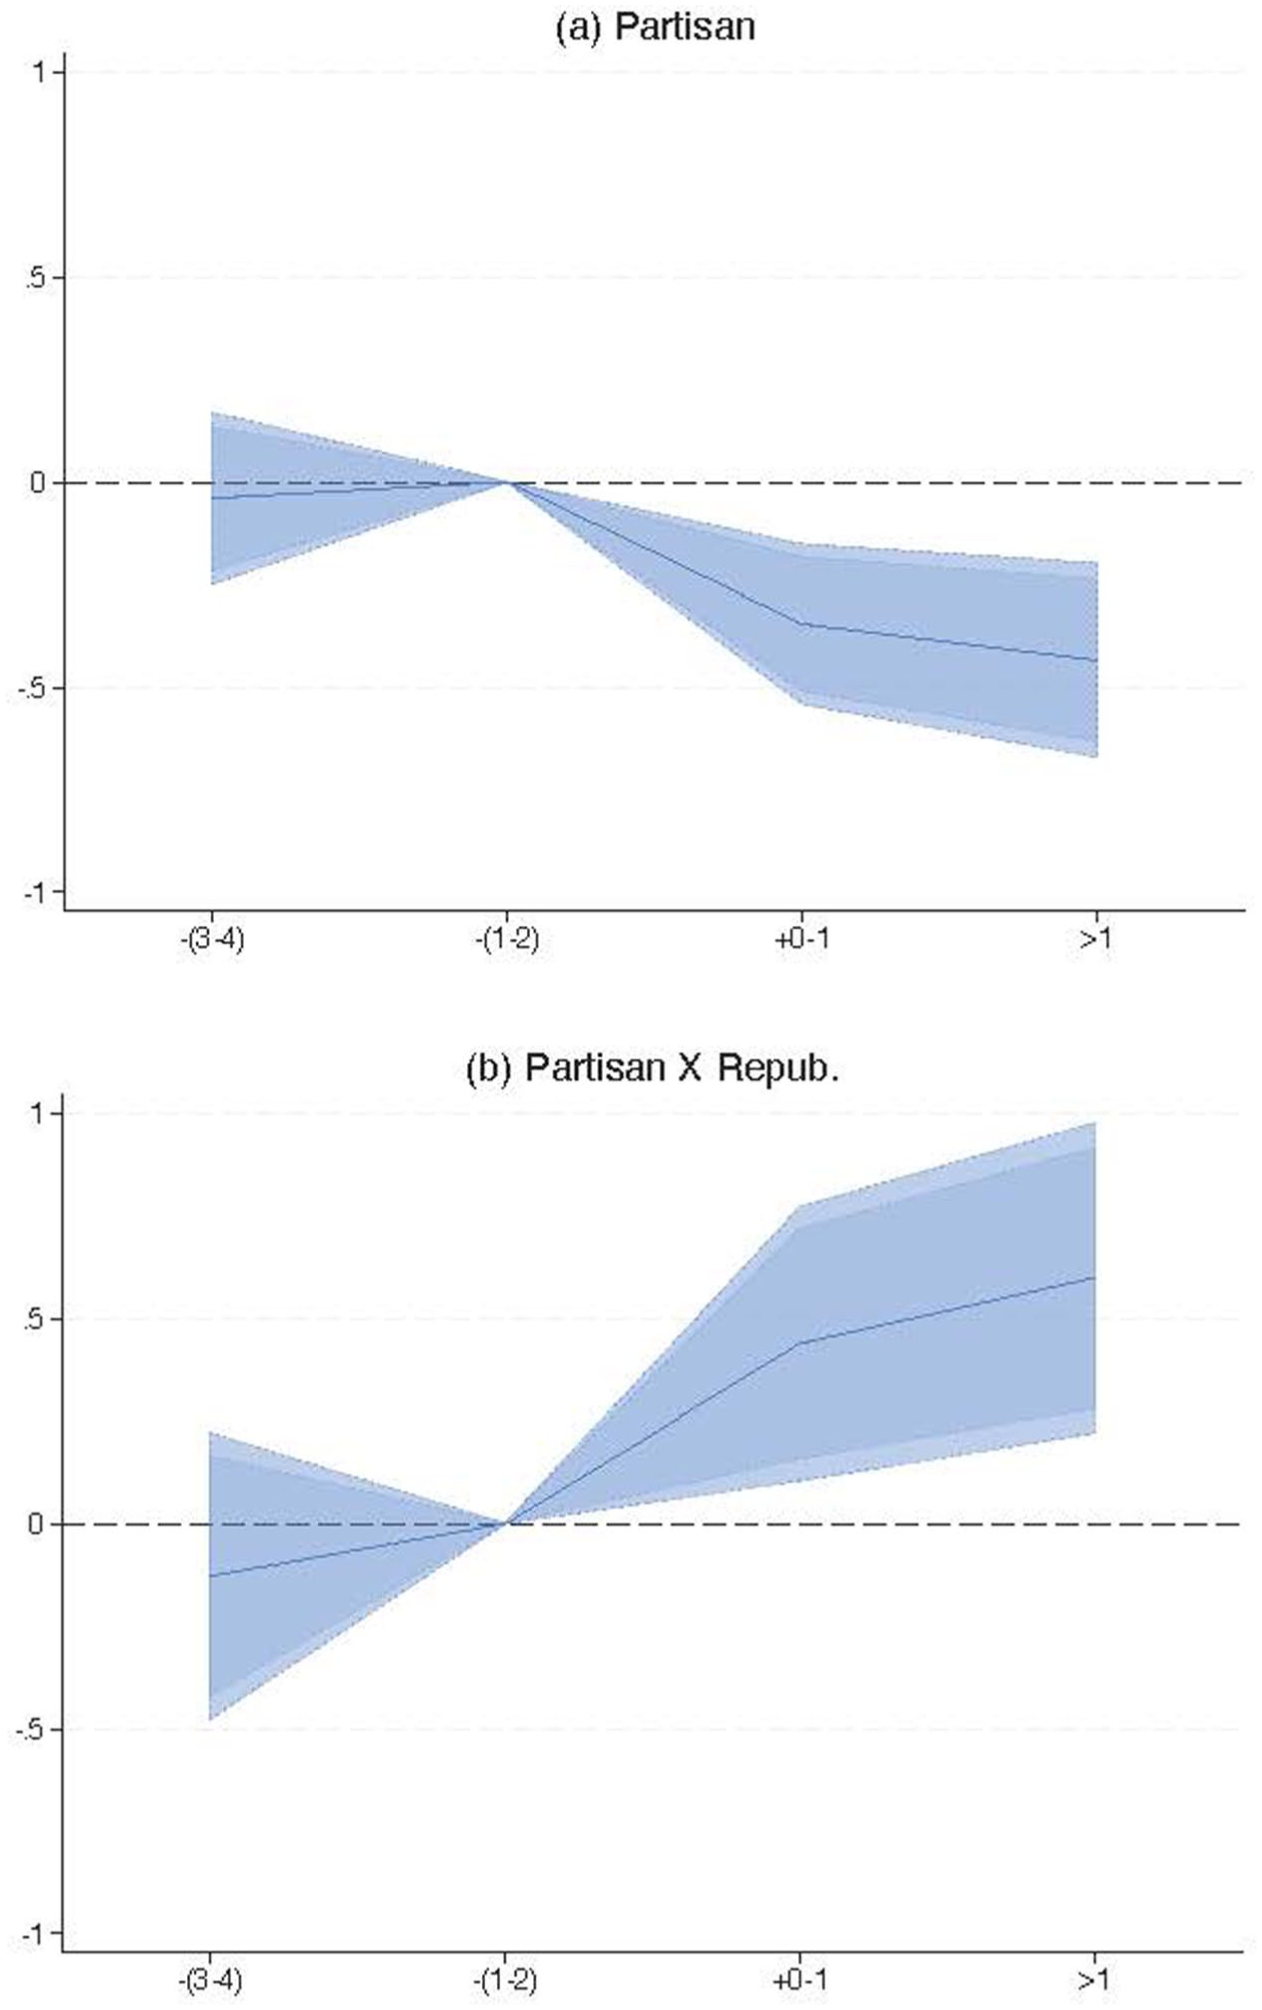
Event study: Impact of partisan switch on partisan composition of school boards (stacked DID). (a) Partisan and (b) Partisan × Repub.
Impact of Partisan Switch on Demographic Composition of School Boards (Stacked DID)
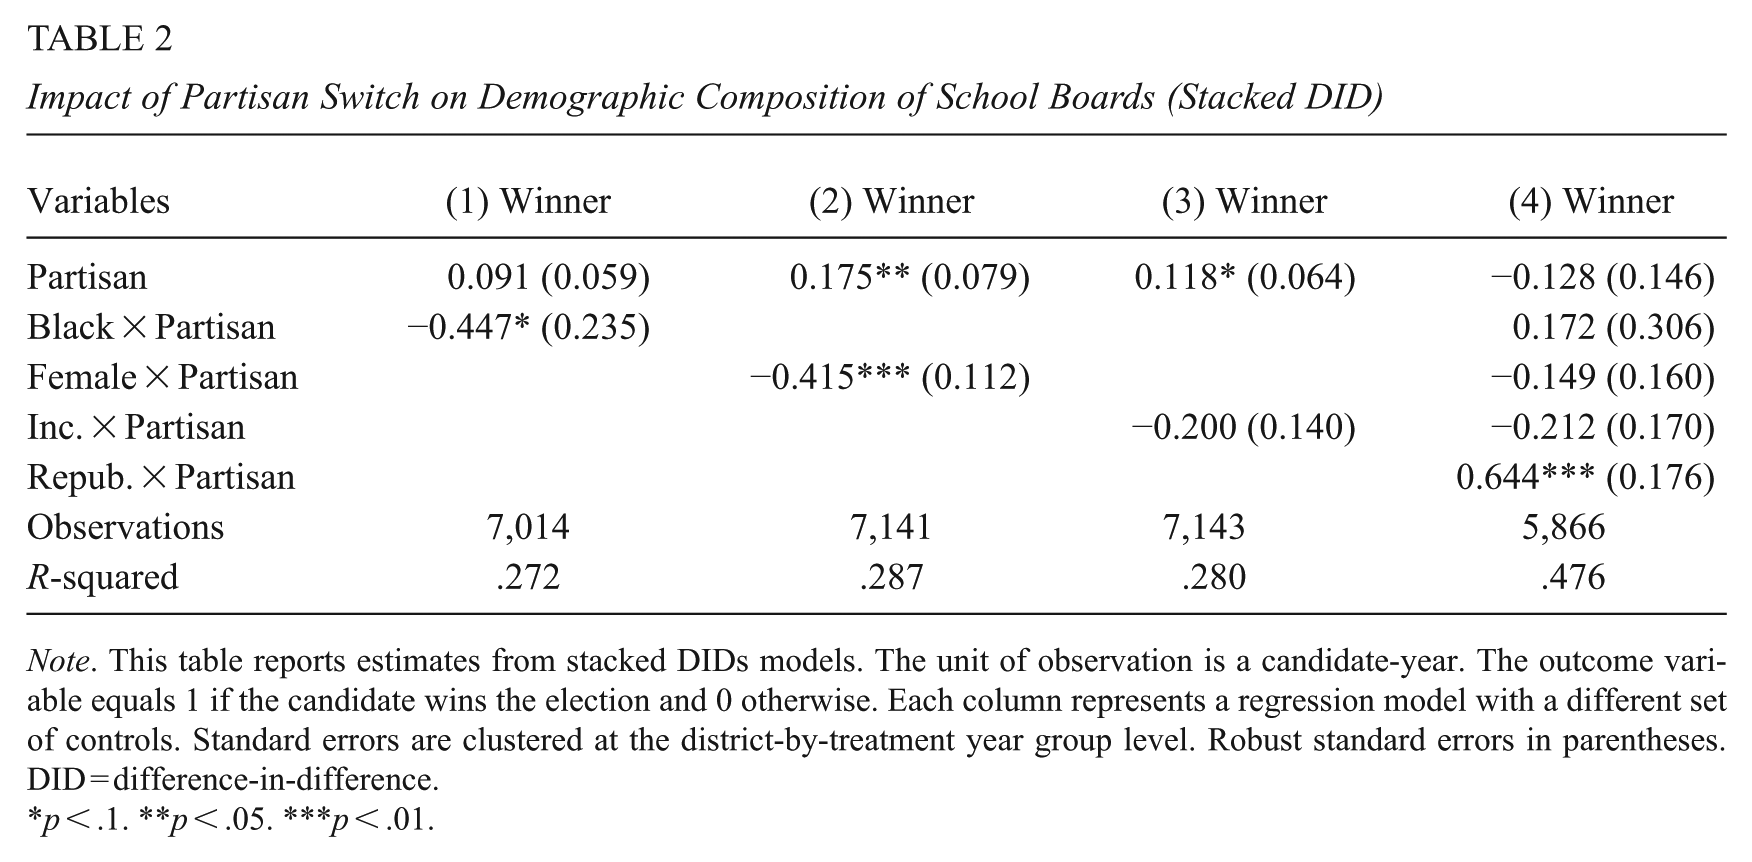
Note. This table reports estimates from stacked DIDs models. The unit of observation is a candidate-year. The outcome variable equals 1 if the candidate wins the election and 0 otherwise. Each column represents a regression model with a different set of controls. Standard errors are clustered at the district-by-treatment year group level. Robust standard errors in parentheses. DID = difference-in-difference.
p < .1. **p < .05. ***p < .01.
The coefficients on “Black × Partisan” and “Female × Partisan” in Columns 1 and 2 are large and negative, suggesting a decrease in Black and female candidate success under a partisan regime, but model (4) shows that the female and Black penalty are explained by candidates’ partisan affiliation. Still, it is important to highlight that the switch to partisan elections reduces the likelihood that female and Black candidates are elected, albeit via the penalty associated with running as a Democrat. It is also important to highlight that our estimates of the effects of partisan elections on partisanship are not alternatively explained by candidate race or gender, and the degree to which these are correlated with party. 17 The coefficient on the interaction “Incumbent × Partisan” is not significantly different from zero; the switch to partisan school board elections does not affect incumbency reelection rates.
So far, our results document that Republican candidates benefit when school board elections switch to partisan. There are two explanations for this: either there is genuinely an advantage for Republicans, or partisan elections benefit the locally dominant party, and that happens to be Republicans in a sufficiently large share of districts in our sample to dominate the overall effect. To probe this further, we examine if the switch to partisan elections generates an advantage to candidates in the local majority party, and Democratic candidates receive a similar boost in majority Democrat areas, or whether the positive effect for Republicans is constant throughout the sample.
To model this, we interact both Partisan and Partisan × Republican with indicators for whether the county (that is, geographically aligned with the school board) is majority Republican or majority Democrat based on shares of registered voters. 18 Figure 2 shows the results, with the left two coefficients corresponding to effects in Republican-leaning counties and the right two coefficients corresponding to effects in Democrat-leaning counties. 19
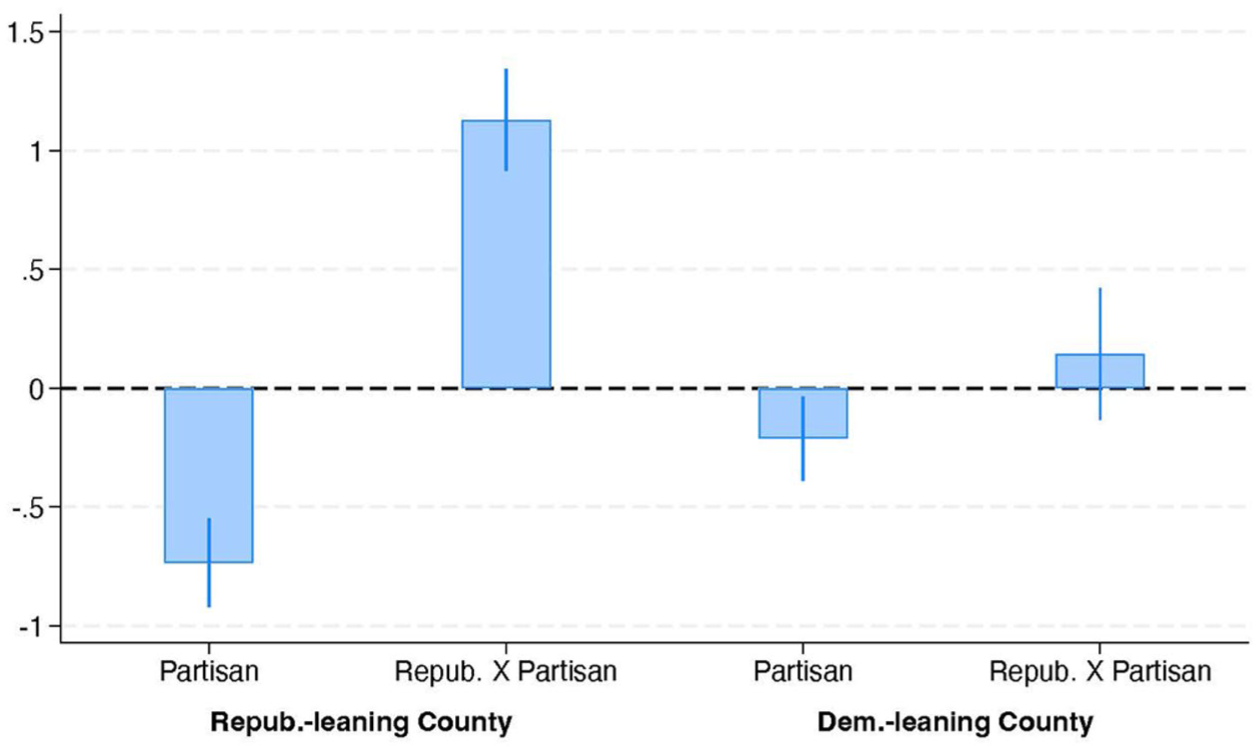
Impact of partisan switch on partisan composition of school boards (stacked DID)—split by partisan composition of county.
The results show that the effect we find above of Republican candidates receiving an increase in winning probability when elections switch to a partisan are amplified in Republican-leaning districts. There is a large penalty in such districts for Democratic candidates after a switch to partisan (first coefficient from the left) and a large positive differential effect for Republican candidates (second coefficient). This is consistent with candidates receiving a boost when they are part of the local majority party. 20
Finally, the effects of partisan school board elections may be a function of what other races are on the ballot that election cycle. In particular, effects may be amplified in presidential elections in which there is typically a higher turnout than in midterm (or off-cycle) elections. Supplemental Figure A3 (available in the online version of this article) splits results by election timing, showing that the Republican advantage in partisan school board elections is of a similar magnitude regardless of whether the school board election is coincidental with a presidential election or not.
Policy Outcomes
We have established that partisan school board elections favor Republican candidates in North Carolina during our study period. We now turn to reporting whether the higher likelihood of electing Republicans to school boards affects local education policies and outcomes. School boards have considerable power over personnel, both directly through hiring and firing, and indirectly through policies that affect the work environment and therefore personnel employment decisions. Our first set of policy outcomes relates to teacher and principal labor markets. Table 3 shows the results of a district-by-year level analysis of teacher-related outcomes. We find no compelling evidence of a change in teacher turnover, the share of teachers with an advanced degree or high experience, or the share of teachers receiving “high” evaluations. Not only are the estimated coefficients for these outcomes statistically insignificant, but their coefficients are also small in magnitude relative to the sample average of the outcomes (reported in the bottom row of Table 3). We note that models that use school-level rather than district-level variation suggest small increases in teacher turnover, but, taken together with these results, there is no clear evidence of an increase in teachers either voluntarily departing or being terminated in the 4 years after a switch to partisan school board elections and the resulting increase in Republican school board members. 21 Model (5) reports that there is also no effect of switching to partisan school board elections on principal turnover. It appears as if partisan elections do not, at least in the short run, have an effect on key aspects of local educator labor markets.
Impact of Partisan Switch on School-level Teacher Outcomes (Stacked DID)
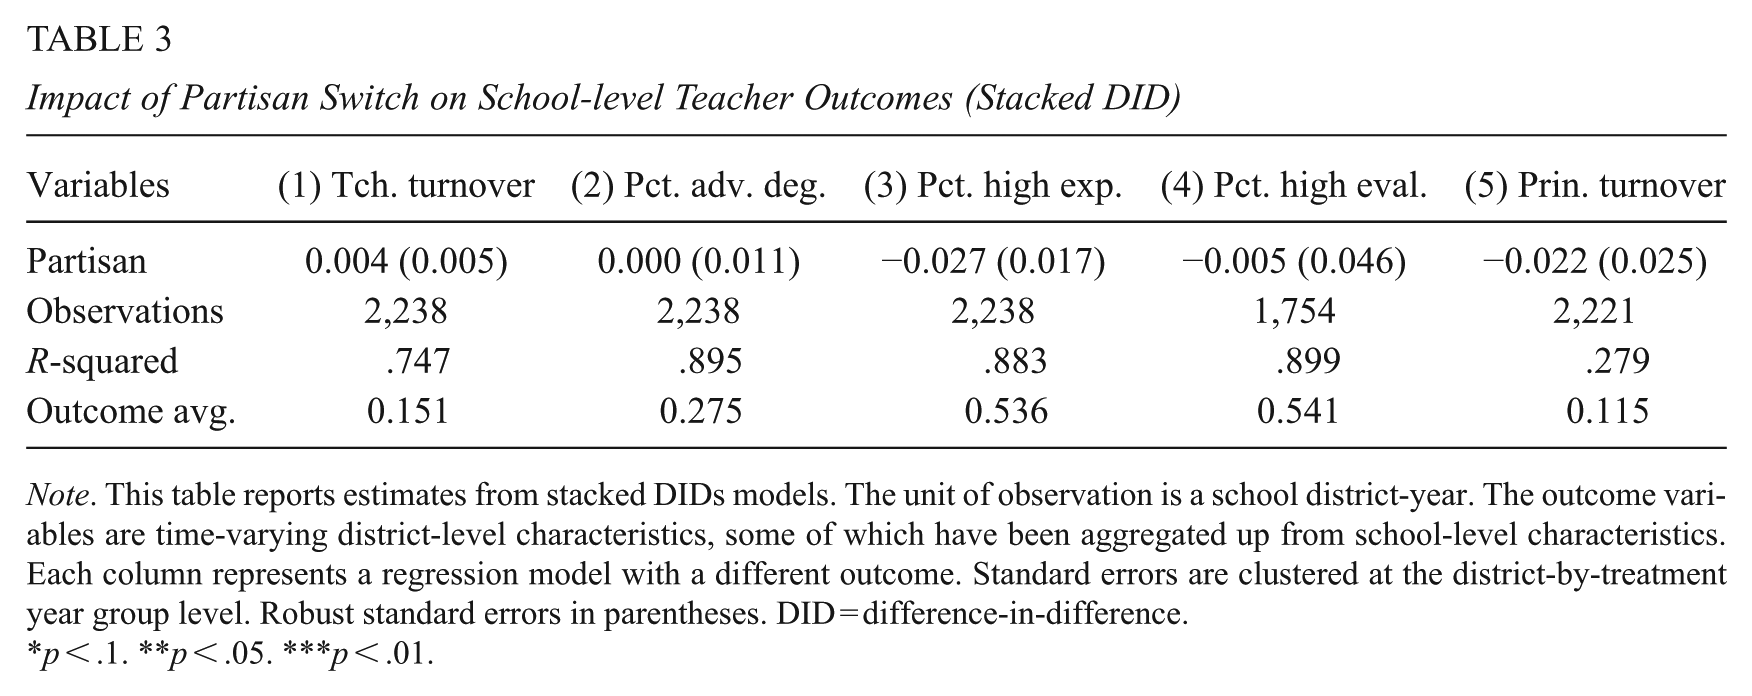
Note. This table reports estimates from stacked DIDs models. The unit of observation is a school district-year. The outcome variables are time-varying district-level characteristics, some of which have been aggregated up from school-level characteristics. Each column represents a regression model with a different outcome. Standard errors are clustered at the district-by-treatment year group level. Robust standard errors in parentheses. DID = difference-in-difference.
p < .1. **p < .05. ***p < .01.
School boards also make decisions related to the curriculum and the allocation of educational resources, such as textbooks, hardware, and software, and the extent to which additional resources are provided to subgroups of students based on need or other criteria. These factors, in addition to any changes in educator composition, may affect student achievement. Table 4 reports results of switching to partisan school board elections on student-related outcomes, also aggregated to the district-by-year level. To help interpret the magnitudes of effects, we include the sample average of the outcome variable in each column. There is a notable decline in mean EVAAS growth (value-added) across schools in an affected district; we observe a 3.617 unit decline relative to a sample average of 77.6—representing about one-third of a standard deviation. We observe no statistically significant effect on the share of students passing their EOG exams or the share of students being promoted. We present this with the caveat that models using school-level variation do not find a statistically significant effect on test scores, so, taken together, we interpret these findings as providing suggestive evidence of a decline in academic achievement in the years after a switch to partisan school board elections, but that it is not of sufficient magnitude and precision to affect grade progression rates.
Impact of Partisan Switch on School-level Student Outcomes (Stacked DID)
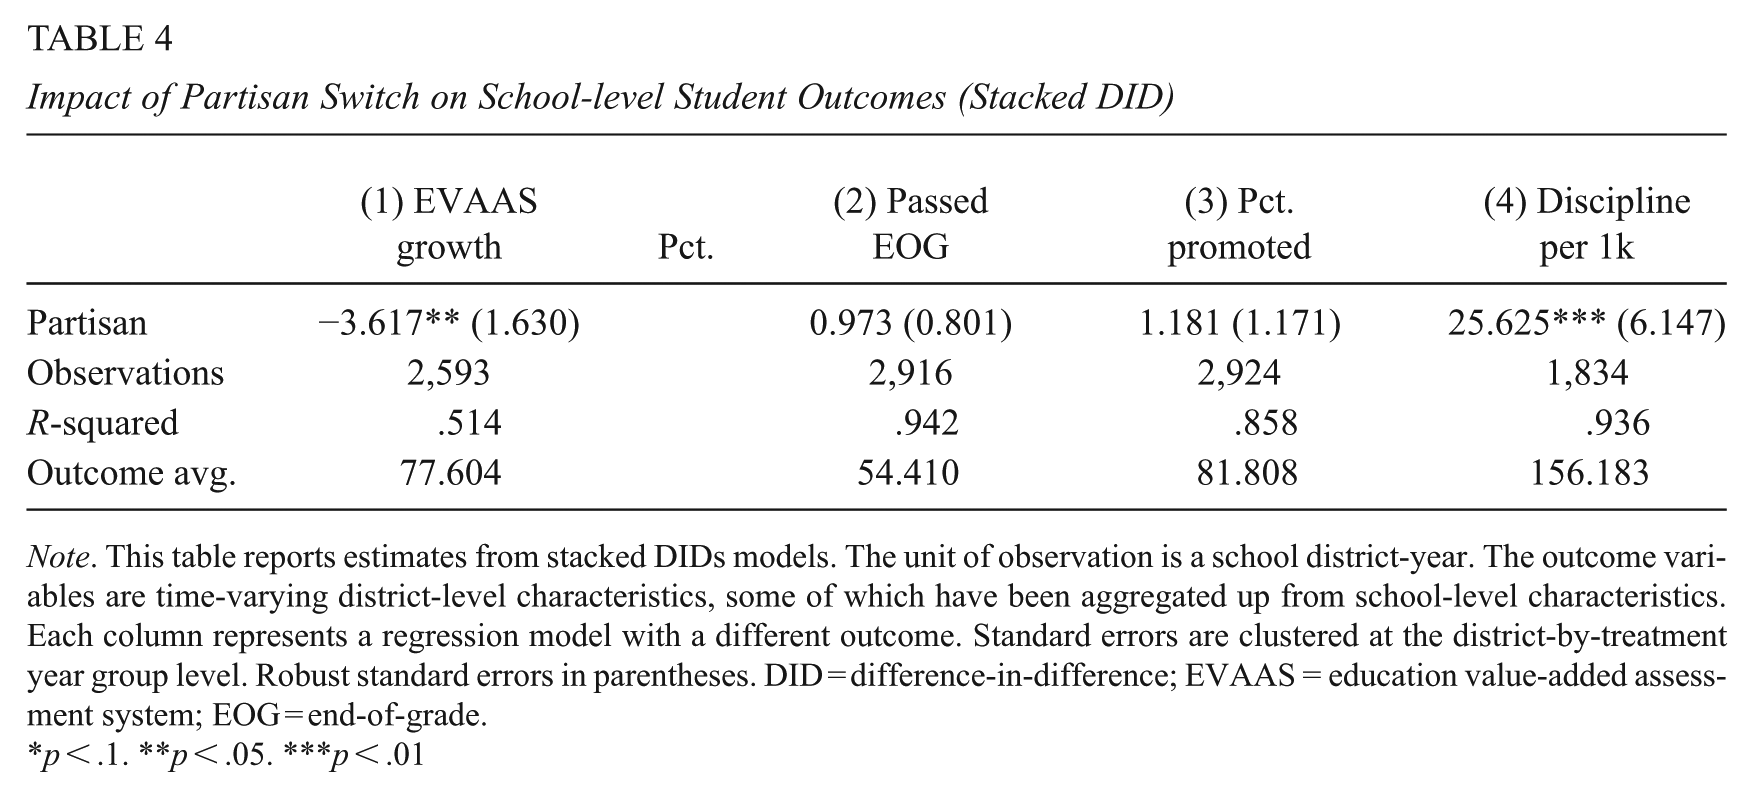
Note. This table reports estimates from stacked DIDs models. The unit of observation is a school district-year. The outcome variables are time-varying district-level characteristics, some of which have been aggregated up from school-level characteristics. Each column represents a regression model with a different outcome. Standard errors are clustered at the district-by-treatment year group level. Robust standard errors in parentheses. DID = difference-in-difference; EVAAS = education value-added assessment system; EOG = end-of-grade.
p < .1. **p < .05. ***p < .01
We do, however, observe an increase in the use of exclusionary discipline: the rate of suspensions and expulsions increases by 26 (per 1,000 students)—approximately a 15% increase relative to the mean. The higher likelihood of electing Republican candidates to school boards appears to have resulted in stricter rules related to school discipline, more enforcement of existing school discipline rules, or some combination of the two. This result is robust to a variety of specifications.
The above teacher- and student-related education outcomes are affected by school boards through the implementation of local education policies. The immediate effect on school discipline is consistent with newly elected school boards providing directives to school leaders that disciplinary infractions be treated more seriously, such as the introduction of zero-tolerance policies. Even with no change in student behavior, we could observe an immediate change in school discipline measures if the level of enforcement changes. Changes in other outcomes, such as the more suggestive effects on test score growth documented above, are more likely to take time as policy changes filter through the local educational system. The corresponding event studies (more details below) indicate that test score effects first appear 2 years after the switch to partisan elections. Although still somewhat rapid, school boards can have immediate effects on staffing and other educational inputs, such as additional support services for low-performing or high-need students, that could reasonably affect test scores within this time frame.
School boards also approve annual budgets, and budgetary changes may be more immediate. We explore effects on school finance at the district-level in Table 5, focusing on three primary measures: per pupil expenditures, share of expenditures allocated to salary and benefits, and share of expenditures allocated to supplies and equipment. There are no statistically significant effects. And, again, the estimated coefficients are small relative to the sample average of each outcome (reported in the bottom row of Table 5). We observe that the increase in Republican representation on school boards because of partisan elections has no short-run effect on district-level spending.
Impact of Partisan Switch on District-level Funding (Stacked DID)
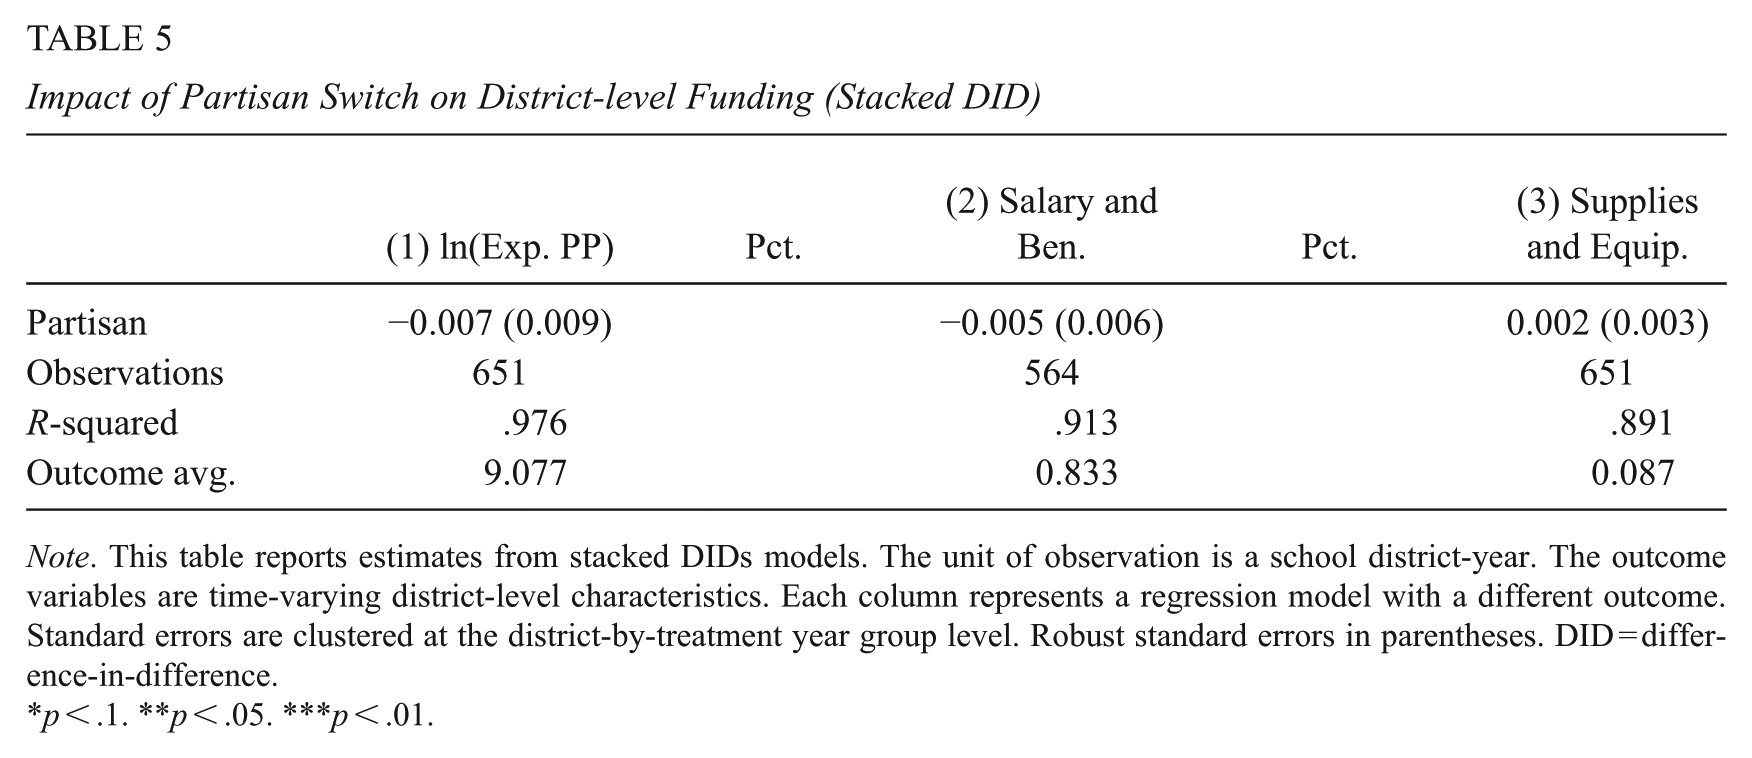
Note. This table reports estimates from stacked DIDs models. The unit of observation is a school district-year. The outcome variables are time-varying district-level characteristics. Each column represents a regression model with a different outcome. Standard errors are clustered at the district-by-treatment year group level. Robust standard errors in parentheses. DID = difference-in-difference.
p < .1. **p < .05. ***p < .01.
Our stacked DID models summarize the effect of switching to partisan school board elections using one parameter for each outcome of interest. Supplemental Figures A.4, A.5, and A.6 (available in the online version of this article) depict event study estimates for all of the education policy-related outcomes discussed above. These event studies serve two purposes. First, they allow us to check whether there are pre-trends in the outcomes of interest, and, second, they show whether there are notable dynamics in the treatment effects. Consistent with the stacked DID regression estimates, we consider 4-year windows around the switch to partisan elections. Outcomes are also available annually rather than every 2 years, as they were for the school board composition and political outcomes, providing more pre-treatment estimates.
In all panels of all three figures, there is very little evidence of pre-treatment trends. Switches to partisan elections are not predicted by trends in any of the reported educational outcomes. There were two statistically significant effects in the DID regression estimates discussed above: EVAAS (value-added) growth and disciplinary infractions. The event studies corresponding to these outcomes suggest that the switch to partisan election coincides with the beginning of a downward trend in value-added (Supplemental Figure A5, Panel [a]), while the increase in the rate of suspensions and expulsions is immediate, but then appears to fall back down (Supplemental Figure A5, Panel [d] in the online version of the journal).
In general, the effects on policy outcomes from the switch to partisan school board elections are not striking. However, we present these findings with the caveat that our analysis is limited by a relatively short time horizon and our focus on a subset of educational outcomes that are observable and quantifiable. Future studies considering a broader range of outcomes over a longer time period will paint a more detailed picture.
Conclusion
Our findings show that a shift from nonpartisan to partisan school board elections changes both who gets elected and how boards govern. In North Carolina, moving to partisan elections increases the likelihood that Republican candidates win school board seats, particularly in Republican-leaning counties. Because women and Black candidates in our setting are more likely to run as Democrats, this shift also reduces the likelihood that those candidates are elected. These changes in board composition are associated with increased use of exclusionary discipline, such as suspensions and expulsions, and suggestive changes in student test score growth. The latter of these, in particular, should be interpreted with some caution, as we do not find changes in some other related outcomes (e.g., percent of students passing EOG test scores or percent of students promoted to the next grade). One reason for that might be that many student-level outcomes may require a longer time horizon to be affected by changes in board policy than we study here.
Our findings have direct implications for education policy. School boards have received heightened attention for their role in local education policy in recent years; our paper documents how school boards are elected—which varies widely across the United States—has important implications for who is elected but also for student-level outcomes. On the first of these two points—who is elected—there is substantial evidence on other features of election administration (e.g., at-large vs. district-based elections; Abott & Magazinnik, 2020) and how they shape the composition of boards. Our paper adds evidence on partisan elections, in particular.
Second, in directly documenting impacts on students, especially in discipline outcomes, our results show that election administration impacts more than just politics—it also impacts local education policy. The question of how and whether students may be impacted by a change in local election administration is often absent from the debates that we reviewed in an earlier section. As noted, Democratic lawmakers in North Carolina and Indiana have argued for nonpartisan elections to avoid exacerbating polarization on boards and to keep the focus on local issues; Republican lawmakers have argued for partisan elections to allow voters to more immediately inform themselves of a candidate’s ideological positions. We were limited in the student- and teacher-level outcomes that we assessed; we therefore do not claim to provide a comprehensive account of the ways that students and teachers are impacted by partisan versus nonpartisan elections. We advance our evidence by documenting that election administration can filter down to student-level impacts and should be considered in debates around school board election structure.
In doing so, our findings contribute to the broader education policy literature on school board governance. Prior work has shown that the composition of school boards affects segregation (Macartney & Singleton, 2018), the representation of nonwhite administrators and student outcomes (Kogan et al., 2021), and teacher compensation (Shi & Singleton, 2023). Those important findings naturally raise questions about the policy levers that would impact who is on a school board. Our results complement that work by documenting one clear electoral institution that directly impacts board composition and carries the insights of the existing findings on representation by showing that those changes filter down to student- and teacher-level outcomes.
Supplemental Material
sj-pdf-1-epa-10.3102_01623737261432170 – Supplemental material for Partisan Versus Nonpartisan School Board Elections
Supplemental material, sj-pdf-1-epa-10.3102_01623737261432170 for Partisan Versus Nonpartisan School Board Elections by Andrew J. Hill, Daniel B. Jones and Breyon J. Williams in Educational Evaluation and Policy Analysis
Footnotes
Declaration of Conflicting Interests
The authors declared no potential conflicts of interest with respect to the research, authorship, and/or publication of this article.
Funding
The authors received no financial support for the research, authorship, and/or publication of this article.
Notes
Authors
ANDREW J. HILL, PhD, is a professor of economics at Montana State University. His research focuses on labor economics and the economics of education.
DANIEL B. JONES, PhD, is a professor in the School of Public and International Affairs at the University of Pittsburgh. His research is broadly focused on inequality in the United States, including the impacts of representation on mitigating inequality across groups.
BREYON J. WILLIAMS, PhD, is chief economist at Groundwork Collaborative. His research focuses on how policy and market structures shape economic opportunity.
References
Supplementary Material
Please find the following supplemental material available below.
For Open Access articles published under a Creative Commons License, all supplemental material carries the same license as the article it is associated with.
For non-Open Access articles published, all supplemental material carries a non-exclusive license, and permission requests for re-use of supplemental material or any part of supplemental material shall be sent directly to the copyright owner as specified in the copyright notice associated with the article.