
Abstract
The impact of uncertainty about item parameters on test information functions is investigated. The information function of a test is one of the most important tools in item response theory (IRT). Inaccuracy in the estimation of test information can have substantial consequences on data analyses based on IRT. In this article, the major part (called the adjusted term) of the deviation of an estimated test information function from the true test information function due to the uncertainty of item parameters was approximated asymptotically, and a simulation study shows that this approximation captures the difference between the estimated and the true information functions rather well. A real data example shows that the magnitude of an estimated adjusted term can be substantially large when a sample size is relatively small.
Keywords
1. Introduction
The information function of a test is one of the most important quantities in item response theory (IRT). The reciprocal of the test information function is the (asymptotic) variance of the maximum likelihood estimator of ability (Lord, 1980). The test information function is the sum of item information functions, which can be obtained from item response functions or models and their first derivatives. These IRT models contain both item and examinee ability parameters. When applied to analyze test item response data, a typical IRT procedure first estimates item parameters, then regards these estimates as the true values of item parameters in the subsequent statistical analyses (e.g., ability estimation, equating). However, in general, parameter estimators are subject to estimation errors (bias, variance, and covariance). The presence of estimation errors can be damaging to results from IRT-based analyses. Researchers in educational statistics and psychometrics are becoming more and more interested in this issue. Mislevy (1992) suggested an approximation for the variance of ability estimates under the Rasch model by Cohen’s closed-form approximation. Lewis (1985, 2001) incorporated the uncertainty regarding item parameters into expected response functions, which are the expectations of the original item response functions with respect to the posterior distributions of item parameters. This methodology was applied in various contexts (Mislevy, Sheehan, & Wingersky, 1993; Mislevy, Wingersky, & Sheehan, 1994). Tsutakawa and Soltys (1988) used a Bayesian method to approximate the magnitude of the statistical inferential errors based on the standard IRT procedure. Tsutakawa and Johnson (1990) studied the effect of uncertainty of item parameters on ability estimation and showed that the standard IRT practice of using maximum likelihood or empirical Bayesian techniques may underestimate the variance of estimated ability when a calibration sample is only moderately large. Oosterloo (1984) derived an asymptotic distribution and confidence intervals of test information function for Rasch models using conditional maximum likelihood estimation (MLE). However, this method cannot be applied directly to the two- and three-parameter logistic (2PL and 3PL) models. Zhang, Xie, Song, and Lu (2011) used a measurement-error approach and demonstrated how the uncertainty of item parameters can cause a large bias in ability estimation in some cases (also see Zhang & Lu, 2007). Along this line, in this article we investigate the impact of estimation errors of item parameter estimators in 2PL and 3PL models on test information functions.
2. Asymptotic Results
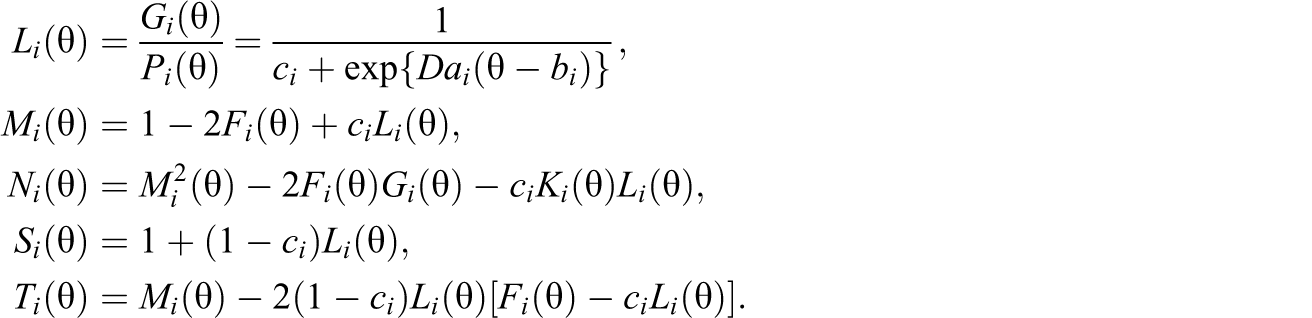
Suppose that a test consists of n dichotomous items. Two IRT models, depending on item types, are widely used in the analysis of dichotomously scored response data: A three-parameter logistic (3PL) model is typically used for the multiple-choice items (which are scored correct or incorrect), and a two-parameter logistic (2PL) model is used for the short constructed-response items, also scored as correct or incorrect. The 3PL model (Birnbaum, 1968) is

where D is a constant, usually 1.7, and

and

and
Denote

where

Note that

Models 1 through 3 contain both item and examinee parameters. In practice, as mentioned in Section 1, item parameters are first estimated and then assumed to be the true values when subsequent statistical analyses are performed. Suppose that item parameters are estimated using a calibration sample with J examinees. The item parameter estimators,
Every estimator has chance error, and possibly bias. The basic equation of an estimator is

The chance error, measured by the variance (or standard error [SE], the square root of the variance), affects the estimates (the values of the estimator) randomly, causing the estimates to differ from the true value in different directions, while the bias affects all estimates in the same direction. Bias may not exist (equal zero) if an estimator is unbiased, but chance error is inevitable. For multiple unknown parameters, chance errors of parameter estimators are measured by the variances (or SEs) and covariances of these estimators.
Two research questions can be raised here: (1) Do estimation errors of item parameter estimators have an impact on statistical inferences based on estimated item parameters or estimated IRT models? (2) If yes, when do they have a substantial impact and what are the consequences?
In statistics, a model typically has unknown parameters. One needs to estimate them first, then use the estimated model to make a prediction or to explain some phenomena or relationships among variables. In the latter stage, the parameter estimators are treated as covariates and their uncertainty due to estimation errors are taken into account. If there are simple closed formulae for the variances and covariances of those parameter estimators, it is usually not too difficult to show the impact of the uncertainty about model parameters. Below, we take simple linear regression as an example to show how chance errors of estimated parameters affect the prediction of a response variable.
The simple linear model is

where

where

One can use

where

Note that

which is the consequence of chance errors (Equation 7) of the two estimated parameters in the simple linear model. In fact, Equation 9 is the (estimated) variance of
In IRT, because no closed formulae exist for the variances and covariances of estimated parameters for commonly used item response models, it becomes extremely difficult to investigate the impact of chance errors of estimated parameters.
According to the basic estimation error model (6), we follow the approach of Zhang et al. (2011) and express item parameter estimators as


where


The theorem below requires the following regularity conditions referred to as (C0)–(C2) specified in Zhang et al. (2011): (C0) Item parameters (C1) There exists

where
(C2)


These regularity conditions are usually assumed when investigating asymptotic properties related to 3PL models (see Zhang et al., 2011). In the theorem, a notation

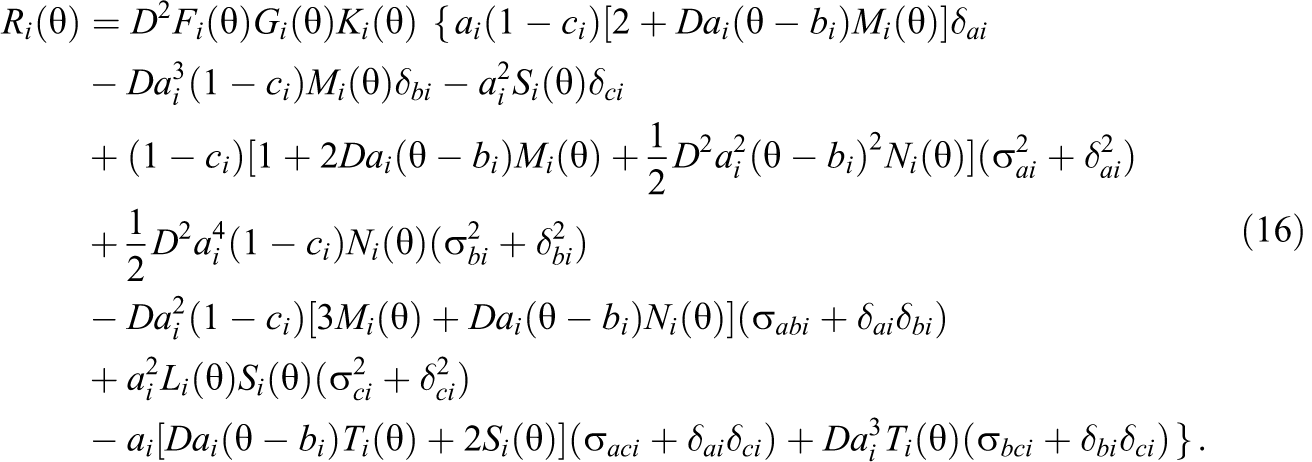
where
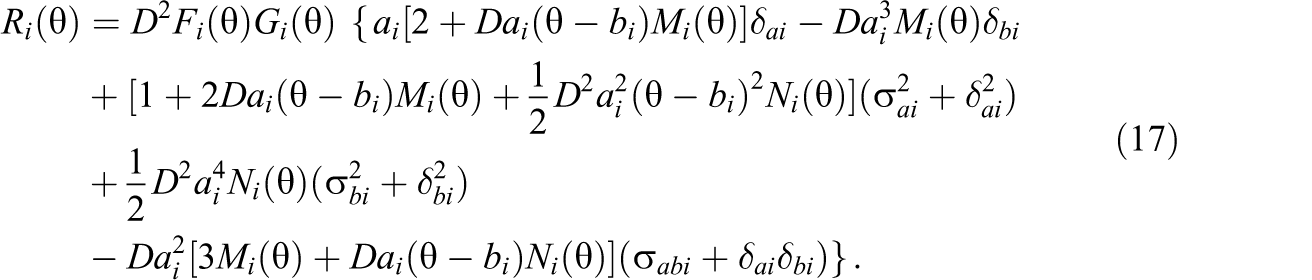
When item i is modeled by a 2PL model,
When item i is modeled by a 1PL model,

where
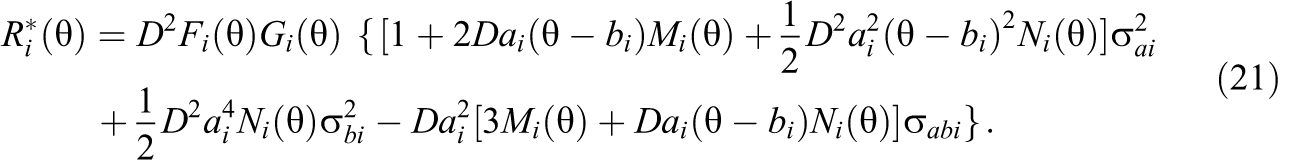
A proof of this theorem is given in Appendix A. The theorem can be applied to cases where different models (1PL, 2PL, and 3PL) are used to characterize different types of items in a test. It presents the major part of the difference between the estimated and the true test information functions. The
In practice, one needs estimates of item parameters, biases, variances, and covariances to calculate an estimate of the adjusted term. Any estimation method (e.g., an MLE or Bayesian estimation method) can be used to estimate item parameters and related quantities as long as it provides decent estimates as required by regularity conditions (C1) and (C2). An IRT calibration program, such as BILOG (Mislevy & Bock, 1982) and PARSCALE (Muraki & Bock, 1997), typically provides the estimates of the variances and covariances along with item parameter estimates. However, bias estimates of item parameter estimators are not available yet. In general, the maximum likelihood estimator is asymptotically unbiased under certain conditions. Thus, it may not be unrealistic to assume that item parameter estimators are unbiased. That is, one may only consider chance errors of item parameter estimators. Under this assumption, the theorem can be simplified.

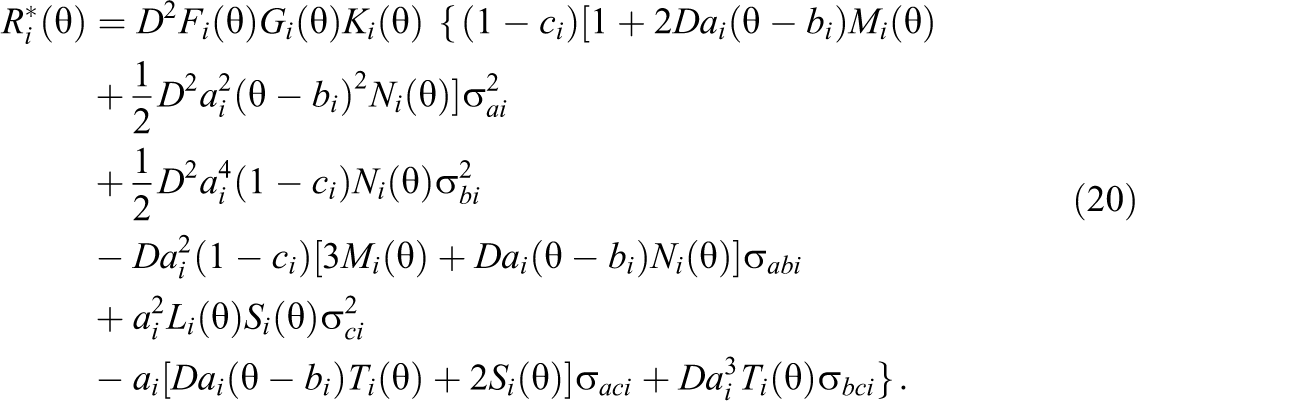
where
When item i is modeled by a 2PL model,
When item

where
There are six terms in Equation 20, corresponding to the contributions from the variances and covariances of item parameter estimators for a 3PL model. Upon obtaining the estimates of item parameters, the variances, and the covariances of item parameter estimators, one can construct the estimate of the simplified adjusted term,
3. A Simulation Study
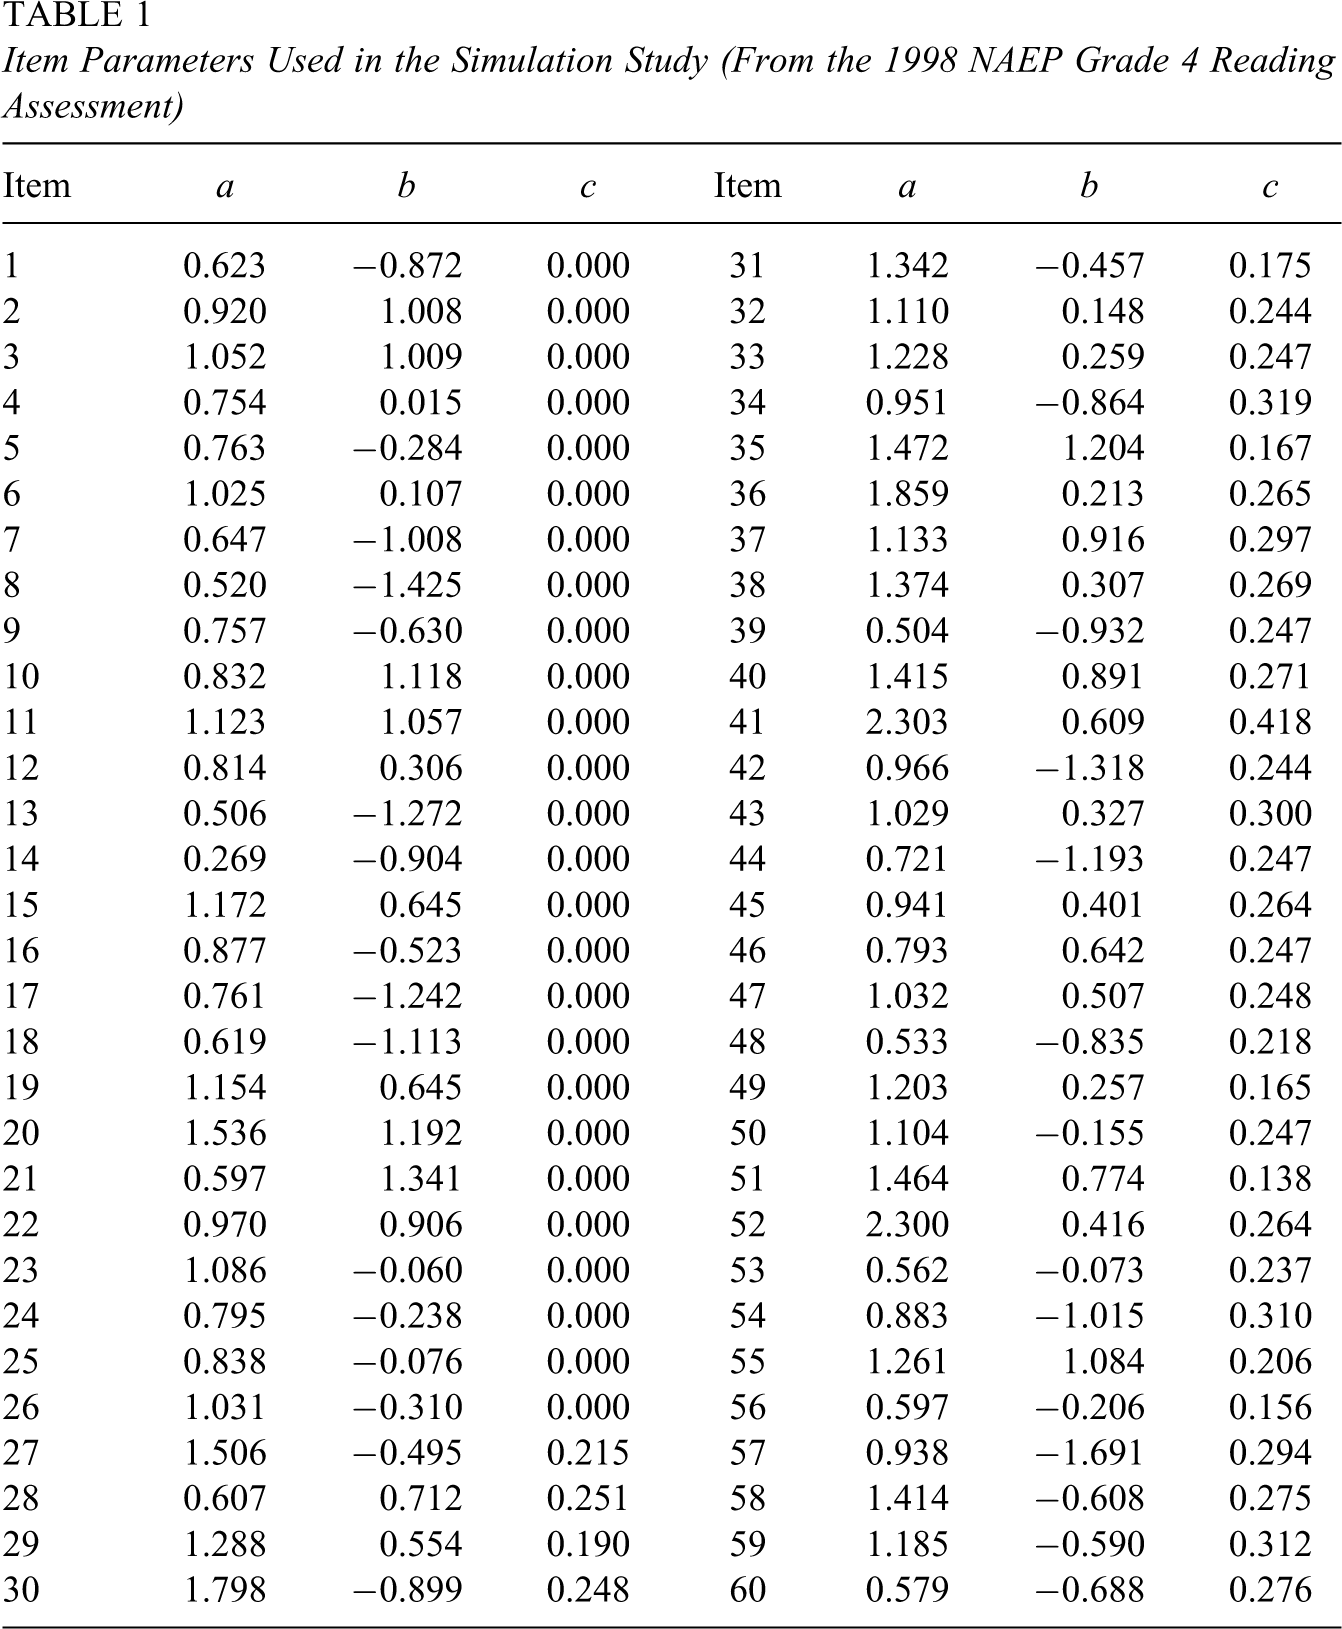
A simulation study was conducted to evaluate the impact of uncertainty about item parameters on test information functions and to verify the accuracy of the approximation formulas developed in the previous section using simulated data. Item parameters obtained from the 1998 National Assessment of Educational Progress (NAEP) Grade 4 reading assessment (Allen, Donoghue, & Schoeps, 2001) were used as true item parameters to generate response data. We chose 60 items: 26 2PL items corresponding to short constructed-response items and 34 3PL items corresponding to multiple-choice items. These item parameters are presented in Table 1.
Item Parameters Used in the Simulation Study (From the 1998 NAEP Grade 4 Reading Assessment)
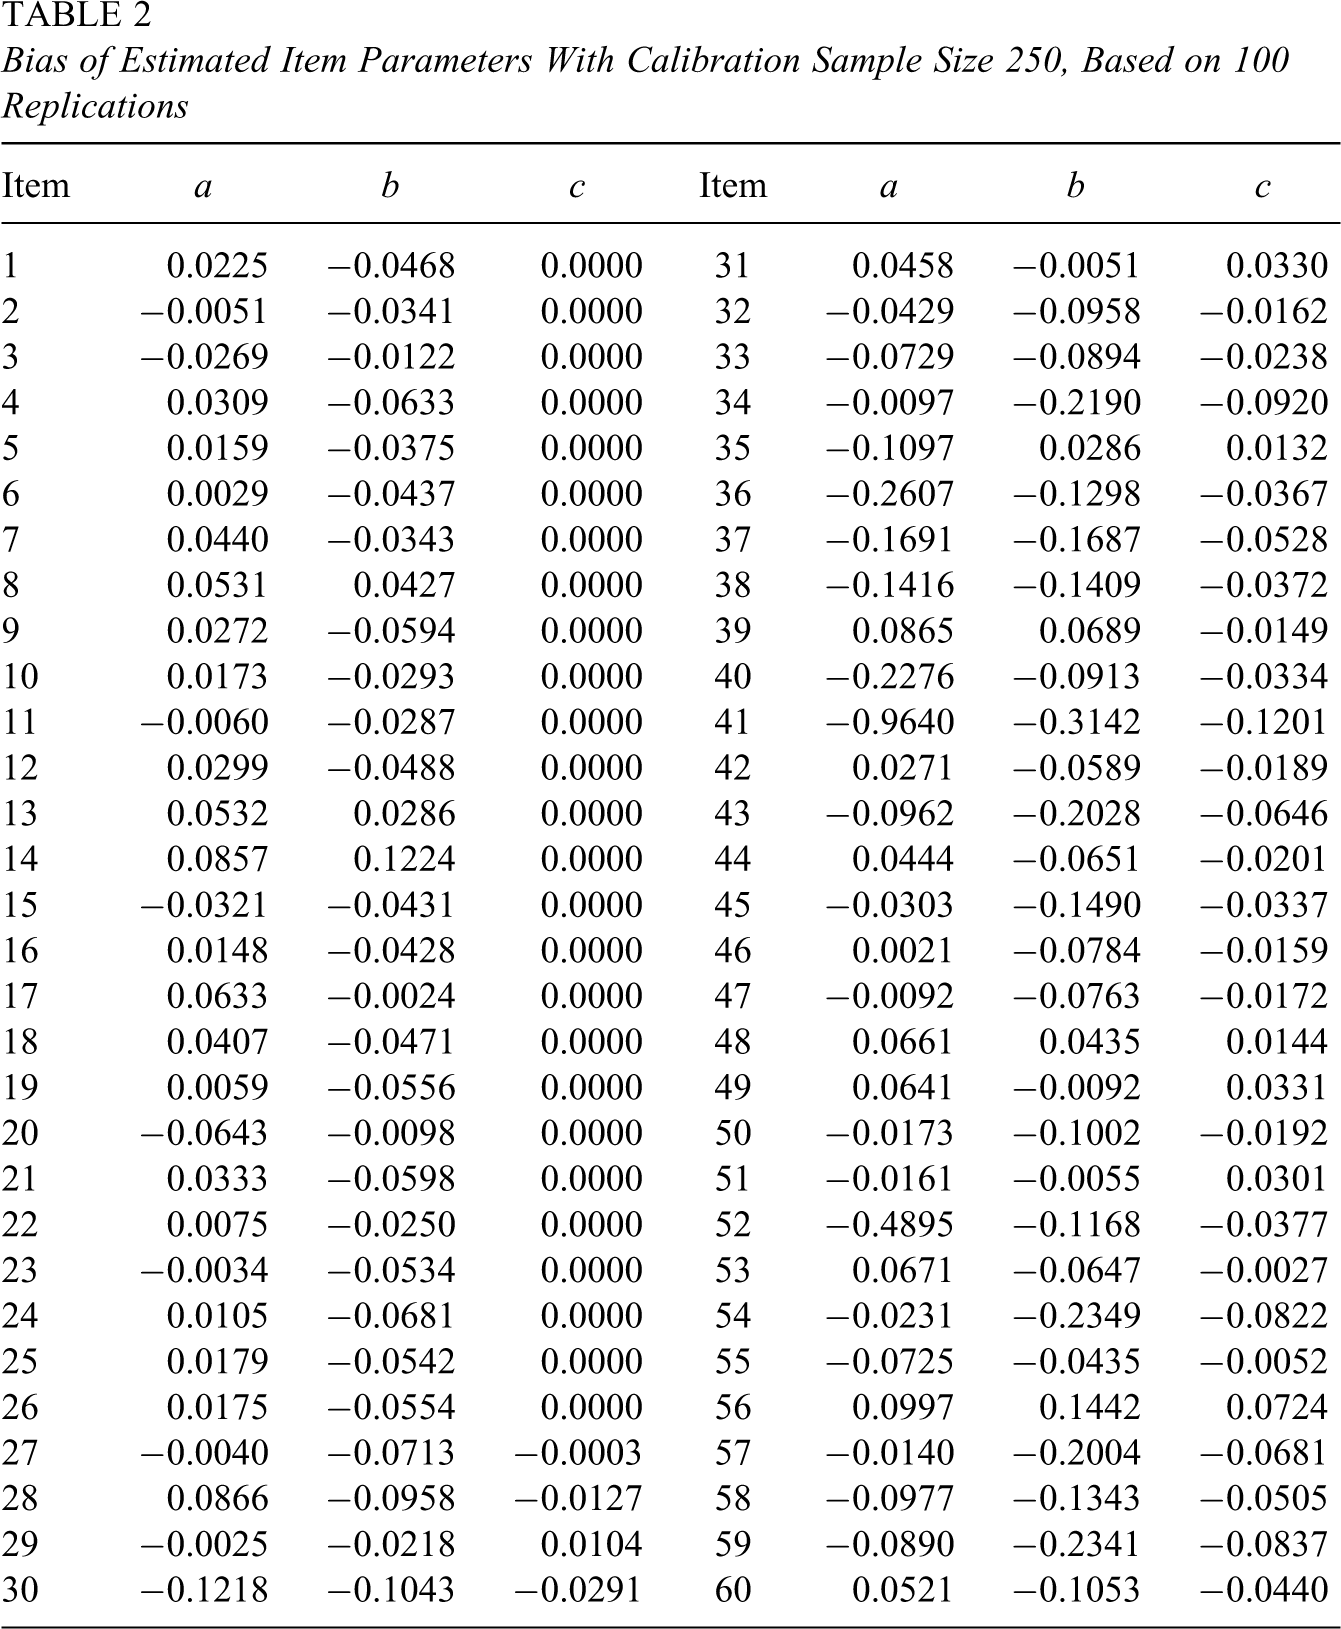
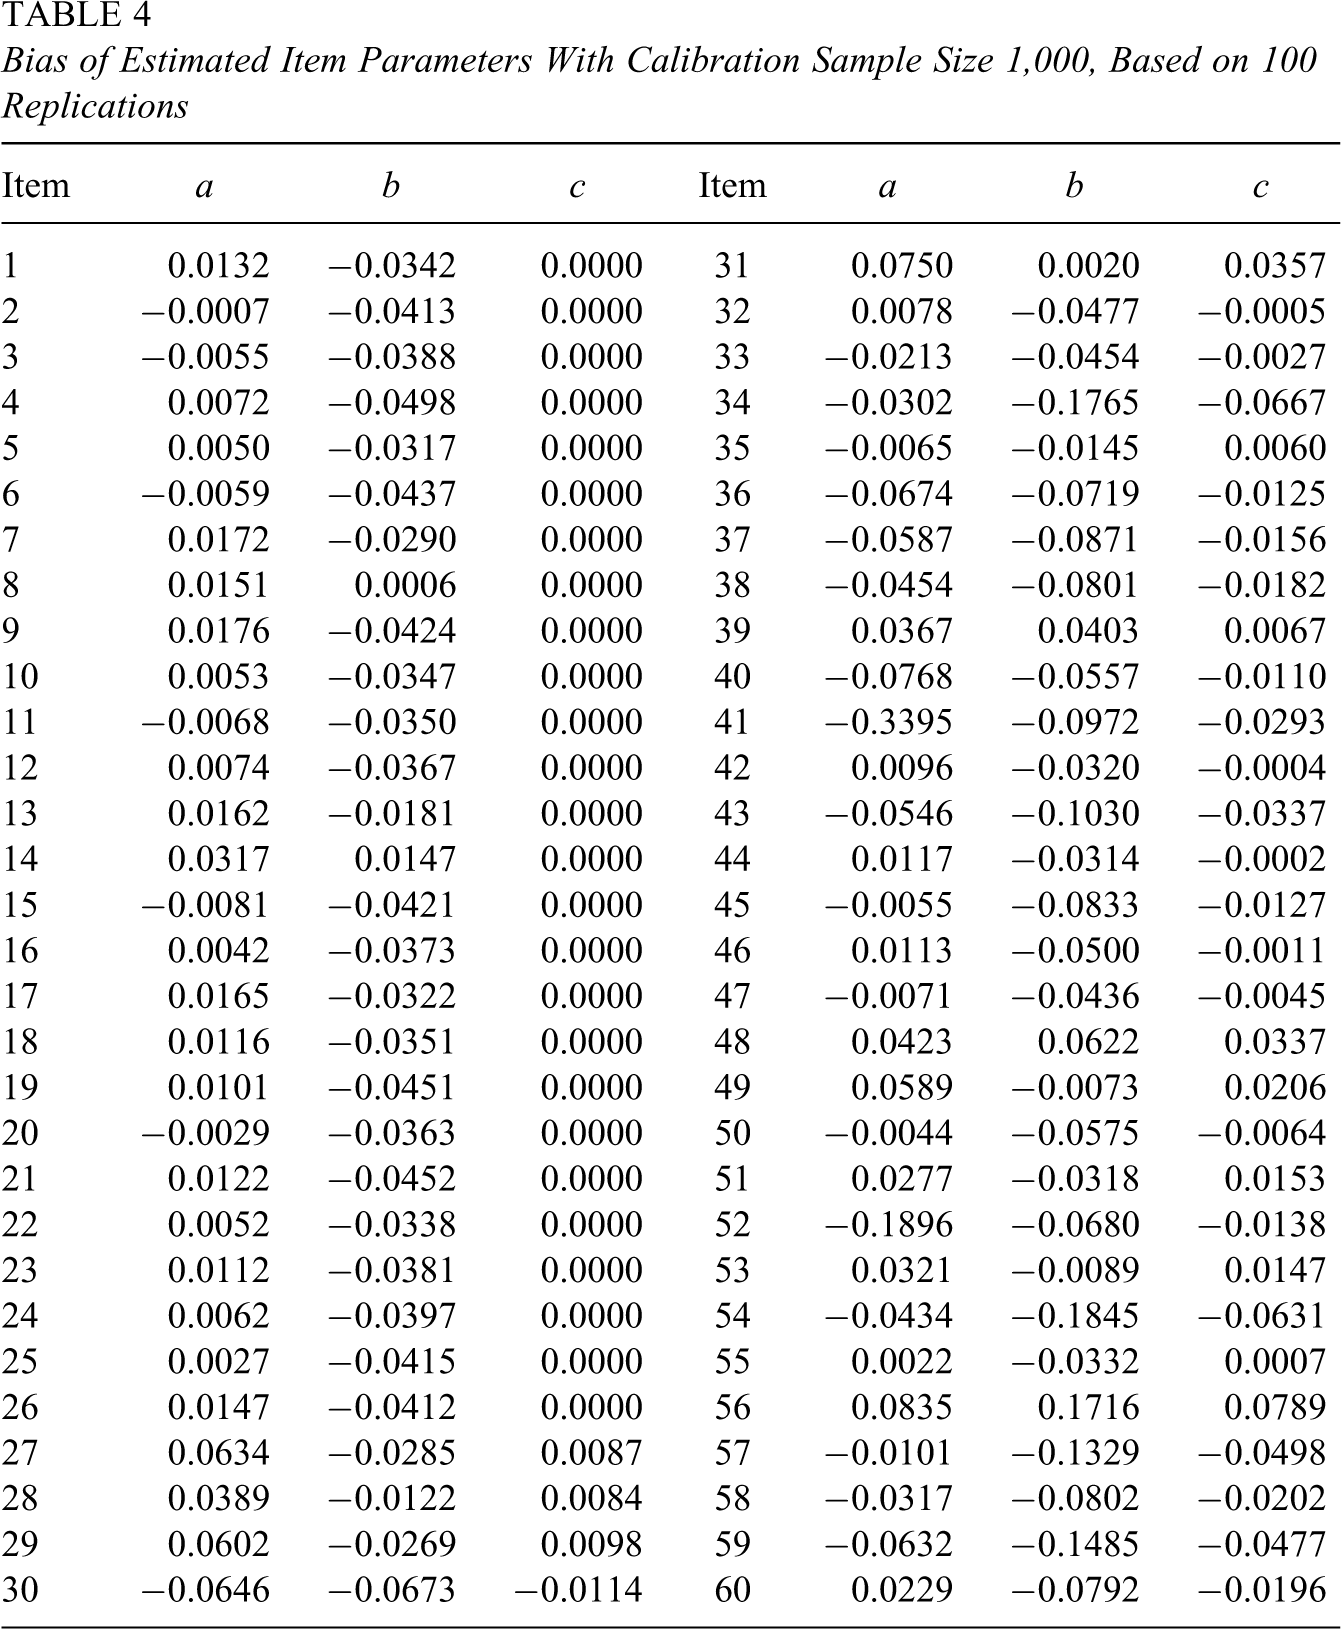
The numbers of examinees in simulated calibration samples were 250, 500, and 1,000. Examinees’ ability parameters were independently generated from a standard normal distribution. Based on these ability parameters and item parameters, 100 sets (for 100 replications) of calibration response data were generated using IRT method for each of the three sample sizes. Each simulated data set was used to estimate item parameters separately. In this study, a NAEP version of PARSCALE (Allen et al., 2001) was used to estimate item parameters. The NAEP PARSCALE is an item parameter estimation program that combines Mislevy and Bock’s (1982) BILOG and Muraki and Bock’s (1997) PARSCALE computer programs. For convenience, it is simply called PARSCALE in this article. Tables 2 through 4 present the bias of estimated item parameters based on 100 replications for sample sizes 250, 500, and 1,000, respectively. The variances and covariances of estimated item parameters are not reported here because their sizes were too large.
Bias of Estimated Item Parameters With Calibration Sample Size 250, Based on 100 Replications
Bias of Estimated Item Parameters With Calibration Sample Size 500, Based on 100 Replications

One hundred traditional estimated test information functions for each of the three sample sizes, as well as the true test information function, were calculated. Specifically, we computed these functions at 81 ability levels:
Bias of Estimated Item Parameters With Calibration Sample Size 1,000, Based on 100 Replications
Average Traditional Versus Average Adjusted Estimated Test Information Functions
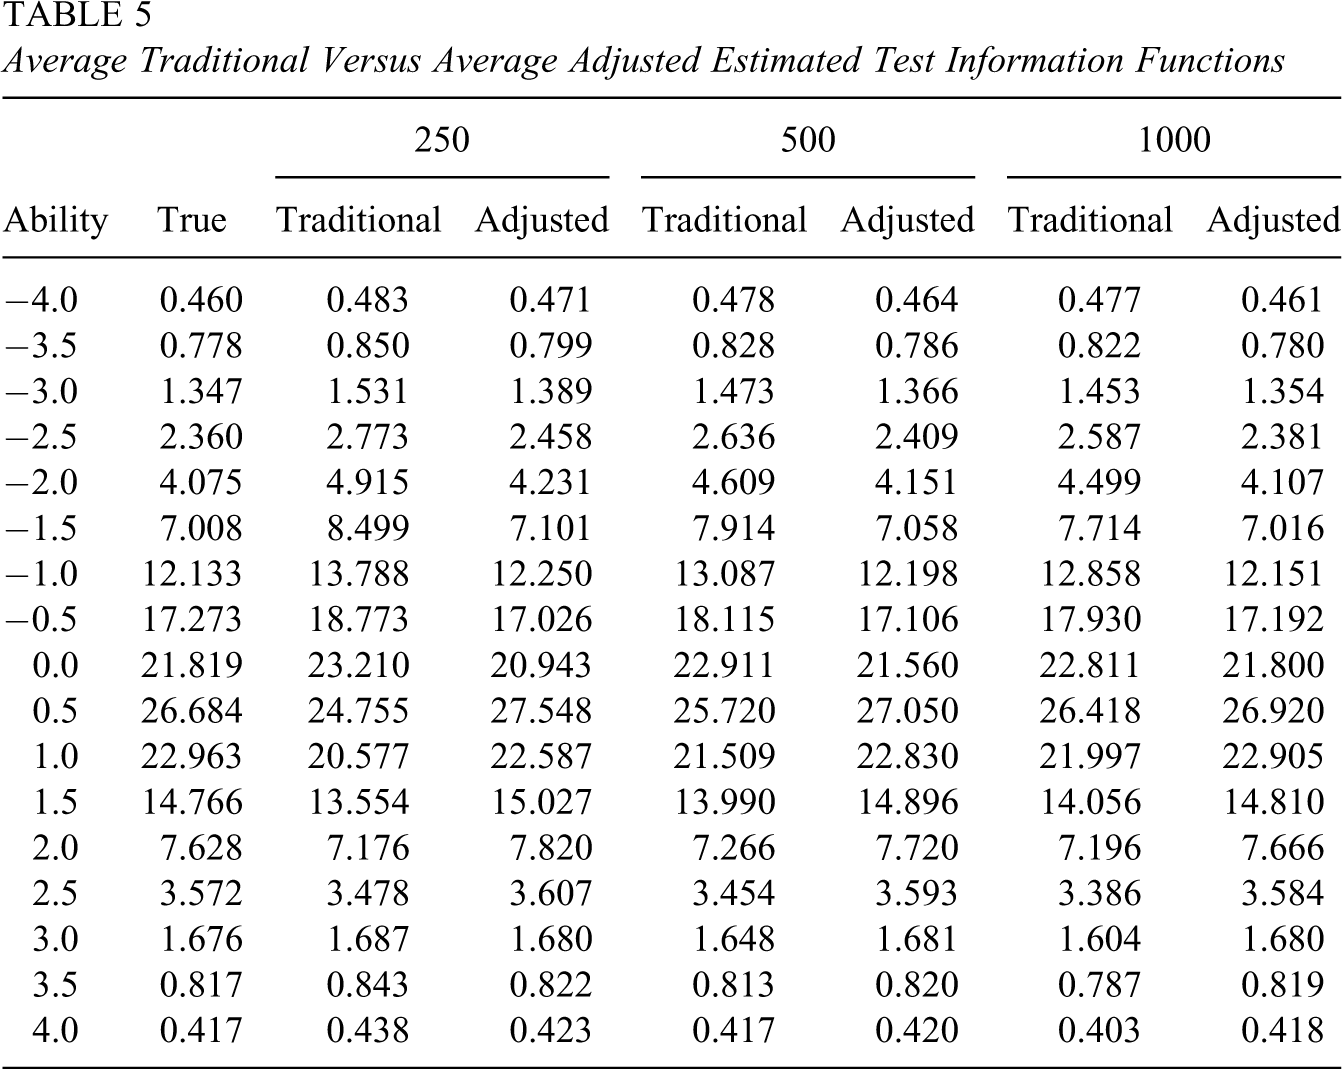
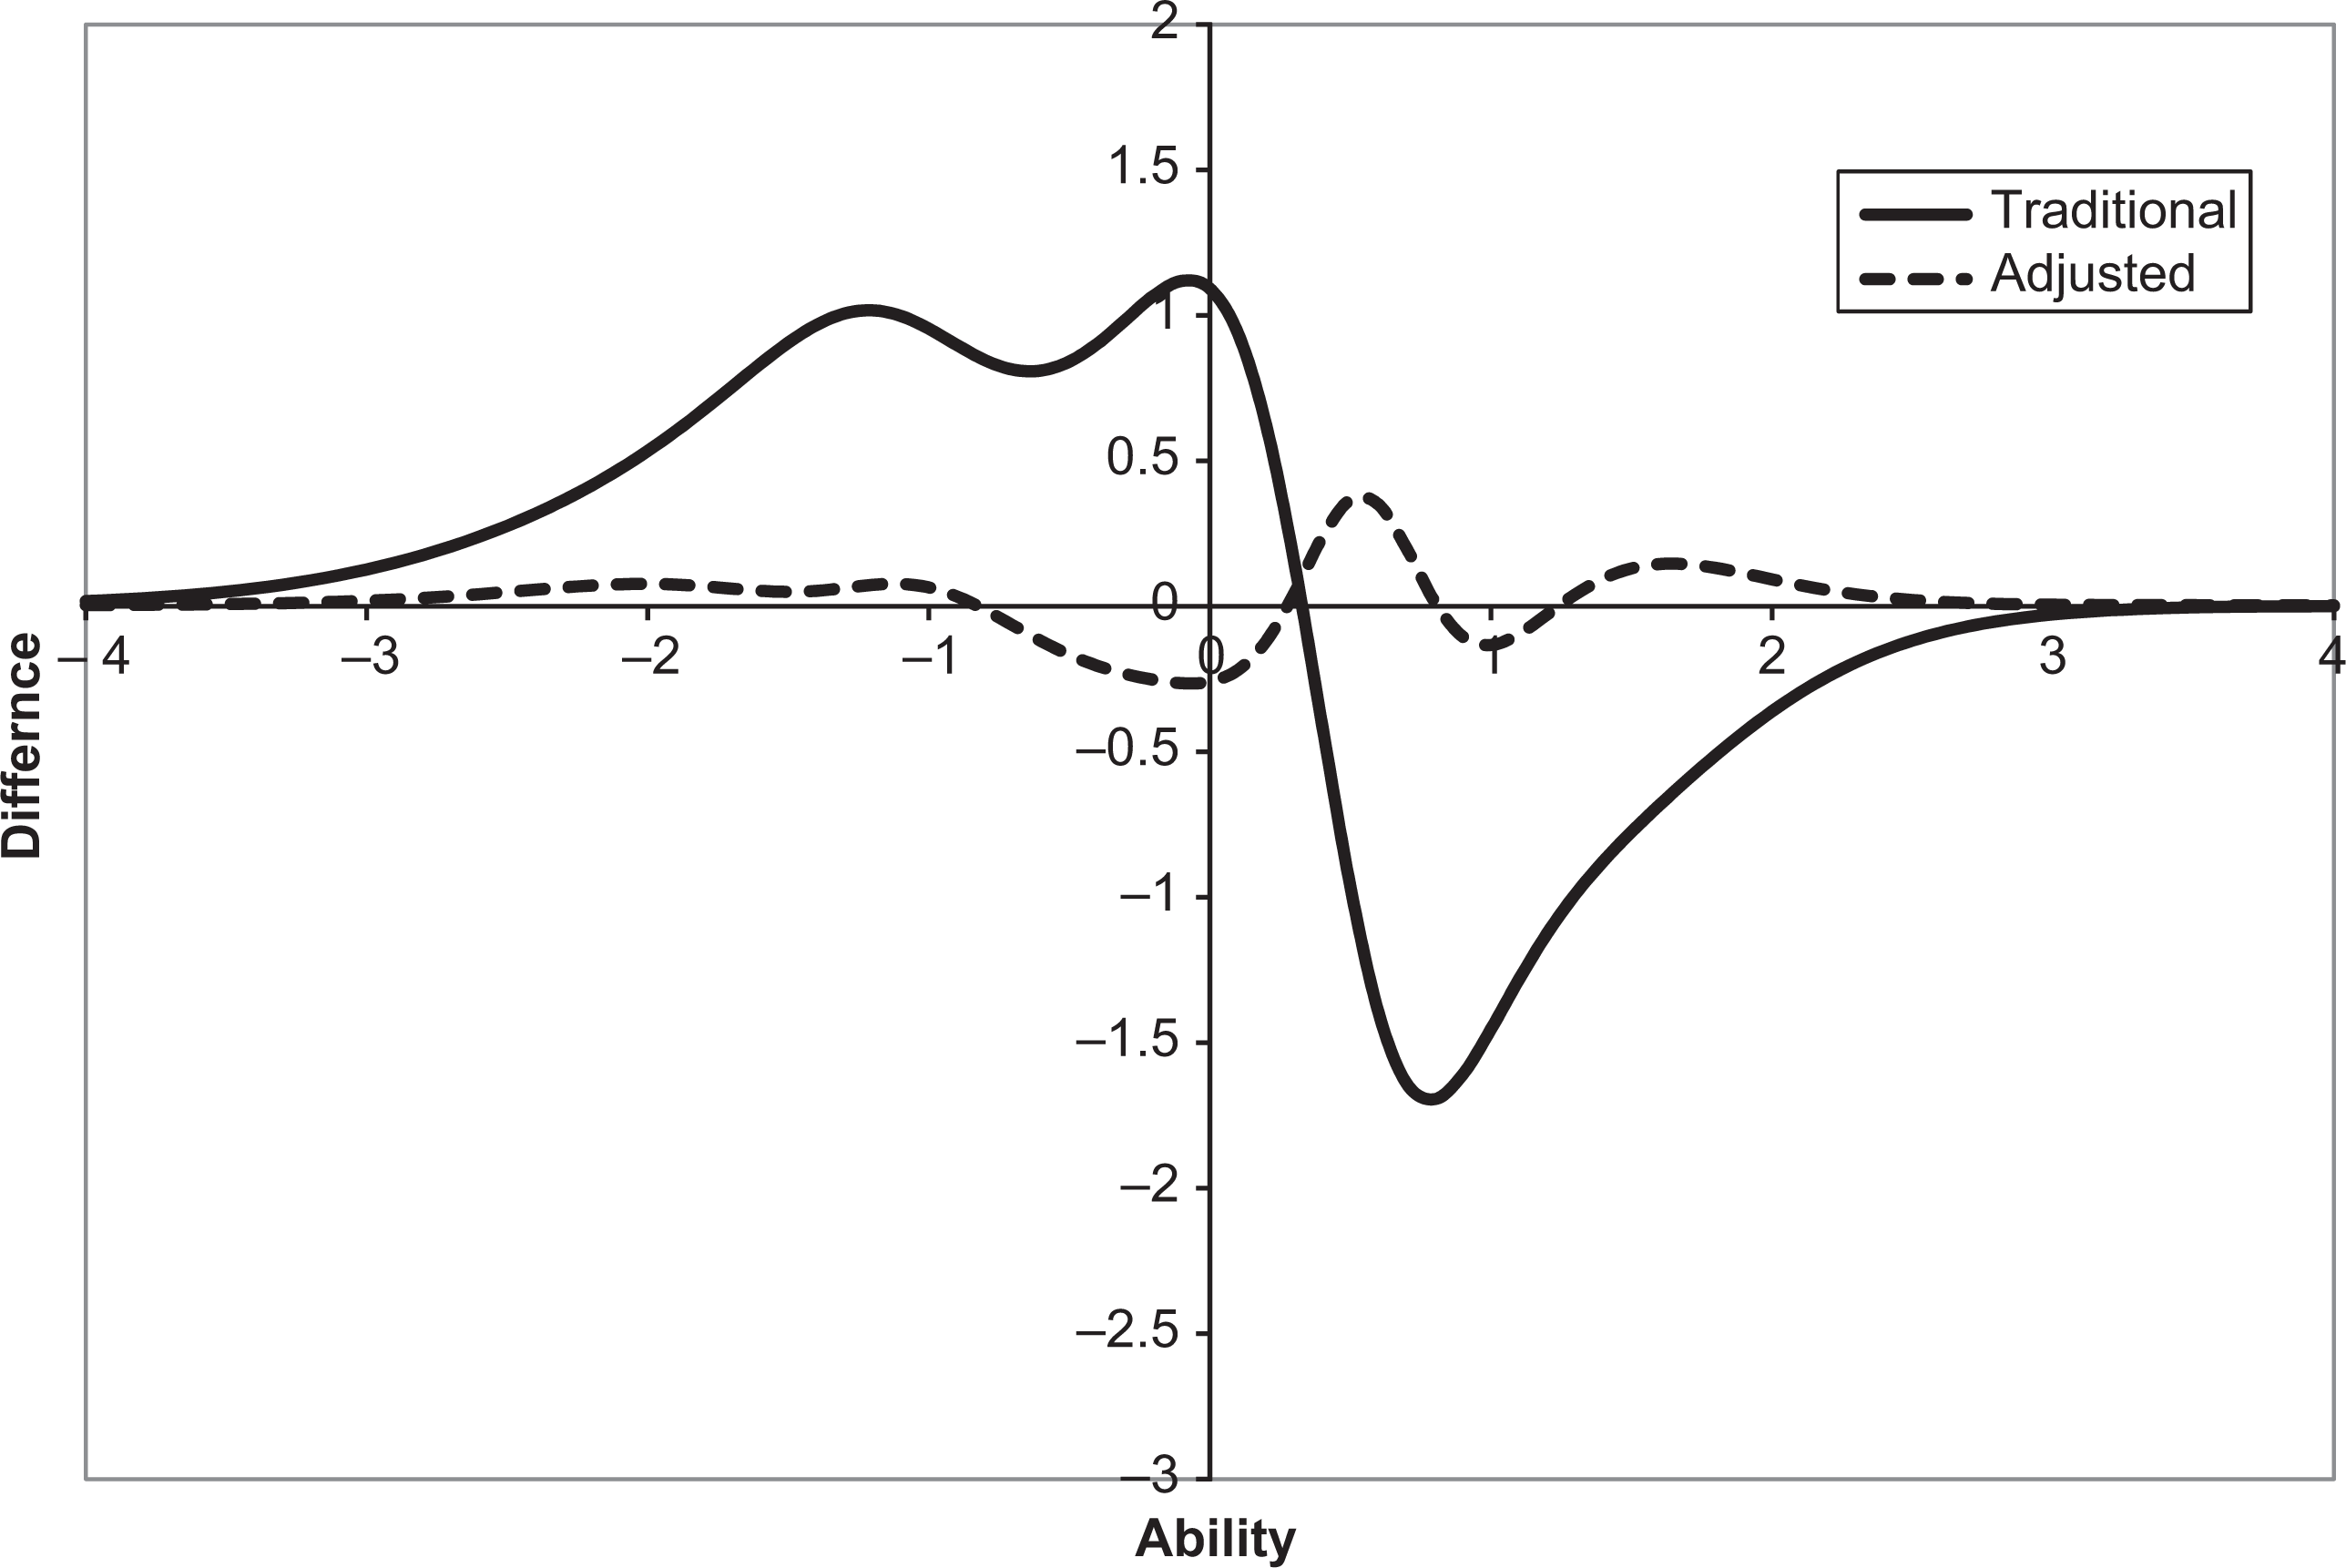
Using the biases, variances, and covariances of estimated item parameters, the values of the adjusted estimated test information functions were also calculated and are presented in Columns 4, 6, and 8 of Table 5 for the three sample sizes. For each of the sample sizes, the adjusted estimated test information functions are, in general, much closer to the true test information function than the average of traditional estimated test information functions. Similar to the case of traditional estimated test information functions, the difference between the adjusted and true test information functions decreases as the sample size increases. The maximum differences are

Differences between traditional/adjusted estimated and true test information functions with sample size 250.
Differences between traditional/adjusted estimated and true test information functions with sample size 500.

Differences between traditional/adjusted estimated and true test information functions with sample size 1,000.
4. A Real Data Example
Response data from one administration of SAT I: Reasoning Test with 350,400 examinees were used to evaluate the extent of the impact of chance errors of item parameter estimators on test information functions with different sample sizes. We randomly drew samples of examinees from the whole data separately. Each sample was drawn without replacement. The sample sizes considered here are 250, 500, 1,000, and 2,000. For each sample size, we drew 100 samples. The number of items we used is 60, which contains 50 multiple-choice and 10 constructed-response math items. We used PARSCALE to calibrate response data with 2PL models since test takers are discouraged (penalized for incorrect answers) from guessing in the SAT. Estimated item parameters obtained from PARSCALE are considered unbiased in this study. After obtaining estimated item parameters, along with their variances and covariances, we calculated the test information functions and the estimated adjusted terms. The above process is replicated 100 times for each sample size considered. Note that one should examine whether the results from PARSCALE or other estimation programs are properly converged. If not, the SEs of item parameter estimators may be inflated. In the case of 250 examinees, we found that PARSCALE could not provide properly converged results in some replications. When this happened, samples were redrawn until properly converged PARSCALE results were obtained.
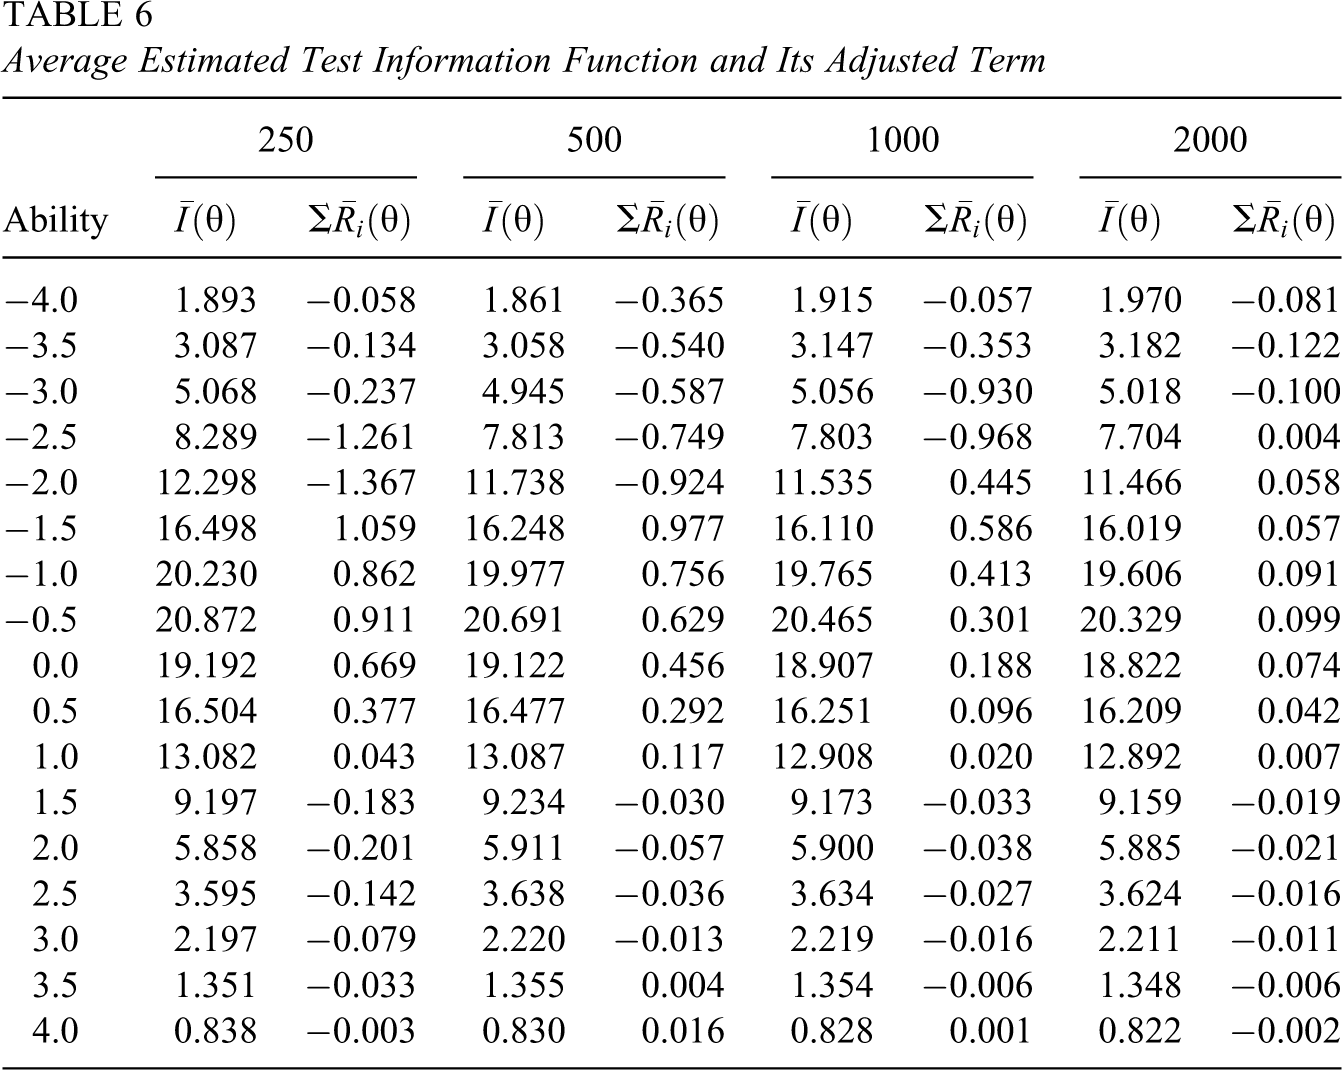
Table 6 presents the average estimated test information functions and their adjusted terms based on 100 replications for various sample sizes at 13 selected ability levels. When the sample is relatively large, the adjusted terms are rather small. However, the adjusted terms may not be negligible when the sample is relatively small, especially in the case of 250 examinees. The average adjusted terms are also illustrated in Figure 4, which clearly shows that the magnitude of the adjusted term decreases when the sample size increases. The maximum absolute values of these average adjusted terms for samples of 250, 500, 1,000, and 2,000 are 3.922, 1.375, 1.161, and 0.126, respectively. The major reason for a relatively large adjusted value is that some item parameters have relatively large SEs, especially for the difficulty parameters. For example, the largest SE of difficulty parameters in the case of 250 examinees is 1.154.
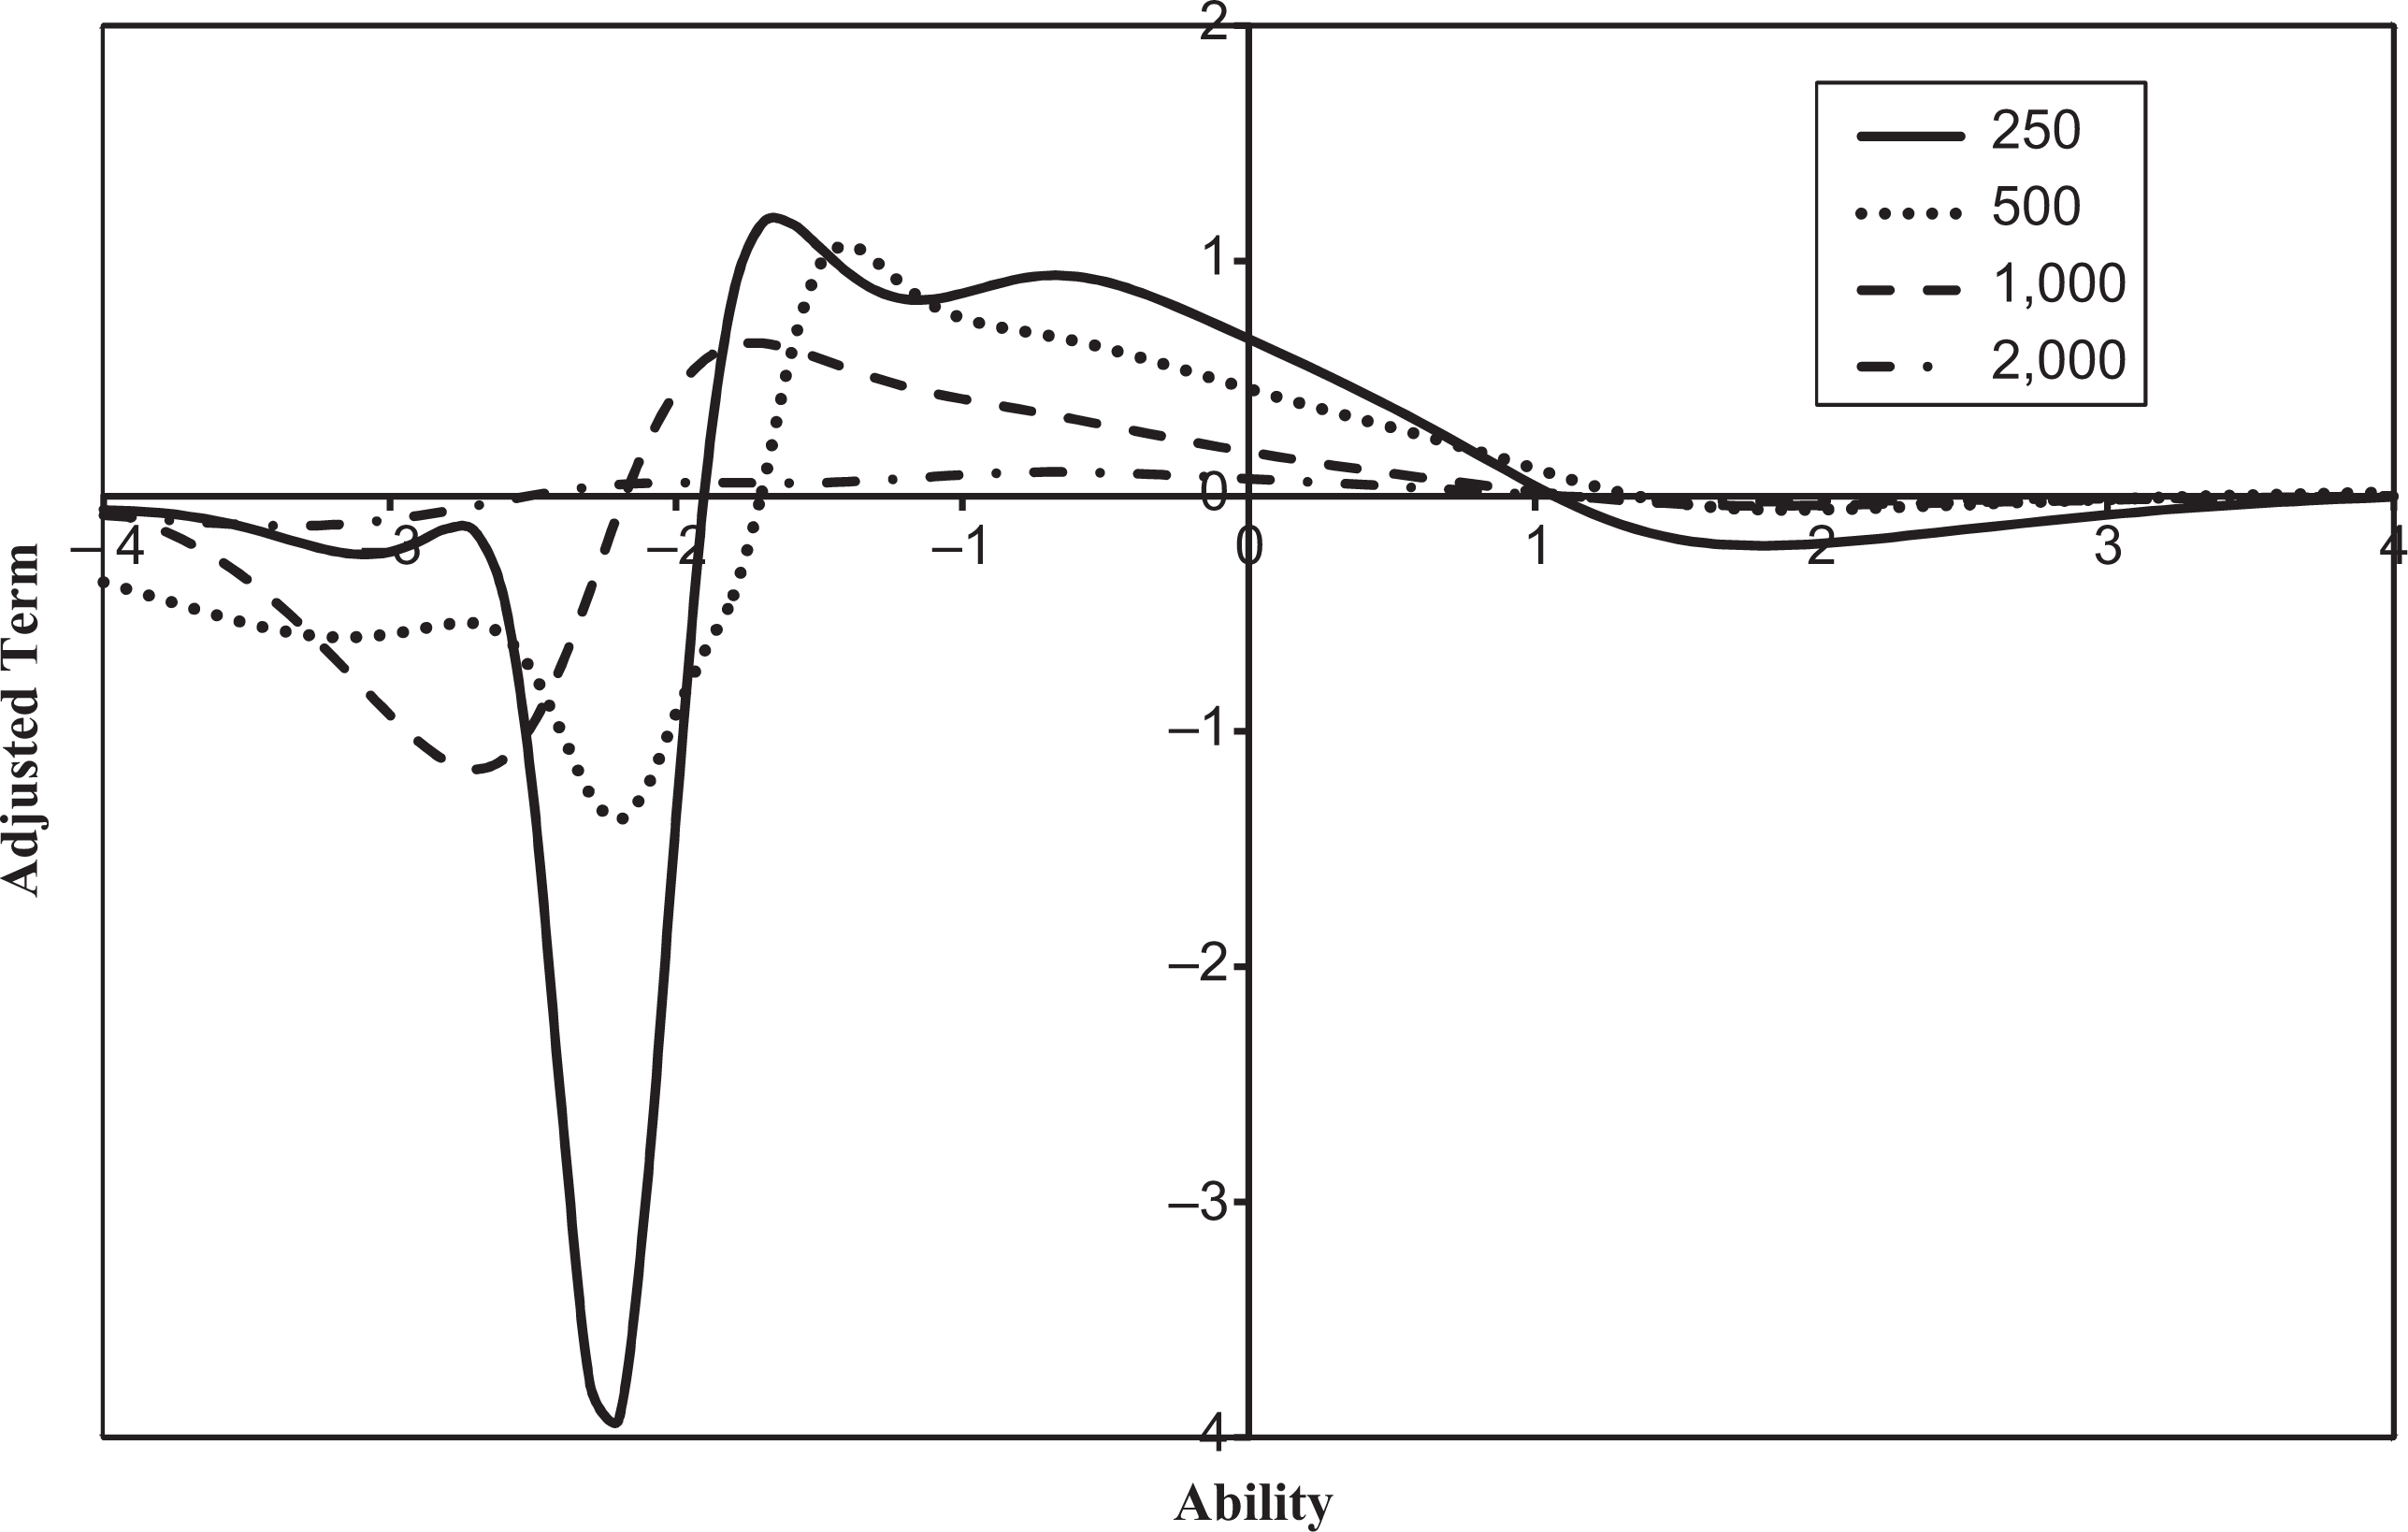
Adjusted values of test information functions for various sample sizes.
Average Estimated Test Information Function and Its Adjusted Term
5. Discussion
Until now, most IRT-based analysis procedures still ignore estimation errors of estimated item parameters. In this article, we argued that estimation errors, especially variances and covariances, of estimated item parameters should be considered even though their impact on subsequent analyses is not always large. This study is part of the research and development of a new IRT-based analysis procedure that takes uncertainty about item parameters into account when statistical inferences are made based on IRT models with estimated item parameters.
In this article, the measurement-error approach (Fuller, 1987; Stefanski & Carroll, 1985; Zhang et al., 2011) is applied to asymptotically formulate the major part of the difference between estimated and true test information functions. This difference is caused by uncertainty about item parameters in IRT models, namely, the biases, variances, and covariances of item parameter estimators. The formula or the adjusted term derived in this article can be used as a tool to evaluate the impact of estimation errors of estimated item parameters on test information function. At the same time, the values of the adjusted term can also provide some evidence about whether item parameter estimation is sufficiently accurate or not. A simulation study showed that the asymptotic formula approximates the difference between estimated and true test information functions rather well.
The variances (or SEs) and covariances of item parameter estimators are the major inputs of these asymptotic formulas. Thissen and Wainer (1982) investigated the SEs of a 2PL or 3PL model under the assumption that the response data are well behaved (or the model fits the data reasonably well) and the ability scores are known fixed values. In general, the variances and covariances can be calculated directly from the inverse of the appropriate Fisher information matrix (see Lehmann, 1991). However, these estimates are actually the minimum values obtainable for the variances for the parameters (Thissen & Wainer, 1982). This is because such calculation formulas of variances are based on the assumption that the IRT models are exactly true, while an operational sample typically cannot satisfy, and sometimes may severely violate, this assumption. Thus, SEs are typically underestimated in practice. In order to provide more accurate estimates of chance errors of item parameter estimators for an operational sample, we recommend using the bootstrap method (Efron, 1982; Efron & Tibshirani, 1991) to estimate the variances and covariances. It is also of interest to investigate the coverage of confidence intervals or limits for test information functions when uncertainty about item parameters is or is not taken into account. This is a topic for future research.
Footnotes
Appendix A
Acknowledgments
The author would like to thank Ting Lu and Sarah Zhang for their comments and suggestions.
Declaration of Conflicting Interests
The author declared no potential conflicts of interest with respect to the research, authorship, and/or publication of this article.
Funding
The author disclosed receipt of the following financial support for the research, authorship, and/or publication of this article: The research reported in this article was supported in part by a grant from University of Illinois Research Board.