



Abstract
Meijer and van Krimpen-Stoop noted that the number of person-fit statistics (PFSs) that have been designed for computerized adaptive tests (CATs) is relatively modest. This article partially addresses that concern by suggesting three new PFSs for CATs. The statistics are based on tests for a change point and can be used to detect an abrupt change in test performance of examinees during a CAT. The Type I error rate and power of the statistics are computed from a detailed simulation study. The performances of the new statistics are compared with those of four existing PFSs using receiver operating characteristics curves. The new statistics are then computed using data from an operational and high-stakes CAT. The new PFSs appear promising for assessment of person fit for CATs.
Keywords
Computerized adaptive tests (CATs) rely heavily on item response theory (IRT) models. According to Standard 4.10 of the Standards for Educational and Psychological Testing (American Educational Research Association, American Psychological Association, & National Council for Measurement in Education, 2014), evidence of model fit should be documented when IRT models are used in test development. Person-fit statistics (PFSs), which quantify the fit of an examinee’s score pattern 1 to the IRT model (Bradlow & Weiss, 2001, p. 86), may constitute a part of that evidence (see, e.g., Ferrando, 2015; Meijer & Sijtsma, 2001, for detailed reviews of the existing PFSs). Further, in a report for the Council of Chief State School Officers, Olson and Fremer (2013) recommended the use of PFSs, in addition to other methods, to detect irregularities in answering behavior.
Glas, Meijer, and van Krimpen-Stoop (1998); Nering (1997); and van Krimpen-Stoop and Meijer (1999) showed that PFSs that are appropriate for nonadaptive tests usually have low power for CATs. The low power has been attributed to two features of CATs: short test length and modest spread of the item difficulties (Meijer & van Krimpen-Stoop, 2010, p. 320). In addition, Bradlow and Weiss (2001) noted that it is difficult to find appropriate null distributions (i.e., the distribution under no misfit) of PFSs in CATs because different examinees receive different items and, often, tests of different lengths. Therefore, it is no surprise that Meijer and van Krimpen-Stoop (2010, p. 320) noted the number of PFSs with satisfactory performances for CATs to be relatively modest.
Researchers such as Bradlow and Weiss (2001); Bradlow, Weiss, and Cho (1998); and van Krimpen-Stoop and Meijer (2000, 2001, 2002) suggested several PFSs that are based on the cumulative sum (CUSUM) procedure, which is a methodology from statistical process control (e.g., Montgomery, 2013). Each CUSUM-based PFS involves a CUSUM of positive and negative residuals after each item—a CUSUM that is too large in absolute value indicates a person misfit. The CUSUM-based PFSs have been successful in detecting a string of consecutive correct or incorrect answers (e.g., Meijer, 2002, p. 223), which is mostly associated with an abrupt change in the test performance (in the form of tiredness, speededness, loss of concentration, item preknowledge, etc.) of an examinee. Such an abrupt change is referred to as a theta shift in the literature on identification of faking (e.g., Ferrando & Anguiano-Carrasco, 2013).
Several researchers such as Hawkins, Qiu, and Kang (2003, p. 357) and Montgomery (2013, p. 491) noted that if an investigator is interested to detect an abrupt change in the context of statistical process control, the CUSUM procedures are the most appropriate (in the sense of being the most powerful) when the parameters of the underlying statistical model before and after the change are known; however, if one or more of the parameters are unknown, the application of tests for a change point (TFCP; Andrews, 1993; Chen & Gupta, 2012; Csorgo & Horvath, 1997) may be more appropriate than that of the CUSUM procedures. Given that the examinee ability parameter is unknown 2 in CATs, TFCP may be successful in detecting an abrupt change in test performance. However, examples of PFA using TFCP in the context of CATs are severely lacking.
This article suggests three new PFSs based on TFCP for use with CATs. The TFCP focus on finding the point in time where the underlying statistical model or the model parameters underlying a sequence of observations have changed in some fashion (Montgomery, 2013, p. 490); the null hypothesis of no change is tested versus the alternative hypothesis that a change has occurred after some observation. Accordingly, the three new PFSs provide three slightly different approaches to test the null hypothesis that the examinee ability was unchanged throughout the CAT (i.e., equivalent to no theta-shift and indicates no misfit) versus the alternative that it has changed after some item (that indicates misfit).
The next section includes some background material including reviews of existing PFSs in CATs, TFCP, and two existing applications of TFCP to educational testing. Three PFSs based on TFCP are suggested in the Method section. In the Simulation Study section, the Type I error rate and power of the new PFSs are examined and compared to those of the CUSUM-based PFSs of Bradlow et al. (1998), Armstrong and Shi (2009a), van Krimpen-Stoop and Meijer (2000), and van Krimpen-Stoop and Meijer (2001) in a simulation study. The new PFSs are computed using data from a high-stakes CAT in the Application section. Conclusions and recommendations are provided in the last section.
This article focuses only on dichotomous items whose parameters are assumed to be known. The assumption of known item parameters is common in scoring on CATs. Further, van Krimpen-Stoop and Meijer (2000), van Krimpen-Stoop and Meijer (2001), and Bradlow and Weiss (2001) all assumed item parameters to be known in PFA for CATs.
Background
Notations
Let’s consider a CAT in which n dichotomous items are administered to an examinee whose true ability is θ. Note that the test length n could vary over the examinees. Let Yi represent the examinee’s score (i.e., 0 or 1) on the ith item, i = 1, 2, …, n. Let us denote the probability of a correct answer on item i for the examinee as Pi(θ). For example, for the three-parameter logistic model (3PLM),

Review of PFSs Based on the CUSUM Procedure
All the PFSs that perform satisfactorily for CATs (e.g., Bradlow et al., 1998; Bradlow & Weiss, 2001; van Krimpen-Stoop & Meijer, 2000, 2001, 2002) are based on the CUSUM procedure. The score pattern of an examinee on a CAT is expected to roughly be an alternation of 0s and 1s, especially toward the end of the test when the estimated ability is close to the true ability; therefore, a string of consecutive 1s (correct answers) or consecutive 0s (incorrect answers) may be the result of an aberrant response behavior (e.g., Meijer & van Krimpen-Stoop, 2010, p. 322). The CUSUM-based PFSs offer different approaches to detect such strings.
Bradlow et al. (1998) suggested a CUSUM-based statistic at a given ability as
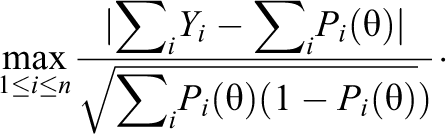
They suggested using the posterior mean of the above statistic (where the mean is computed over the posterior distribution of the examinee ability) as a PFS for CATs and referred to the PFS as the largest absolute realized deviation (LARD). The LARD should be computed after ordering the test items in different ways to detect different types of person misfit; for example, while it should be computed with the original item order to detect those who warm up to the test, it should be computed after reversing the item order to detect those who suffer from speededness. A score pattern is considered aberrant when the LARD is larger than a critical value, which is chosen using a permutation distribution. A permutation distribution of a PFS is somewhat similar to the bootstrap distribution of the PFS and is the distribution of the values of the statistic computed from several random permutations of the test items. Bradlow and Weiss (2001) suggested several other similar PFSs. While the PFSs suggested by Bradlow et al. (1998) and Bradlow and Weiss (2001) were computed for data from operational CATs, their Type I error rates and power have not been studied using simulated data. 3
van Krimpen-Stoop and Meijer (2000) defined the iterative “upper” and “lower” cumulative statistics based on residual item scores on a CAT as




van Krimpen-Stoop and Meijer (2001) suggested a CUSUM-based procedure that employs upper and lower statistics that look like those in Equations 2 and 3, respectively, but are computed from S subsets of items. The upper and lower cumulative statistics, denoted as



Armstrong and Shi (2009a) suggested a PFS based on the CUSUM procedure and a likelihood ratio statistic. In this approach, the “upper” and “lower” cumulative statistics are defined as



Armstrong and Shi (2009a, p. 409) considered only nonadaptive tests and noted that their PFSs need to be adjusted for use with CATs, but such an adjustment is not available yet. However, their PFSs defined above can be computed for CATs without any adjustment. 6 Tendeiro and Meijer (2012) suggested several PFSs based on the CUSUM procedure of Armstrong and Shi (2009a). Both Armstrong and Shi (2009a) and Tendeiro and Meijer (2012) found for simulated nonadaptive tests that the power of the PFSs given by Equations 8 through 10 is considerably larger than that of the PFSs given by Equations 2 through 5. Armstrong and Shi (2009b) suggested a model-free CUSUM procedure that is not considered here.
Other Person-Level Statistics for CATs
Meijer (2004) suggested the use of a statistic based on summed scores on subtests to detect unexpected combination of subscores on Paper and Pencil (P&P) tests and CATs; however, the power of the statistic was somewhat smaller on CATs compared to P&P tests; Meijer (2004, p. 132) attributed the smaller power to smaller spread of item difficulties in CATs. McLeod and Lewis (1999) and MeLeod, Lewis, and Thissen (2003) suggested new methods for detecting item memorization and item preknowledge, respectively, for CATs. However, these methods are not considered here because the interest here is in detecting an abrupt change in test performance.
TFCP in Statistical Process Control
There are several formulations of TFCP, but the formulation that is most relevant to this article is discussed in, for example, Andrews (1993), Chen and Gupta (2012, p. 2), Csorgo and Horvath (1997, p. 1), and Gombay and Horvath (1996) and involves the assumption that X1, X2, …, Xn are independent random variables, and Xi has a probability function (i.e., a mass function if Xi is discrete and a distribution function if Xi is continuous) fi(Xi; ψ), where ψ is a unidimensional model parameter. The TFCP involve testing of the null hypothesis that no change in the value of ψ has occurred in the sequence X1, X2, …, Xn against the alternative hypothesis that the value of ψ has changed at a change point τ, so that the probability function of Xi, i = 1, 2, …, τ − 1 is fi(Xi; ψ1), but that of Xi, i = τ, τ + 1, …, n is fi(Xi; ψ2). Only the case when ψ1, ψ2, and τ are unknown is relevant here. Researchers such as Hawkins et al. (2003, p. 357) and Montgomery (2013, p. 491) noted that if one wants to test this hypothesis, the CUSUM procedures are the most appropriate (in the sense of being the most powerful) when the parameters of the underlying statistical model are known before and after the change; however, if the parameters are unknown, which is almost always the case in PFA for CATs (where the examinee ability is unknown), the TFCP may be more powerful than the CUSUM procedures.
Existing Applications of TFCP in Educational Testing
Lee and von Davier (2013) suggested an approach based on TFCP to detect unusual changes in the mean score of an international language assessment that is administered several times in a year. Shao, Li, and Cheng (2015) suggested an approach based on TFCP to detect speededness in nonadaptive tests; they used a likelihood ratio test (LRT) statistic and computed the critical values of the statistic using a permutation distribution. In this article, one of the new PFSs for CATs is very similar to the LRT statistic of Shao et al.; however, the critical values of the statistic are obtained here using theoretical large-sample derivations in Andrews (1993)—so the computational burden here is less than that in Shao et al. (2015). Also, given the discussion in Bradlow and Weiss (2001, pp. 94–95) on the problems with using simulation-based critical values for CATs that may lead to conservative tests, the use of a permutation distribution as in Shao et al. (2015) is not straightforward for CATs and may lead to a conservative test for CATs.
Other Research Related to Change in Examinee Ability or Test Performance
Researchers such as Finkelman, Weiss, and Kim-Kang (2010); Glas and Dagohoy (2007); and Klauer and Rettig (1990) considered hypothesis tests for change/difference in the ability of an examinee between two testing occasions and two subsets of items, but the change point is assumed known in their cases—so the hypothesis testing problem becomes simpler than that considered here. Researchers such as Bolt, Cohen, and Wollack (2002) suggested IRT models for modeling speededness in nonadaptive tests, which is a type of change in test performance that is of major interest to test administrators; however, no IRT model known to the authors exist for modeling speededness for CATs where different examinees answer different sets of items.
Method
The Rationale Behind Applying TFCP for Person-Fit Assessment in CAT
A review of research on PFA for CAT suggests that the CUSUM-based PFSs successfully detect person misfit when the examinee ability has abruptly changed during the test. For example, The CUSUM-based PFSs are intended to detect score patterns that include a string of consecutive 1s or consecutive 0s (e.g., Meijer, 2002, p. 223), which is mostly associated with an abrupt change in the examinee ability. In the simulation studies in van Krimpen-Stoop and Meijer (2001, p. 212), person misfit was introduced by setting the true examinee ability as θ1 in the first half of a CAT but as θ1 + δ in the second half of the CAT. This addition of δ is effectively an abrupt change in the true ability or, a theta shift, in the middle of the test. Almost all the examples of person misfit in an operational CAT (such as possible distraction or loss of concentration, unfamiliarity in a section, fatigue or speededness) that are described in Meijer (2002) lead to an abrupt change in the examinee ability during the test.
Further, the change point and the examinee abilities before and after the change are unknown in PFA for CATs. Thus, given the widely accepted belief that TFCP are expected to be more appropriate than the CUSUM procedures when the parameters are unknown (e.g., Hawkins et al., 2003; Montgomery, 2013), the application of TFCP for PFA in CATs seems appropriate.
The examinee ability θ is the only model parameter (ψ) of interest in PFA for CAT because of the assumption of known item parameters. Because only dichotomous items are considered here, the fi(Xi; ψ) in this context is the probability mass function for the Bernoulli distribution with probability of success equal to Pi(θ). The null hypothesis is that θ has not changed during the CAT and the alternative hypothesis is that it has changed and the probability of success is equal to Pi(θ1) for the first (τ − 1) items but is equal to Pi(θ2) for the last (n − τ + 1) items.
Three PFSs that are based on TFCP and can be used to test the abovementioned hypothesis for CATs are suggested below.
A PFS Based on the Wald Test
Let us denote the true ability of an examinee underlying the scores on items 1 to j as θ1j and that underlying the scores on items (j + 1) to n as θ2j. Let

Let us define the statistic

Andrews (1993) and Csorgo and Horvath (1997) noted that the power of Wmax,n is small (because the corresponding critical values diverge to infinity) if one wants to detect a change near the first or last observations. Therefore, Andrews recommended that in computing Wmax,n, the maximum should be taken over n1 ≤ j ≤ n − n1 where n1 > 2, to increase the power of the test. Andrews recommended setting n1 to the integer nearest to 0.15n that restricts the estimated change point to roughly the middlemost 70% of the observations.
A PFS Based on the LRT
Researchers such as Finkelman et al. (2010) and Klauer and Rettig (1990) showed that the LRT statistic (e.g., Rao, 1973) for testing the null hypothesis θ1j = θ2j, when j is known, is given by


Let us now define the PFS

Shao et al. (2015) used a statistic very similar to the Lmax,n statistic for detecting speededness in nonadaptive tests and obtained the critical values of the statistic using a permutation distribution.
A PFS Based on the Score (or Lagrange Multiplier) Test
The score test statistic or Lagrange multiplier test statistic (e.g., Rao, 1973) for testing the null hypothesis that θ1j = θ2j, when j is known, is given by

Glas and Dagohoy (2007) and Klauer and Rettig (1990) used a PFS similar to Sjn for testing the null hypothesis that the examinee ability is the same over two subsets of items on a nonadaptive test.
Let us define the PFS

Asymptotic Null Distribution of Wmax,n, Lmax,n, and Smax,n
Andrews (1993) considered the case of a sequence of parametric models fi(Xi; ψ), where ψ is a vector of model parameters, fitted to a sequence of random variables X1, X2, …, Xn using the generalized method of moments estimators (of which MLE is a special case). For such a sequence of parametric models, if Wjn is a Wald-type test statistic, Ljn is an LRT statistic, and Sjn is a score/Lagrange multiplier test statistic, each for testing the null hypothesis that the parameter vector underlying observations 1 to j is equal to that underlying observations j + 1 to n and each computed using the generalized method of moments estimator, then, by theorem 3 (p. 838) of Andrews, the asymptotic null distributions of Wmax,n, Lmax,n, and Smax,n defined in Equations 12, 14, and 16 are the same and are given by the supremum of the square of a standardized tied-down Bessel process (e.g., Sen, 1981). Csorgo and Horvath (1997) and Gombay and Horvath (1996) provided a similar result for Lmax,n for independent random variables where the parameter vector is estimated by its MLE.
IRT models in the context of PFA for CATs are included in the family of distributions considered by Andrews (1993), with the ability parameter θ playing the role of the parameter vector ψ of Andrews and the probability mass function for the Bernoulli distribution with probability of success equal to Pi(θ) playing the role of fi(Xi; ψ) of Andrews. Further, the MLE of examinee ability is a special case of the generalized method of moment estimators (Andrews, 1993, p. 828) and the weighted likelihood estimate (WLE; Warm, 1989) of examinee ability is asymptotically equivalent to the MLE (Warm, 1989, p. 448). Thus, all the conditions of theorem 3 of Andrews (1993) are satisfied in the context of IRT models (both for nonadaptive tests and for CATs) when the MLE or WLE of ability is used to compute Wmax,n, Lmax,n, and Smax,n. Therefore, by theorem 3 of Andrews, the asymptotic null distributions of Wmax,n, Lmax,n, and Smax,n defined in Equations 12, 14, and 16 above are the same and are given by the supremum of the square of a standardized tied-down Bessel process (e.g., Sen, 1981).
Further Information on the New PFSs
Test statistics based on likelihood ratios are asymptotically the most powerful in general (e.g., Cox & Hinkley, 1974, pp. 312, 320) because of the Neyman–Pearson Lemma (e.g., Cox & Hinkley, 1974; Lehmann & Romano, 2005; Romero, Riascos, & Jara, 2015); from derivations in Andrews (1993) and Csorgo and Horvath (1997), the generalized LRT for testing the null hypothesis H0:θ1j = θ2j for all j versus the alternative of a change between items n1 and (n − n1) leads to the test statistic Lmax,n of Equation 14. Further, Wmax,n and Smax,n are asymptotically equivalent to Lmax,n (e.g., Andrews, 1993). Therefore, Lmax,n, Wmax,n, and Smax,n are expected to have satisfactory power to detect abrupt change.
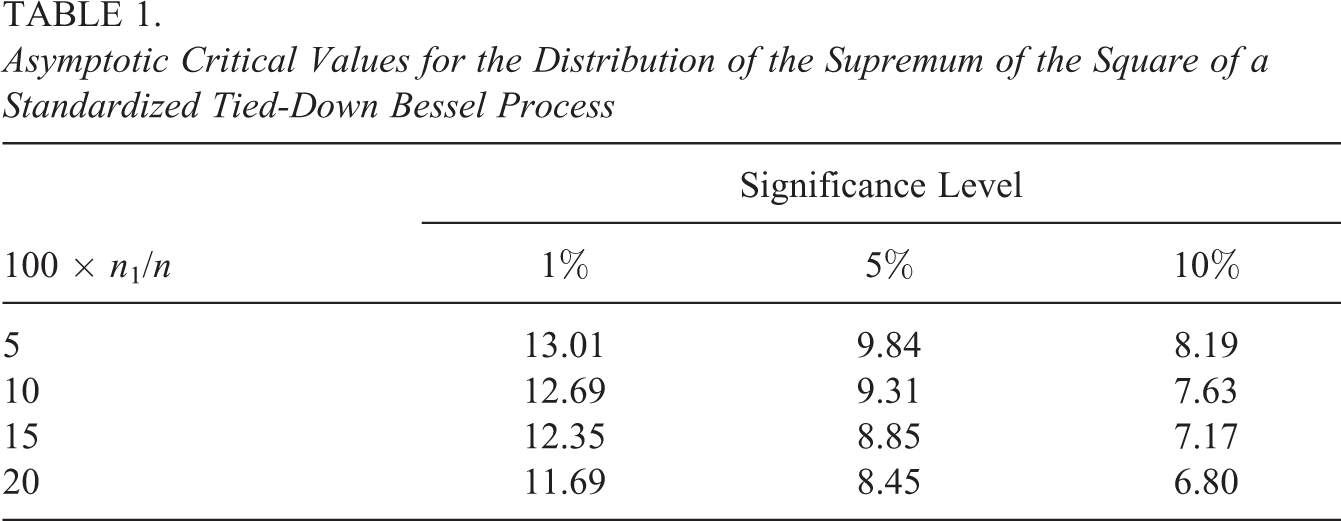
Computation of the critical values of the aforementioned null distribution is not straightforward. However, the critical values are provided in, for example, Sen (1981, p. 397), Andrews (1993, p. 840), and Estrella (2003). Table 1 provides the critical values for several common values of 100n1/n and significance level. For example, for 100n1/n = 15, which is recommended by Andrews (1993, p. 826), the critical values at 1% and 5% levels of significance are 12.35 and 8.85, respectively. In comparison, the critical values of a χ2 distribution with one degree of freedom at 1% and 5% levels are 6.63 and 3.84, respectively. The values in Table 1 are larger to adjust for the multiple hypothesis tests implicit in the application of any of Wmax,n, Lmax,n, and Smax,n.
Asymptotic Critical Values for the Distribution of the Supremum of the Square of a Standardized Tied-Down Bessel Process
Under the alternative hypothesis, each of Wmax,n, Lmax,n, and Smax,n would be large. For example, Wmax,n would be large under the alternative hypothesis because
The computation of Wmax,n and Lmax,n involves some ability estimates computed from only a few items. For example, for a 40-item test (i.e., n = 40),
Note that though they were discussed in the context of CATs, Wmax,n, Lmax,n, and Smax,n can also be applied to nonadaptive tests without any further adjustment and using the critical values provided in Table 1 because given a set of item scores, the likelihood of the scores for an examinee is computed in the same way for a CAT and a nonadaptive test. However, for nonadaptive tests, the traditional PFSs (e.g., those discussed in Meijer & Sijtsma, 2001) would usually have decent power, so that the TFCP-based statistics may not provide much benefit.
Simulations
A detailed simulation study, somewhat similar to that in van Krimpen-Stoop and Meijer, (2001), was performed to examine the Type I error rate and power of Wmax,n, Lmax,n, and Smax,n from several simulated CATs. The simulation study also involves a comparison of the new PFSs with four existing CUSUM-based PFSs: LARD (Bradlow et al., 1998), CT (Meijer, 2002),
Design of the Simulation Study
The simulation study involved four levels of test length (20 items, 40 items, 60 items, and 100 items) that represent short, moderate, long, and very long tests. Note that even though CATs usually lead to reduction in test length compared to P&P tests, CATs with 100 items are not rare; both Bradlow and Weiss (2001) and Meijer (2002) analyzed data from operational variable-length CATs in which some examinees receive more than 100 items, and the real data example later in this article involves a variable-length CAT in which some examinees receive more than 100 items and each examinee receives at least 60 operational items.
An item pool of 800 items was used in all simulations. The Rasch model, for which Pi(θ) is given by Equation 1 with ai = 1 and ci = 0, was used in the simulation. The true difficulty parameters of the items of the pool used in the simulation were a random sample of the estimated difficulty parameters of the items in the item pool in the real data example discussed in the next section.
For each examinee, the first 2 items of the CAT were selected as the items that have the maximum information at θ = 0. 9 Each latter item (2nd, 3rd, 4th, …, etc.) of the CAT was selected as the one that has maximum information at the ability estimated from the scores on the previous items. The WLEs of ability were used as ability estimates. 10
To compute the Type I error rates of the PFSs, examinee score patterns that fitted the Rasch model were generated using true examinee abilities that were simulated from the standard normal distribution. For any test length, the Type I error rate was computed from 100,000 model-fitting score patterns.
To compute the power of the PFSs, for each examinee, the true ability for the first half of the CAT (denoted as θ1) was simulated from the standard normal distribution and the true ability for the second half of the CAT was set as θ1 + δ, and then these true abilities were used to generate a score pattern from the Rasch model. Thus, the true change points were 11, 21, 31, and 51, respectively, for the four test lengths. The following values of δ were considered: −2, −1, 1, and 2. Positive values of δ indicate better performance in the second half while negative values of δ indicate worse performance in the second half. This strategy of introducing person misfit and these values of δ are exactly the same as that in van Krimpen-Stoop and Meijer (2001, p. 212). Note that ability estimates from an operational data set in a figure later in this article show that the values of 2 and −2 of δ are not unreasonable in practice. Under any simulation condition (characterized by a test length and a value of δ), the power was computed from 100,000 aberrant score patterns.
Computation
A Fortran program written by the author was used for all the computations including the computation of the ability estimates and the PFSs. The WLEs were computed using the Newton–Raphson algorithm. For each simulated score pattern, the WLE was computed and six PFSs (Wmax,n, Lmax,n, Smax,n, CT,
Type I Error Rates of Wmax,n, Lmax,n, and Smax,n
Table 2 shows the overall Type I error rates, expressed as percentages, for the TFCP-based PFSs at 1% and 5% significance levels. For a given significance level and test length, the overall Type I error rate of a TFCP-based PFS is the percentage of model-fitting score patterns for which the PFS is larger than the corresponding theoretical critical value from Table 1. The standard error corresponding to any reported value of Type I error rate is approximately 0.03% when the Type I error rate is near 1% and 0.07% when the Type I error rate is near 5%. 11
Overall Type I Error Rates (Expressed as a Percentage) From the Simulation Study

Table 2 shows that the Type I error rates of Wmax,n, Lmax,n and Smax,n are always smaller than or equal to the nominal level. As test length increases, the Type I error rates of all the statistics become closer to the nominal level. For short or moderately long tests (e.g., those with 40 items or smaller), the Type I error rates are considerably smaller than the nominal level, especially at 5% level, which would most likely result in the loss of power.
Power of Wmax,n, Lmax,n, and Smax,n
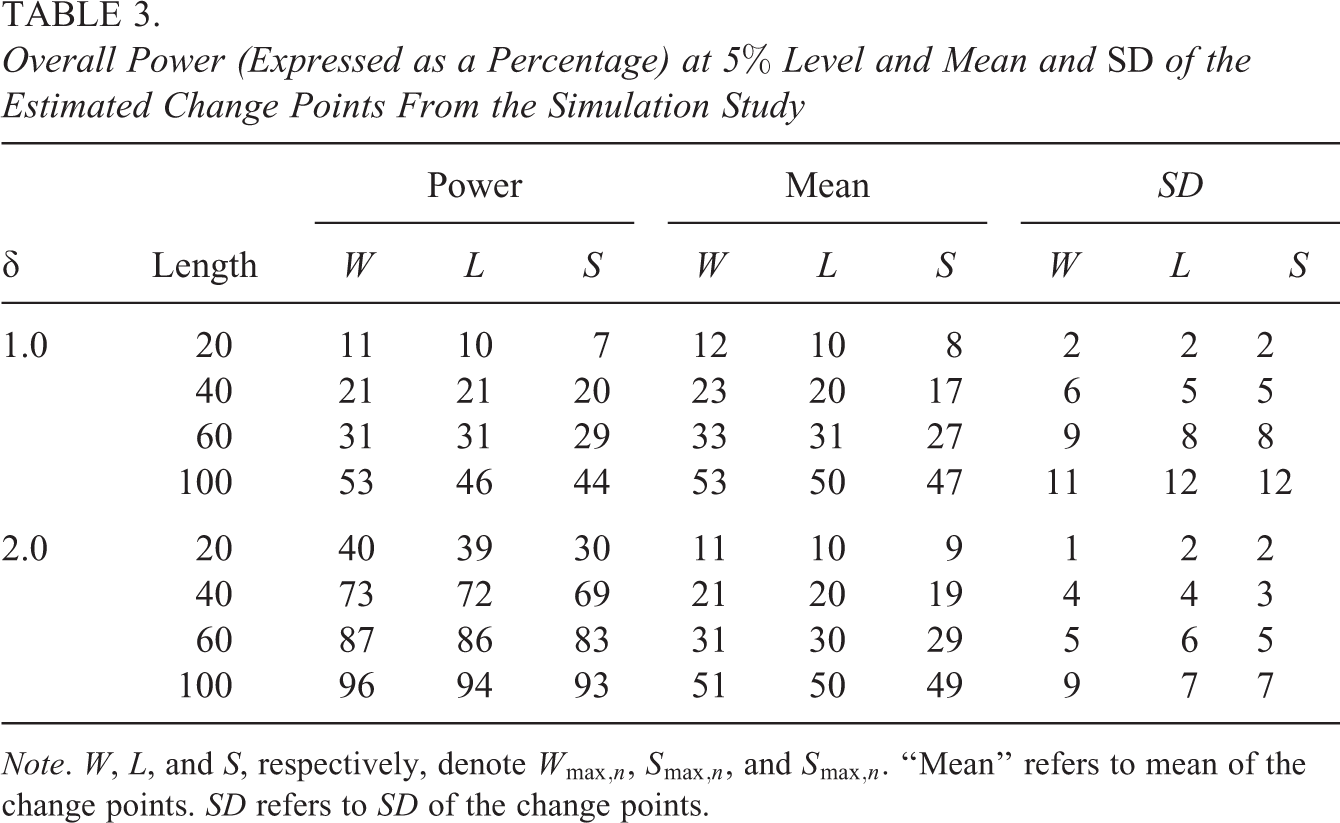
Table 3 shows the overall power at 5% level, expressed as a percentage, of Wmax,n, Lmax,n, and Smax,n. For a simulation condition, the overall power of a TFCP-based PFS is the percentage of aberrant score patterns for which the PFS is larger than the corresponding theoretical critical value from Table 1. The table also shows the mean and standard deviation of the estimated change points from the score patterns for which the corresponding PFS was significant at 5% level. It was found that the power for δ = d was almost identical to that for δ = −d. Therefore, the values of power for δ = −1 and δ = −2 are not reported and can be inferred from those for δ = 1 and δ = 2, respectively. The standard error associated with any reported value of power is smaller than 0.2%.
Overall Power (Expressed as a Percentage) at 5% Level and Mean and SD of the Estimated Change Points From the Simulation Study
Note. W, L, and S, respectively, denote
Table 3 shows that the TFCP-based PFSs have modest power for short tests and δ = 1, but decent power for long tests and δ = 2. The Wmax,n statistic seems to be the most powerful, followed by Lmax,n, among the three TFCP-based PFSs in all cases. This result agrees with the result for linear models that the Wald statistic is larger than the LR statistic, which is larger than the score statistic (e.g., Breusch, 1979). Also, the estimated change points seem to be accurate on average, especially for δ = 2. For example, for 40-item tests, the true change point is 21 and the average of the estimated change points for the three PFSs is 19, 20, or 21 for δ = 2.
Comparison of the TFCP-Based and CUSUM-Based PFSs
The Type I error rates of the new TFCP-based PFSs (Table 2 of this article) differ from those of the the false alarm rate, F(c), which is the proportion of times when the PFS for a model-fitting score pattern is larger than c and the hit rate, H(c), which is the proportion of times when the PFS for a misfitting score pattern is larger than c.
Then, a graphical plot is created in which F(c) is represented on the x-axis, H(c) is represented on the y-axis, and a line joins {F(c), H(c)} for several values of c. The line is referred to as the ROC curve. The closer the ROC curve is to the upper left corner (that means a larger area under the ROC curve), the more powerful is the PFS for a given Type I error rate.
Figure 1 shows a comparison of the ROC curves for the TFCP-based PFSs to those for the CUSUM-based PFSs. The ROC curves for δ = 1 (left panels) and δ = 2 (right panels) are shown for 20-item tests (top row), 40-item tests (middle row), and 60-item tests (bottom row). The ROC curves were very close for the three TFCP-based PFSs (with that for Wmax,n having the largest area by a small margin)—so only the curve for Wmax,n (denoted as “Change Point”) among them is shown (using a solid line). The ROC curve for CLR (Armstrong & Shi, 2009a) is denoted as “CUSUM-LR” and shown using a short dashed line. The ROC curve for CT with λ
i
= 1 (e.g., Meijer, 2002; Tendeiro & Meijer, 2012) is denoted as “CUSUM-Residual” and shown using a dotted line. The ROC curve for
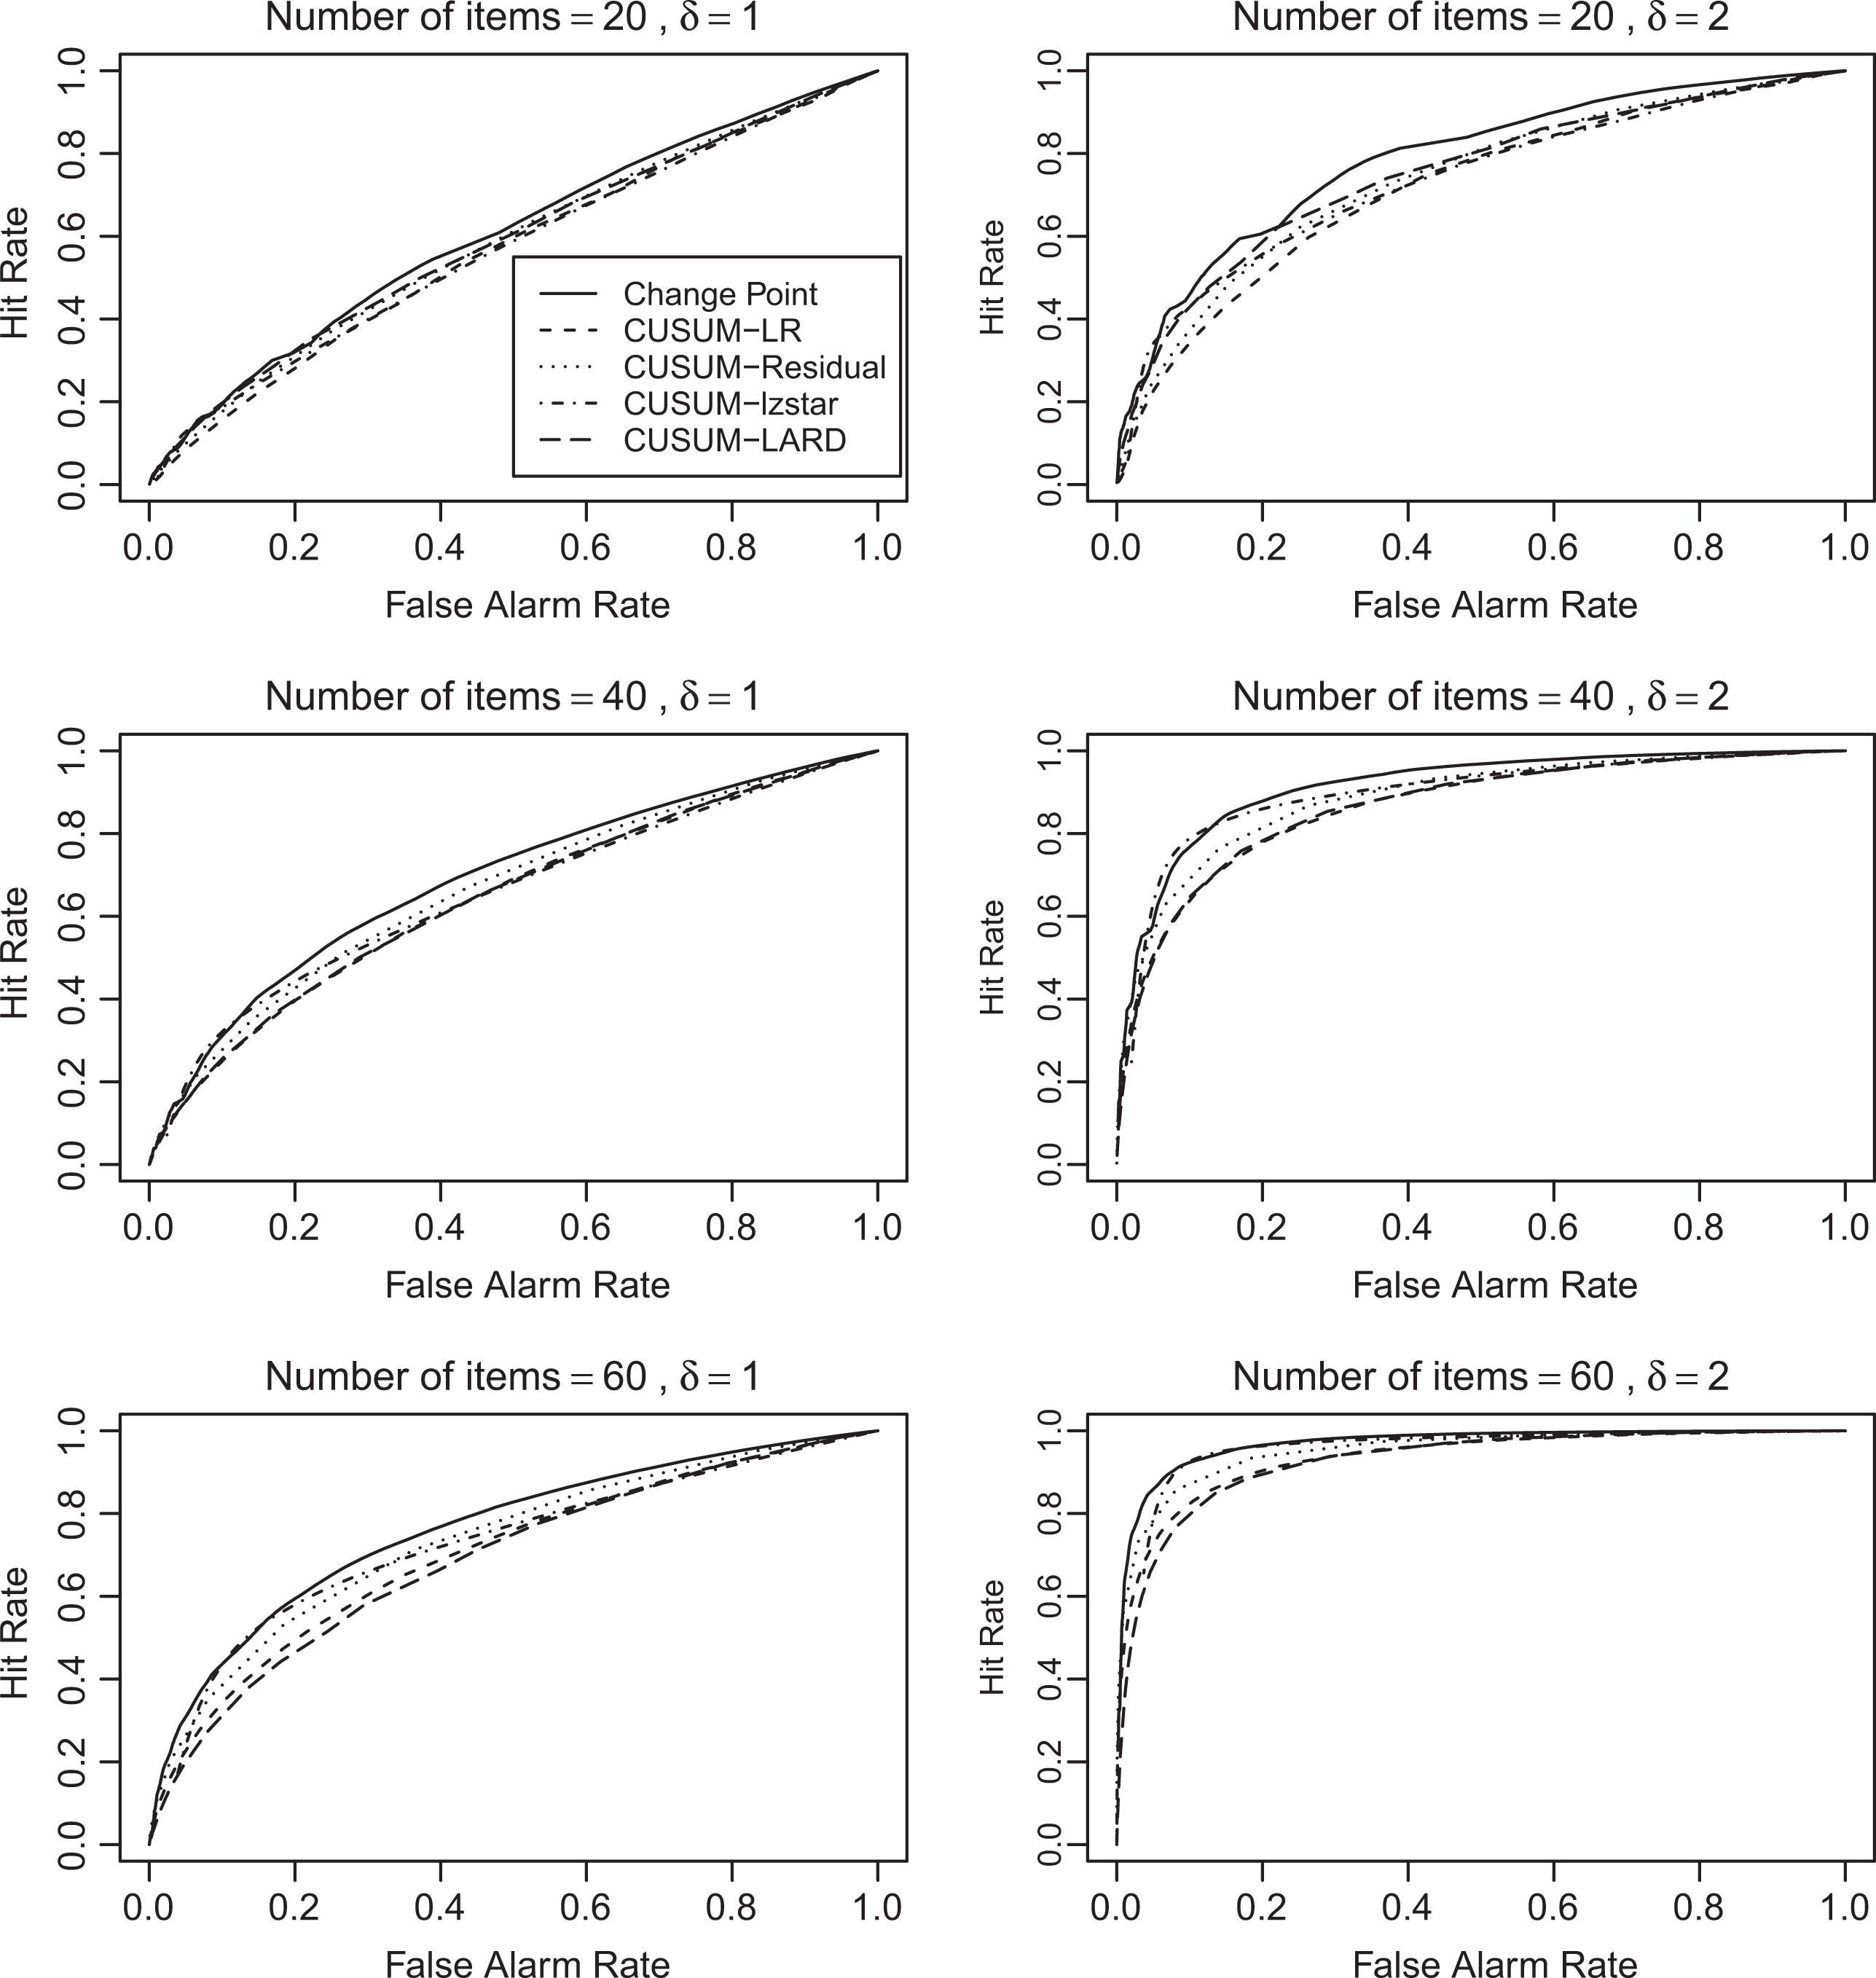
Receiver operating characteristic curves for three test lengths.
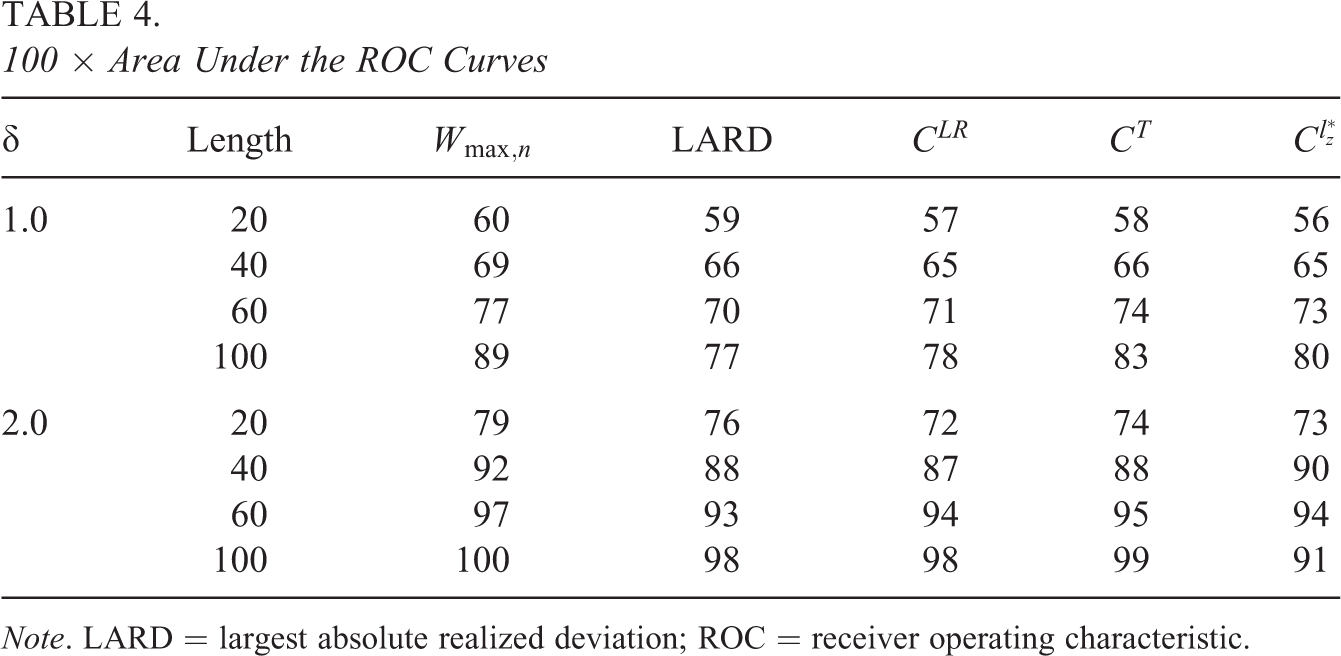
100 × Area Under the ROC Curves
Note. LARD = largest absolute realized deviation; ROC = receiver operating characteristic.
Figure 1 and Table 4 show that the area for each of the TFCP-based PFSs is slightly larger than or equal to that for each of the CUSUM-based PFSs. Thus, overall, the TFCP-based PFSs are slightly more powerful compared to the CUSUM-based PFSs. Among the CUSUM-based PFSs, LARD (Bradlow et al., 1998) is the most powerful for 20-item tests, but CT and
Thus, any TFCP-based PFS is more powerful than each CUSUM-based PFS in the simulations here. This conclusion agrees with the statement in Montgomery (2013) and Hawkins et al. (2003) that TFCP are expected to be more appropriate than CUSUM-based procedures in detecting a change when the model parameters are unknown.
To understand the practical implication of the larger power of the TFCP-based PFSs compared to the CUSUM-based PFSs, let us consider a data set that includes 70,000 examinees, just like our real data example discussed in the next section. Let us consider that all those examinees took a 60-item CAT. Let us also assume that in the data set, no actual misfit is present (i.e., δ = 0) for 90% examinees, a misfit with δ = 1 is present for 5% examinees, and a misfit with δ = 2 is present for 5% examinees. Table 5 shows the number of examinees with each value of δ and the expected number of flags for Wmax,n and CT at 5% significance level for this data set. The numbers were computed from the information provided by Figure 1; for example, the expected number of flags for Wmax,n for δ = 2 is 3,010 because Figure 1 indicates that the power of Wmax,n for 60-item tests at 5% level is about 0.86 (i.e., 3,500 × 0.86 = 3,010). Table 5 indicates that while both Wmax,n and CT incorrectly flag 3,150 examinees (those with δ = 0) because the Type I error rates of both of them are close to the nominal level, Wmax,n correctly flags 455 examinees (those with δ = 1 or δ = 2) more than CT.
The Number of Flags for

Further Simulations With Other Item Pools
The above simulations were repeated with two other item pools. One of these is simulated exactly as in van Krimpen-Stoop and Meijer (2001) that is based on the two-parameter logistic model and has a larger spread of item difficulties; the other (item pool) was simulated from the 3PLM. The TFCP-based PFSs were more powerful than the CUSUM-based PFSs in simulations with these item pools as well although the Type I error rate, power, and areas under the ROC curve were slightly different from those reported in Tables 2 through 4 and the comparative performance of the CUSUM-based PFSs was different (e.g., CLR was most powerful among these) from the above simulations. The TFCP-based PFSs were also computed with 100n1/n = 20 and 25; the Type I error rates of them were close to those in Table 2 and the values of power were slightly larger than those in Table 3.
Further Simulations With Gradual Changes
The above simulations involve only an abrupt change in the examinee ability, where the true ability changes in the middle of the test by 1 or 2. Therefore, some additional simulations were performed where the true ability changes gradually. The following three types of gradual change were considered: The true ability (θ1) for the first item is a number randomly drawn from a standard normal distribution, but then the true ability gradually increases till it becomes θ1 + δ for item number The true ability (θ1) for the first 75% items is a number randomly drawn from a standard normal distribution, but then the true ability gradually decreases till it becomes θ1 − δ for the last item of the test, where δ is 1.0 or 2.0; for example, if θ1 = 0 and δ = 1, then, on a 60-item test, the true ability is 0 for Items 1–45, but it decreases by about 0.07 on each item between Item 46 and Item 60 till the true ability is equal to −1.0 for Item 60. This simulation is intended to replicate a gradual tiredness effect. The true ability (θ1) for the first 25% items is a number randomly drawn from a standard normal distribution, but then the true ability gradually increases or decreases till it becomes θ1 + δ on item number
An analysis using ROC curves shows that the TFCP-based PFSs were slightly less powerful than the CUSUM-based PFSs in the first of the above three cases but were more powerful than the CUSUM-based PFSs in the other two cases. 13
Overall Conclusions From the Simulations
The simulation studies show that the new PFSs have satisfactory Type I error rates and are more powerful overall compared to existing PFSs (that are based on CUSUMs) in a variety of situations. These findings, together with the fact that their critical values can be found from a table, make the new PFSs quite attractive.
Application to Data From an Operational High-Stakes CAT
The Data Set and the Analysis
The TFCP-based PFSs were applied to a real data set that includes information on about 70,000 examinees who took a large-scale high-stakes health-care licensure examination over a few months in 2015. The examination has been computer adaptive in the last several years and currently is a variable-length CAT. Each examinee is administered a minimum of 60 operational items and a maximum of 250 operational items; each examinee is also administered 15 pretest items. The unidimensional Rasch model is used for item calibration and scoring. The model has been found to fit the data adequately in a variety of analysis performed by psychometricians who work on the examination and by external researchers. A Bayesian ability estimate is used initially and the MLE of ability is used in the later part of the examination. The item selection mechanism is based on the constrained CAT procedure of Kingsbury and Zara (1989); first, the content area of the item is chosen; then, to control item exposure, an optimal item is randomly selected from 15 items that provide the most information at the current ability estimate. The current cut score used for passing is 0.00 in the logit scale. The pass–fail decision is based on a 95% confidence interval around the examinee’s current ability estimate. A pass–fail decision is made for an examinee as soon as the examinee has answered at least 60 operational items and the 95% confidence interval does not include the cut score; the examinee continues the test when the confidence interval includes the cut score. Special pass–fail decisions are used if the examinee runs out of time or has taken the maximum number of items. The item pool that was used with the examinees in this data set included a large number of dichotomously scored items 14 each of which belongs to one of the eight content areas; most of the items are four-option multiple-choice items, but some items are of other types such as items that require an examinee to select all the options that apply, items that require filling in a blank, and items that require an examinee to specify an area on a figure. On average, the examinees in the data set took 126 items. Among the examinees in the data set, about 75% passed the examination.
The operational item parameters were used for assessing person fit. The pretest items were excluded from the computations. The MLE of ability, restricted between −4.5 and 4.5, was used to compute the PFSs.
Results
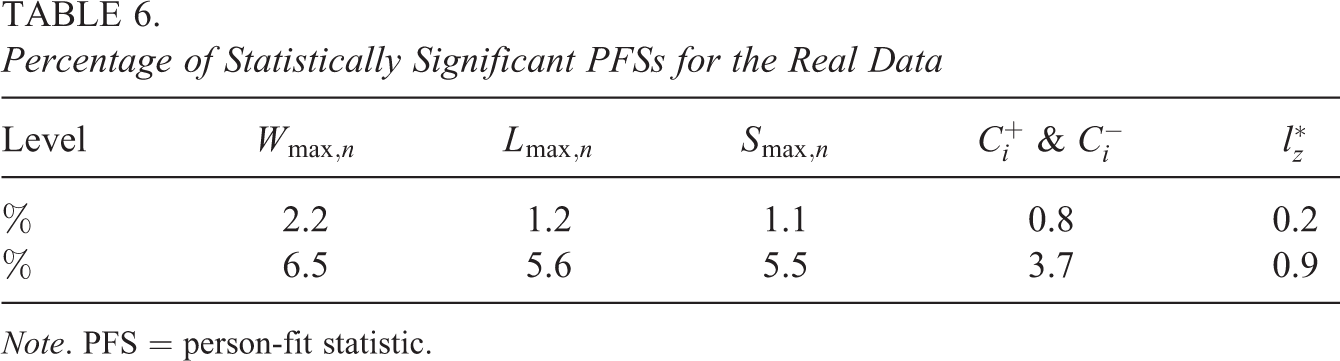
Table 6 provides the percentage of statistically significant p values for Wmax,n, Lmax,n, Smax,n, and
Percentage of Statistically Significant PFSs for the Real Data
Note. PFS = person-fit statistic.
The extent of person misfit seems to be minimal for the data set, as the percentage of significant PFSs is slightly larger the nominal level for the TFCP-based PFSs and smaller than the nominal level for the CUSUM-based PFSs. While this could be due to the low power of the PFSs, it could also be due to the good fit of the Rasch model to the data set.
Figure 2 shows the score patterns of four examinees whose Wmax,n, Lmax,n, and Smax,n were found significant at 1% level. The item number is shown along the x-axis, and the item score (0 or 1) is shown as a hollow circle along the y-axis. Thus, for example, a hollow circle near the top of a panel represents a score of 1. The estimate of the change point is shown as a vertical dashed line. For example, the change point on the top left panel is 27. The title of each panel shows two ability estimates (MLE up to the first decimal place): one from the items up to the estimated change point and the other from the items after the estimated change point. The CUSUMs based on
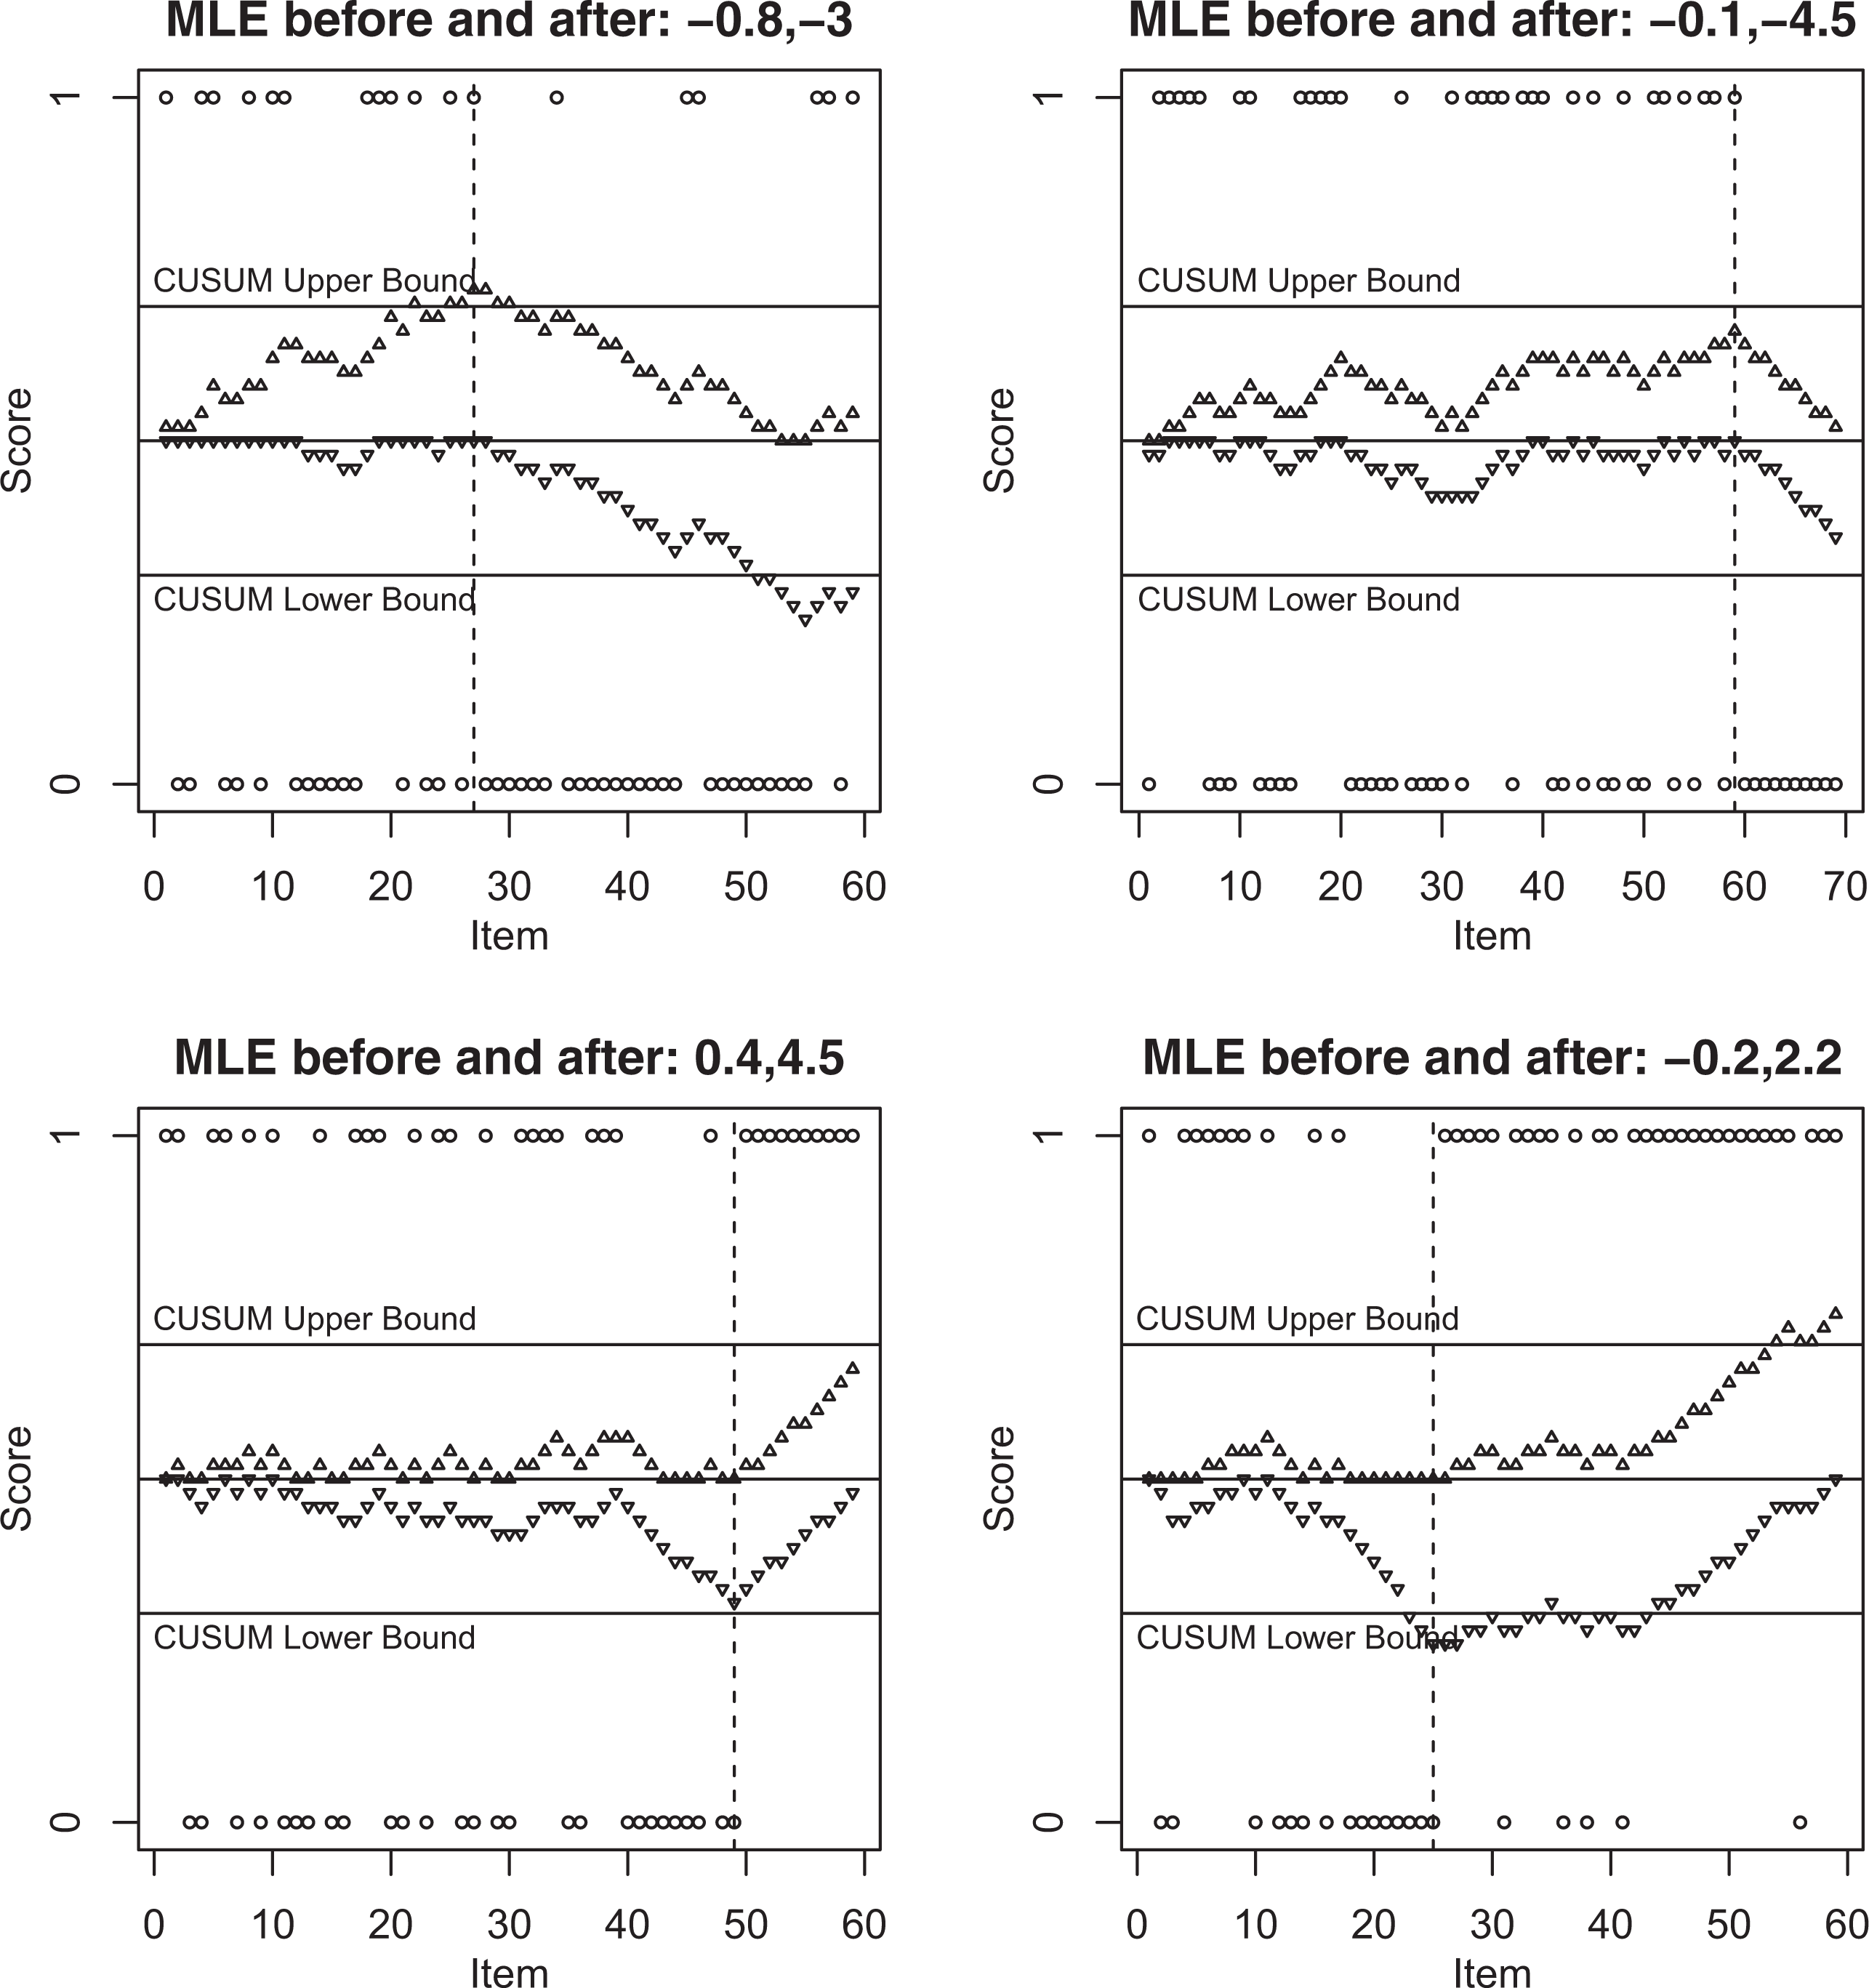
Score patterns of four examinees.
Figure 2 shows that the estimated change points seem to represent the change in performance of the examinees quite accurately. The top two panels represent examinees whose performance dropped substantially during the test and the MLE after the estimated change point is smaller by 2.2 or more compared to that up to the estimated change point. The bottom two panels represent examinees whose performance improved substantially during the test and the MLE after the estimated change point is larger by 2.4 or more compared to that up to the estimated change point. The examinee represented in the bottom right panel most likely had trouble settling in or warming up (a phenomenon mentioned by, e.g., Meijer, 2002, p. 227). Thus, the new PFSs seem to perform reasonably well for the real data set.
The CUSUMs show misfit for only two of these four examinees in Figure 2—those corresponding to the top left and bottom right panels. All the responses after the estimated change points for the other two examinees were incorrect (top right panel) or correct (bottom left panel) and the TFCP-based PFSs correctly identified them as having misfit; the number of responses after the estimated change point were not large enough to allow the CUSUMs to go outside the bounds even though they changed directions at the estimated change points and were close to the bounds for the last item.
Conclusions
This article suggests three PFSs based on TFCP (e.g., Andrews, 1993; Chen & Gupta, 2012; Csorgo & Horvath, 1997; Hawkins et al., 2003; Montgomery, 2013) for use with CATs. The Type I error rates of the PFSs, when used with their theoretical critical values obtained from Andrews (1993), were found to be smaller than or equal to the nominal level in a simulation study. The values of power of the PFSs were found to be satisfactory for long tests and were larger than those of several CUSUM-based PFSs in a comparison using ROC curves. Because there exist several long operational CATs (such as those whose data were analyzed in this article or by Bradlow et al., 1998; Meijer, 2002), the PFSs, when used with their theoretical/asymptotic critical values, promise to be useful in practice. The power may be slightly larger if one uses the PFSs along with null distributions obtained from bootstrap simulations (e.g., Sinharay, 2016) or permutation distributions (e.g., Bradlow et al., 1998), especially for short or moderately long tests. However, the use of a bootstrap simulation or permutation distribution would lead to more computations and may be problematic as noted by Bradlow and Weiss (2001, pp. 94–95).
The new PFSs were discussed in the context of CATs, but they can be applied to nonadaptive tests as well. For example, they can be applied to detect speededness in nonadaptive tests as in Shao et al. (2015) or to detect other types of abrupt changes in nonadaptive tests.
A major benefit of the new PFSs is that they provide an estimate of the change point, that is, of the item after which the examinee shows aberrant behavior. These estimates may provide useful information regarding speededness, fatigue, warm-up effect, and so on, depending on the nature of the aberrant behavior. For example, for a CAT that is speeded to a majority of examinees, the estimated change points of the examinees may suggest an appropriate reduction in length that would make the CAT speeded to a smaller number of examinees. Meijer (2002, p. 231) mentioned that a benefit of the CUSUM procedure is that the CUSUM plots make it immediately clear where the aberrant behavior is situated. The new TFCP-based PFSs go one step further by providing a statistical estimate of the change point without the need to manually examine a plot and thus could lead to a substantial saving of resources.
Among the three new PFSs, which are equivalent asymptotically, the power of the PFS based on the Wald test was largest and that based on the score test was smallest, both by a small margin. However, this relationship could be an outcome of the item parameters. It may be wise to apply all of these tests in a real application and combine information from them.
The new PFSs are appropriate when an investigator wants to detect abrupt changes such as warming up effects, speededness/fatigue toward the end, and item preknowledge on a set of consecutive items in the behavior of the examinees. However, these statistics may not always be the most appropriate for detecting aberrant behavior in a CAT. For example, if one wants to detect misfit due to test fraud such as item memorization, item preknowledge, or item collusion in a CAT and the items involving fraud are scattered throughout the CAT, the PFSs suggested in this article may lack power and statistics such as those suggested by McLeod and Lewis (1999) and McLeod, Lewis, and Thissen (2003) may be more appropriate.
In an application of the new PFSs to a data set, the PFSs and the estimated change points associated with the new PFSs may be examined further. For example, it is possible to try to determine the cause of the misfit of those who were flagged by the PFSs. An examinee like the one corresponding to the bottom right panel of Figure 2 may have been flagged because of a warm-up effect and an examinee like the one corresponding to the top right panel of Figure 2 may have been flagged because of speededness. The pattern for the examinee represented in the bottom left panel of Figure 2 is hard to explain—it is possible to investigate this pattern further. An investigator should also examine if the extent of misfit and the pattern of the estimated change points are related to the characteristics of the examinees (such as race and ethnicity) and items (such as item content).
Statistical indices for determination of person misfit may be useful for providing confirming evidence of aberrant behavior when evidence from other sources (such as reports from the teachers/proctors in testing centers on examinee behavior) also exist, but the evidence provided by statistical indices is insufficient by itself. For example, Hanson, Harris, and Brennan (1994) commented, in the context of detection of answer copying, that no statistical method on its own can provide conclusive proof that copying occurred (p. 25); the comment is true about other aberrant examinee behavior as well. Researchers such as Tendeiro and Meijer (2014, p. 257) and Meijer, Egberink, Emons, and Sijtsma (2008) recommended complementing PFSs with other sources of information such as seating charts, video surveillance, or follow-up interviews.
There are several further limitations of this article and, consequently, several related topics that may be investigated further. First, only one change point was considered and detected in this article—it is possible to consider and detect multiple change points (an example would be warm-up effect early on the CAT and fatigue at the end) in further research. Note that the power to detect multiple change points is expected to be smaller than that reported, for example, in Table 3. It was found in some limited simulations that if there is more than one true change point, then the new PFSs would usually estimate the change point to be one of the true change points depending on the nature of the true changes. For example, if the true ability is 0 between Items 1 and 15, 1 between Items 16 and 45, and −1 between Items 46 and 60, then the statistics would estimate the change point to be Item 46 as that allows the maximum difference of the ability estimated from the items before change (about 0.5) and those after change (about −1). Second, it is possible to perform a change-point analysis using response times, or, using both item scores and response times. Third, in the simulations in this article, the maximum information method was used for item selection and no exposure-control method was used; other item selection methods and some exposure control methods may be used in further simulation studies. Fourth, this article considered tests with only dichotomous items and it is possible to consider tests that include all or some polytomous items in future research—the PFSs suggested here can be easily extended to such tests. Fifth, PFA for a data set usually involves hypothesis testing for several examinees. Therefore, in practical applications of PFA, an investigator may want to adjust for multiple comparisons by, for example, controlling the false discovery rate as in Shao et al. (2015). Finally, further research such as Conrad et al. (2010); Conijn, Emons, and Sijtsma (2014); Ferrando (2012); Meijer et al. (2008); and Meijer and Tendiro (2014) should explore how PFA and the new PFSs can be applied and used in practice, especially in high-stakes CATs.
Footnotes
Author’s Note
Any opinions expressed in this publication are those of the author and not necessarily of Pacific Metrics Corporation.
Acknowledgments
The author would like to thank Li Cai, the editor, and the two anonymous reviewers for several helpful comments that led to a significant improvement of the article. The author would also like to thank Ada Woo and Doyoung Kim for their helpful comments.
Declaration of Conflicting Interests
The author(s) declared no potential conflicts of interest with respect to the research, authorship, and/or publication of this article.
Funding
The author(s) received no financial support for the research, authorship, and/or publication of this article.