
Abstract
In the absence of clear incentives, achievement tests may be subject to the effect of slipping where item response functions have upper asymptotes below one. Slipping reduces score precision for higher latent scores and distorts test developers’ understandings of item and test information. A multidimensional four-parameter normal ogive model was developed for large-scale assessments and applied to dichotomous items of the 2011 National Assessment of Educational Progress eighth-grade mathematics and reading tests. The results suggest that the probability of slipping exceeded 5% for 47.2% and 51.1% of the dichotomous mathematics and reading items, respectively. Furthermore, allowing for slipping resulted in larger item discrimination parameters, increased information in the lower-to-middle range of the latent trait, and decreased precision for scores one standard deviation above the mean. The results provide evidence that slipping is a factor that should be considered during test development and construction to ensure adequate measurement across the latent continuum.
Introduction
Sometimes students with the necessary knowledge and skills to succeed on an easier task make a mistake. There are several reasons why high-performing test takers might “slip” and mistakenly record an incorrect answer. First, slipping could be attributed to test takers’ careless errors. In the words of Barton and Lord (1981), “Even a high-ability student may make a clerical error in answering an easy item” (p. 2). Second, slipping could be a psychometric characteristic of items (i.e., the item response function [IRF] has an upper asymptote below one). Third, slipping could be affected by test takers’ motivation where in the absence of clear incentives, high-performing students may not respond to all items with maximal effort. This article takes a psychometric perspective and uses the term slipping to refer to situations where the upper asymptote of the IRF is less than one.
The primary cause of slipping is not always known, but what is clear is that slipping is an important methodological issue because it reduces precision for scores in the upper range of the latent continuum (Culpepper, 2016; Ogasawara, 2012; Reise & Waller, 2003; Waller & Reise, 2010). In fact, the reduction in score precision due to slipping affects decisions of both test developers and test users. For instance, in some cases, test developers assemble items to accurately measure performance across the latent continuum. In these cases, neglecting the effects of slipping could distort test developers’ understandings of measurement precision. That is, not accounting for slipping may yield an overly optimistic understanding of how well a collection of items measure higher achievement scores. Additionally, slipping can impact policymakers’ decisions and inferences from standardized test scores. In fact, prior empirical research suggests students may not be motivated to maximize their performance on the National Assessment of Educational Progress (NAEP) reading items (Braun, Kirsch, & Yamamoto, 2011; Brophy & Ames, 2005; Debeer, Buchholz, Hartig, & Janssen, 2014; O’Neil, Abedi, Miyoshi, & Mastergeorge, 2005; O’Neil, Sugrue, & Baker, 1995; Wise & DeMars, 2005). The lack of motivation could translate into slipping, which would affect policymakers’ ability to make inferences regarding higher reading proficiency levels.
Slipping is a critical issue to account for when constructing tests and formulating policy. The purpose of this article is 2-fold: (1) to develop new methodology for large-scale testing programs that accounts for slipping and (2) to provide new evidence regarding the prevalence of slipping on low-stakes, large-scale achievement tests by reanalyzing data from the 2011 NAEP mathematics and reading assessments. The remainder of this article has four sections. The first section reviews Barton and Lord’s (1981) four-parameter model (4PM) and provides examples of how slipping affects IRFs and item information functions. The second section describes a multidimensional version of the four-parameter normal ogive model (4PNO; Culpepper, 2016) for large-scale testing programs. Specifically, the developed 4PNO model is tailored for large-scale assessments where some item responses are missing by design (i.e., missing completely at random; see Patz & Junker, 1999; Rubin, 1976) to minimize the burden on students. The multidimensional 4PNO model discussed in this article is designed for large-scale assessments, which are typically constructed under the assumption of simple structure where latent variables load on a single item. The third section reports an application of the multidimensional 4PNO model to the 2011 eighth-grade NAEP mathematics and reading assessments. Slipping may be expected on the NAEP exams, given that test takers have minimal incentives to maximize performance. NAEP has been historically relevant for education researchers and policymakers, and uncovering evidence of slipping is important for understanding score precision. The third section reports item parameters and discusses how estimating the 4PNO model results in differences in expected score precision across the latent achievement continuum. The last section discusses the results for methodologist and practitioners and provides concluding remarks.
Slipping and the 4PM
This section provides a brief overview of the 4PM. The first subsection discusses the antecedents and dissemination of the 4PM in applied research, and the second subsection describes the 4PM model.
Antecedents and Dissemination of the 4PM
In a classic study, Barton and Lord (1981) examined slipping on the high-incentive, SAT mathematics (SAT-M), SAT verbal (SAT-V), graduate record examination (GRE) standardized admissions tests in addition to the Advanced Placement mathematics exam. However, the results of Barton and Lord’s research did not support the presence of systematic slipping, and one consequence of their study could be that the 4PM subsequently received less attention in the educational measurement literature.
More recently, the 4PM has received renewed interest in several domains. First, the 4PNO has been considered in research on computerized adaptive testing (CAT) (Rulison & Loken, 2009). For instance, Chang and Ying (2008) showed that ability estimates from CATs are subject to underestimation for examinees who miss a few items at the beginning of the test. Subsequent CAT research argued for the 4PM to improve ability estimation in the presence of early careless errors (Liao, Ho, Yen, & Cheng, 2012; Rulison & Loken, 2009). Second, research used the 4PM in the measurement of psychopathology (Reise & Waller, 2003; Waller & Reise, 2010). In fact, Reise and Waller (2003) were the first to demonstrate the utility of the 4PM for psychopathology research, and recent studies successfully applied the 4PM to the measurement of adolescent delinquency (Loken & Rulison, 2010), bullying (Culpepper, 2016), low self-esteem (Waller & Reise, 2010), and subscales of the adolescent version of the Minnesota Multiphasic Personality Inventory (MMPI; Reise & Waller, 2003). Third, renewed interest in the 4PM encouraged the development of new estimation strategies (Culpepper, 2016; Feuerstahler & Waller, 2014; Loken & Rulison, 2010).
The 4PM
This subsection reviews the 4PNO and comments on the effect slipping has on response probabilities and measurement precision. Suppose y is a dichotomous variable and θ is the underlying latent trait. The 4PNO IRF for item j is

where
Consider, for example, IRFs for two items from the 2011 eighth-grade NAEP mathematics and reading assessments. Figure 1 plots IRFs for mathematics item “M151901,” and Figure 2 includes an example of reading item “R058509.” The NAEP documentation indicates a three-parameter model is used for item M151901, and Figure 1 compares the status quo model with a 4PNO fit where the probability of slipping equals .14. Figure 1 shows how fixing the upper asymptote to one with the 3PNO reduces the item slope to 0.66, whereas the item slope for the 4PNO is 1.02. Similarly, the slipping probability for reading item R058509 equaled .24, which suggests that students with higher levels of reading achievement had at most a .76 probability of a correct response (i.e., the upper asymptote was reduced by 24%). Furthermore, the estimated item slope for the status quo 2PNO model was .47 in comparison to an item slope of .96 for the 4PNO. The examples in Figures 1 and 2 show how estimating slipping alters the IRF and, as shown next, reduces score precision for larger θ values.
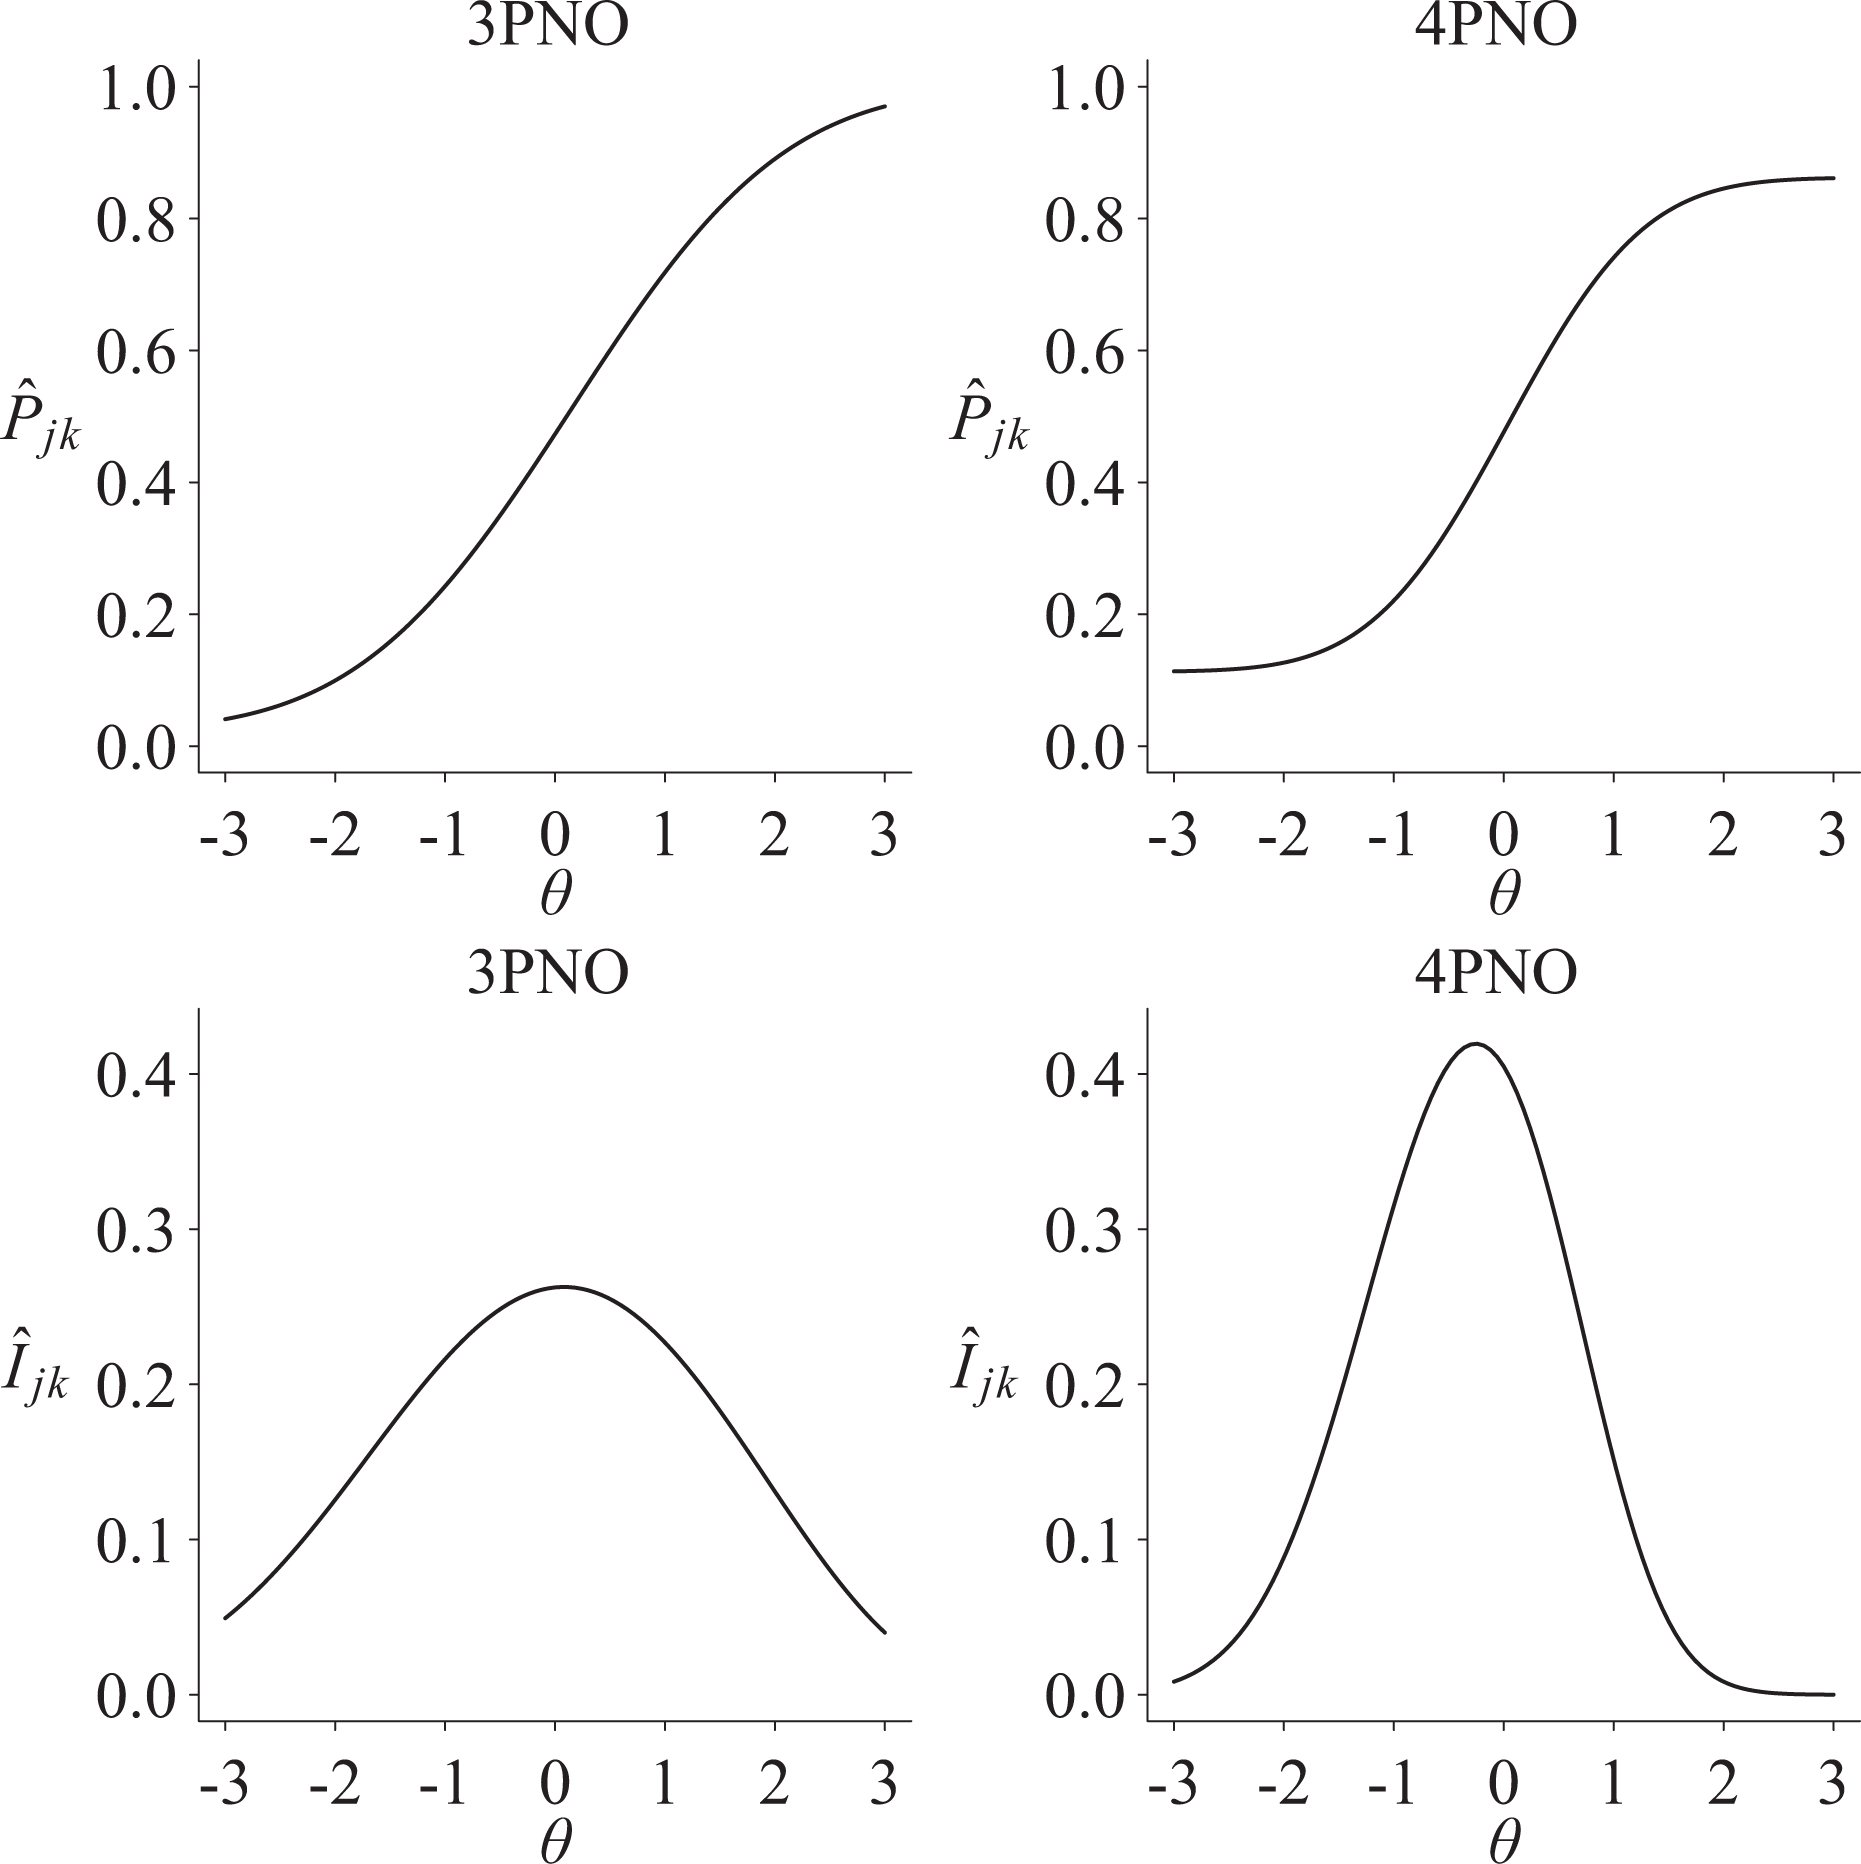
Estimated item response function and information function for 2011 eighth-grade National Assessment of Educational Progress (NAEP) mathematics item M151901 for the four-parameter normal ogive (4PNO) and non-4PNO models. The non-4PNO model uses a three-parameter model as specified in the NAEP data documentation. The estimated three-parameter normal ogive item parameters are
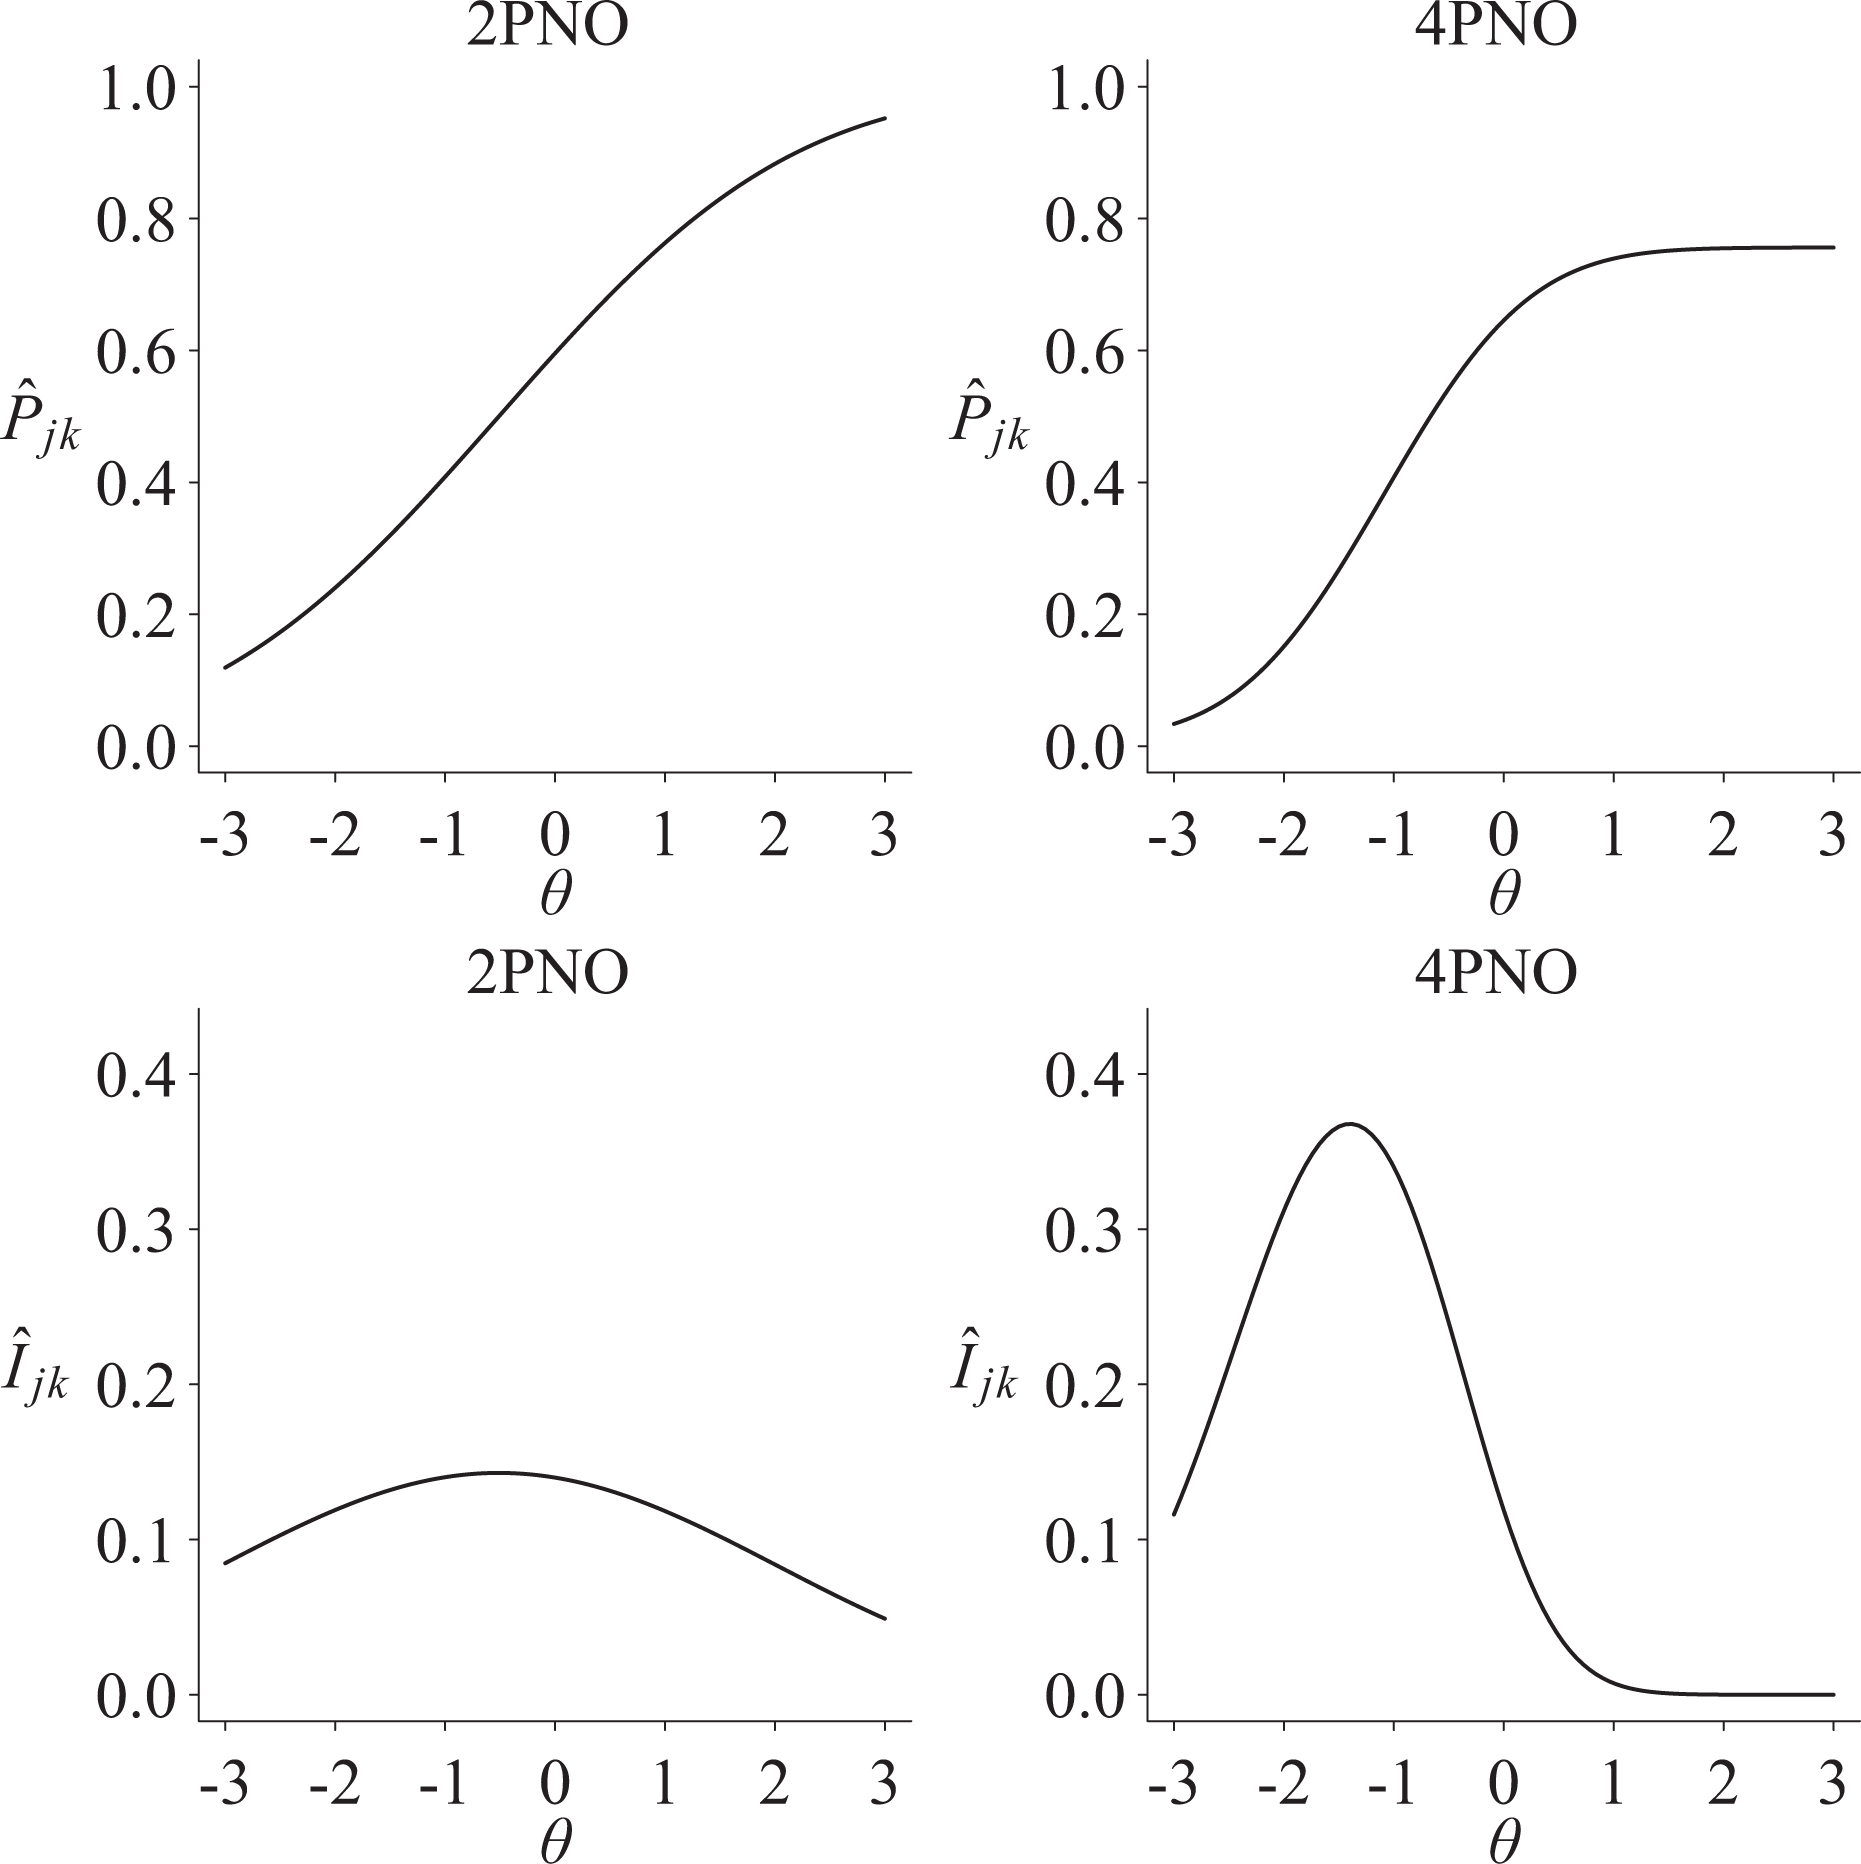
Estimated item response function and information function for 2011 eighth-grade National Assessment of Educational Progress (NAEP) reading item R058509 for the four-parameter normal ogive (4PNO) and non-4PNO models. The non-4PNO model uses a two-parameter model as specified in the NAEP data documentation. The estimated two-parameter normal ogive item parameters are
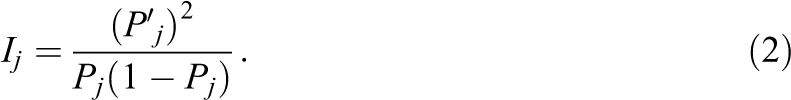
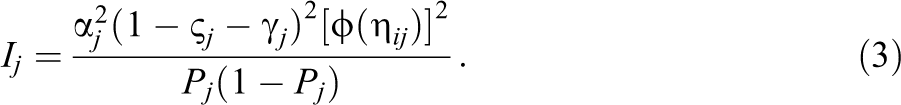
A benefit of the item response theory (IRT) framework is that the Fisher information function for item j, Ij, provides insight regarding score precision for a given θ as a function of item parameters. The presence of a nonzero slipping probability reduces information for larger θ values. In fact, Magis (2013) derived the item information for the 4PM by noting that the general equation for item information for a dichotomous IRT model is
The first derivative of the 4PNO IRF with respect to θ is
Furthermore, denote the test information by
Figures 1 and 2 provide examples of how Ij differs among the 2PNO, 3PNO, and 4PNO models. For instance, Figure 1 shows that information for item M151901 was smaller for the 4PNO versus the 3PNO for values of
4PNO Bayesian Formulation for Multidimensional, Large-Scale Assessments
This section presents the Bayesian formulation for the multidimensional 4PNO model for dichotomous items. Let
Large-scale assessments score
Recall that the application of a balanced incomplete block (BIB) design (Frey, Hartig, & Rupp, 2009; Gonzalez & Rutkowski, 2010; Mislevy, Johnson, & Muraki, 1992) in large-scale assessments implies that individual i does not respond to all items, so that elements of yi are missing completely at random. Accordingly, define a missing data indicator
In large-scale assessments, such as NAEP and TIMSS, items are developed based upon frameworks and simple structure is assumed, which implies that each item loads on a single dimension. Let
Bayesian Model
The Bayesian formulation of the 4PNO for large-scale assessments follows,


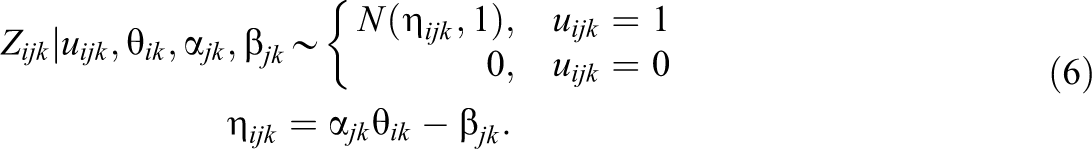


Equations 4, 5, and 6 imply the 4PNO IRF in Equation 1, where Equation 5 includes the indicator function,
Equation 7 is a prior for the K-dimensional latent variables. Note that the model is identified by setting the prior mean of
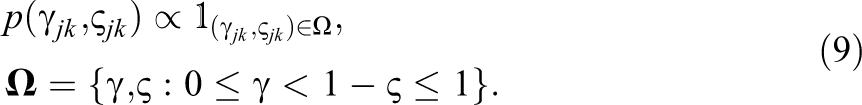
Equation 8 is a commonly employed truncated bivariate normal prior for item slope and threshold parameters (Albert, 1992) with a prior mean vector of
Full Conditional Distributions
Let the vectors of dichotomous and continuous augmented data for individual i and content area k be
Finally, let the item slopes and thresholds for content area k be
The aforementioned Bayesian formulation implies the following full conditional distributions (see Online Appendix A for additional derivations):


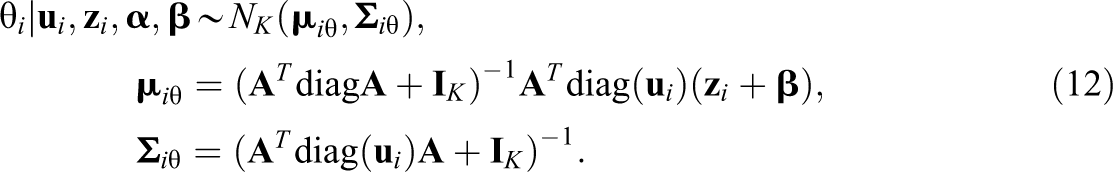

Equations 10 and 11 are the full conditional distributions for the augmented data,
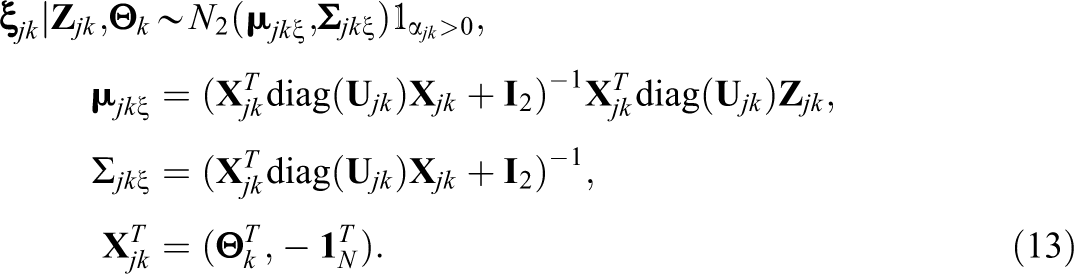
Equation 13 includes the item slope and threshold full conditional distributions. Equation 13 shows that the full conditional distribution for item slope and threshold parameters is a truncated bivariate normal distribution. In particular, the full conditional distribution for
The full conditional distribution for the item guessing parameters given the slipping parameters (and vice versa) in Equation 14 are independent truncated β distributions with parameters
Application: 2011 Eighth-Grade NAEP Mathematics and Reading
This section estimates the prevalence of slipping on dichotomous items in the 2011 eighth-grade NAEP mathematics and reading data sets. NAEP is a low-stakes, low-incentives standardized test and was administered to a nationally representative random sample of eighth graders. This section discusses the sample and variables, the Markov chain Monte Carlo (MCMC) implementation, and results.
Sample and Variables
The 2011 NAEP mathematics and reading data set include item responses from 189,396 and 174,654 eighth-grade students, respectively. The mathematics assessment included
MCMC Implementation
As noted above, the ordinal items were included in the analyses using the ONO model. The two measurement models for the dichotomous items were the status quo models specified in the NAEP technical documentations (i.e., two- or three-parameter models) and the 4PNO. It is important to note that item R058805 in the reading assessment had low discriminating power (i.e.,
MCMC with Gibbs sampling was used to estimate model parameters. In particular, the 4PNO models for mathematics and reading were compared with results from status quo models based upon the NAEP documentation. Chain lengths of 250,000 were executed, and the first 125,000 iterations were discarded as burn-in. Furthermore, the prior parameters for the item slope and thresholds were set as
Results
Relative model fit of the status quo and 4PNO measurement models was assessed using the deviance information criterion (DIC; Spiegelhalter, Best, Carlin, & Van Der Linde, 2002), given that prior Monte Carlo research supports the use of the DIC to correctly select the 4PNO over the 2PNO and 3PNO when the true data generating model is the 4PNO (Culpepper, 2016). The DIC indices provided evidence that the 4PNO improved fit for both the mathematics and reading assessments. The DIC for the mathematics assessment was 6659295 and 6680337 for the status quo and 4PNO measurement models, respectively. The DIC indices for the reading assessment were 4013794 for the status quo model and 4011974 for the 4PNO model.
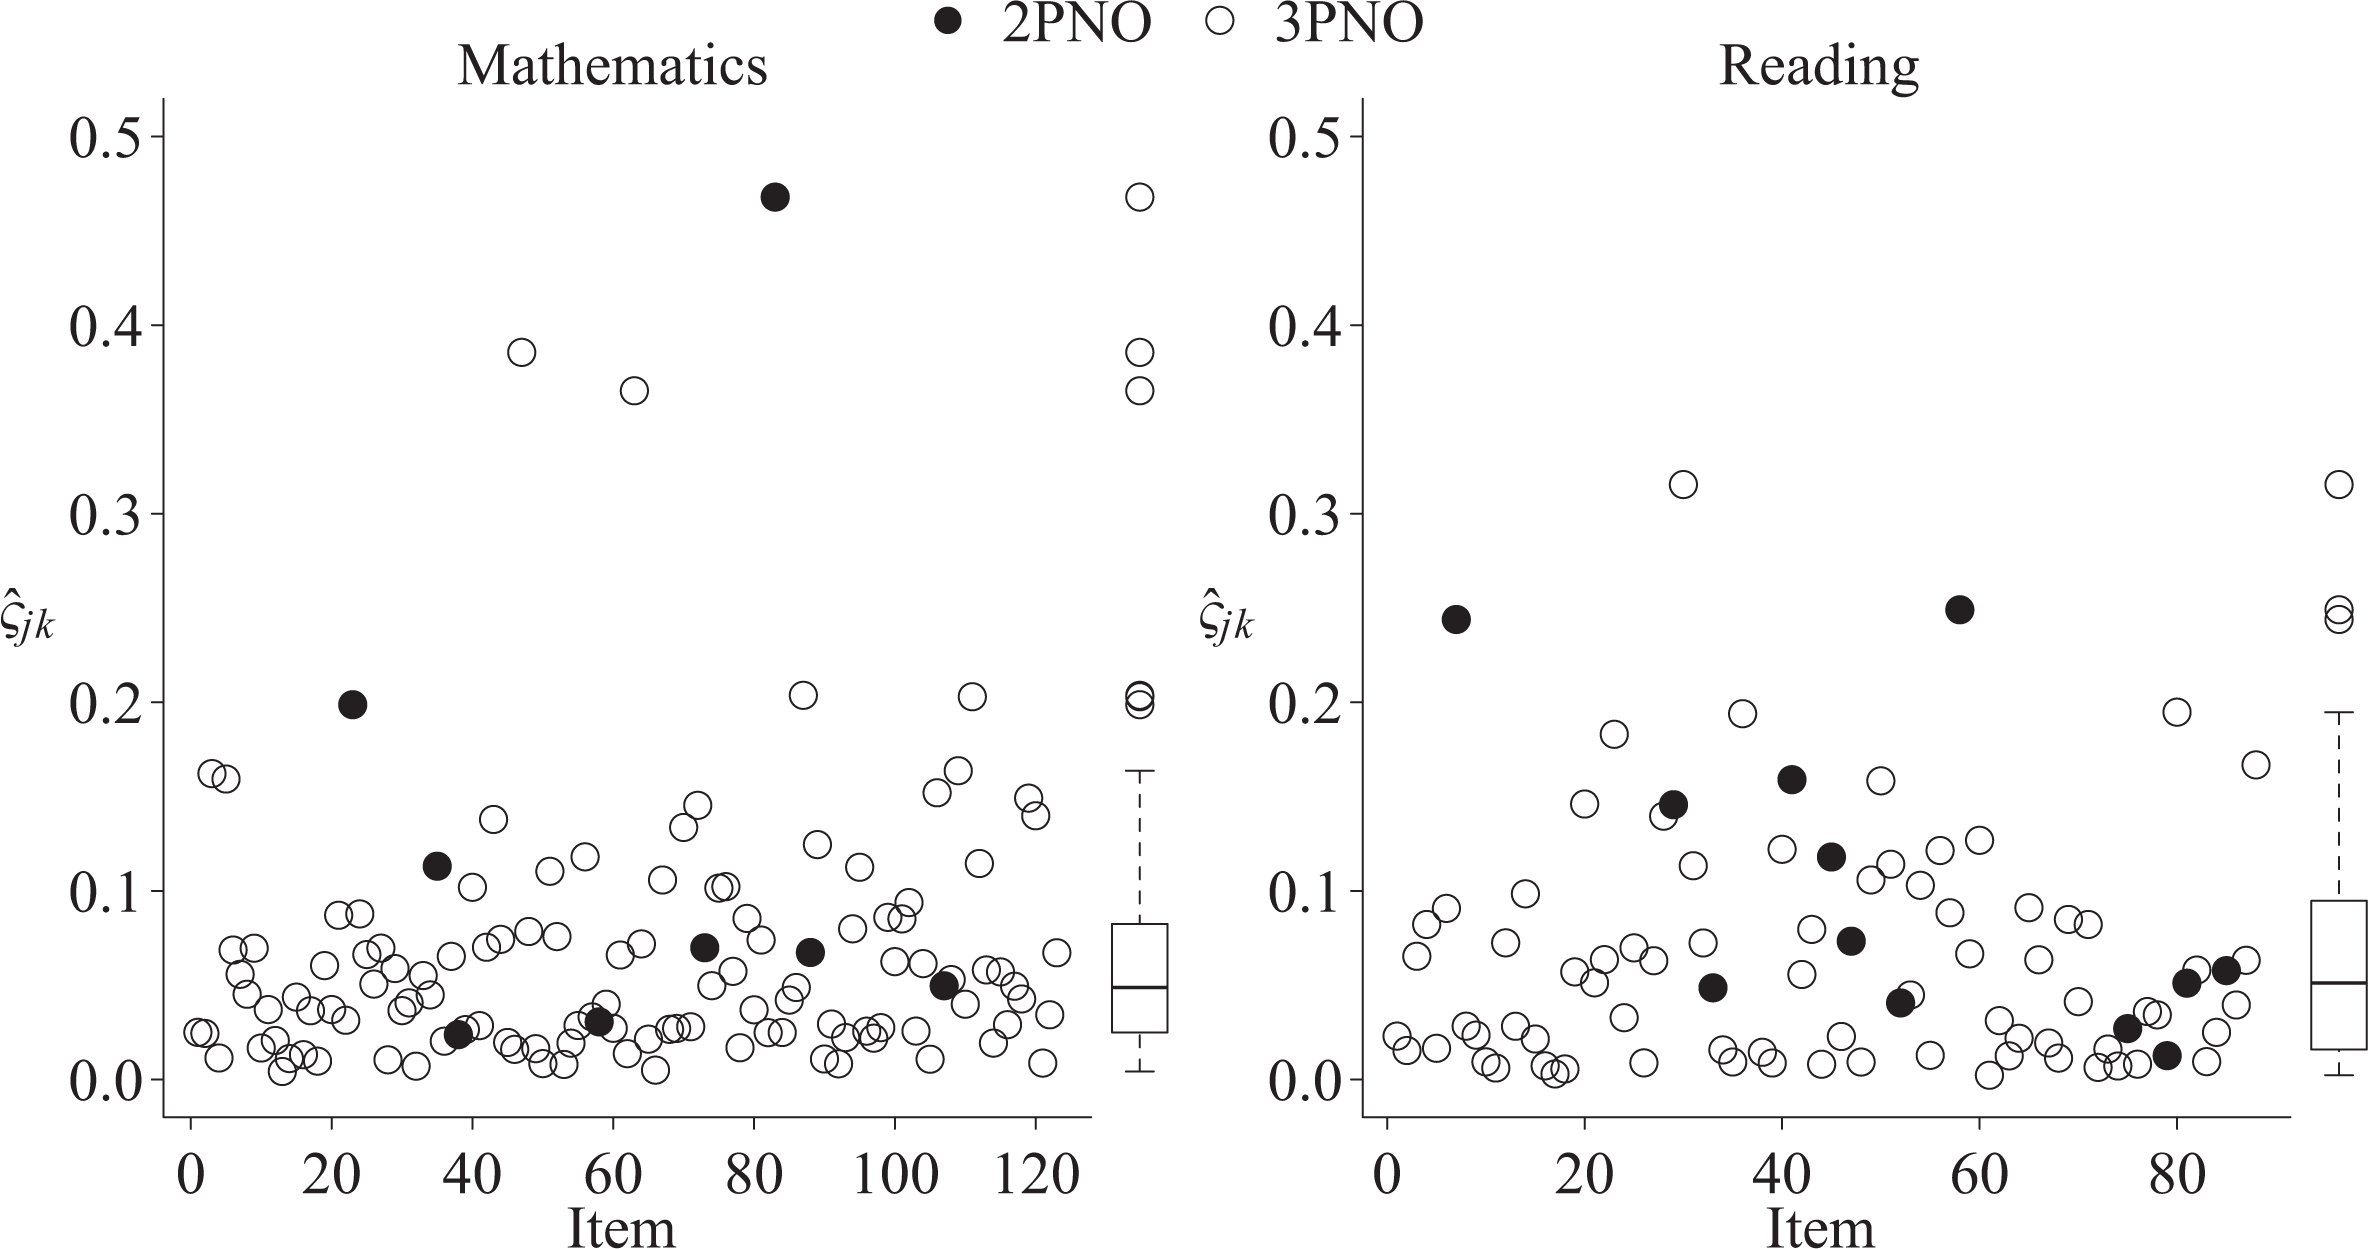
Figure 3 plots
Estimated
Readers are directed to Online Appendix B for tables of dichotomous item parameters for the status quo and 4PNO models. Figure 3 provides evidence regarding the prevalence of slipping in the low-incentive NAEP mathematics and reading tests. As noted above, allowing for slipping may impact the estimated values of the item slope (i.e., α
jk
), difficulty (i.e.,
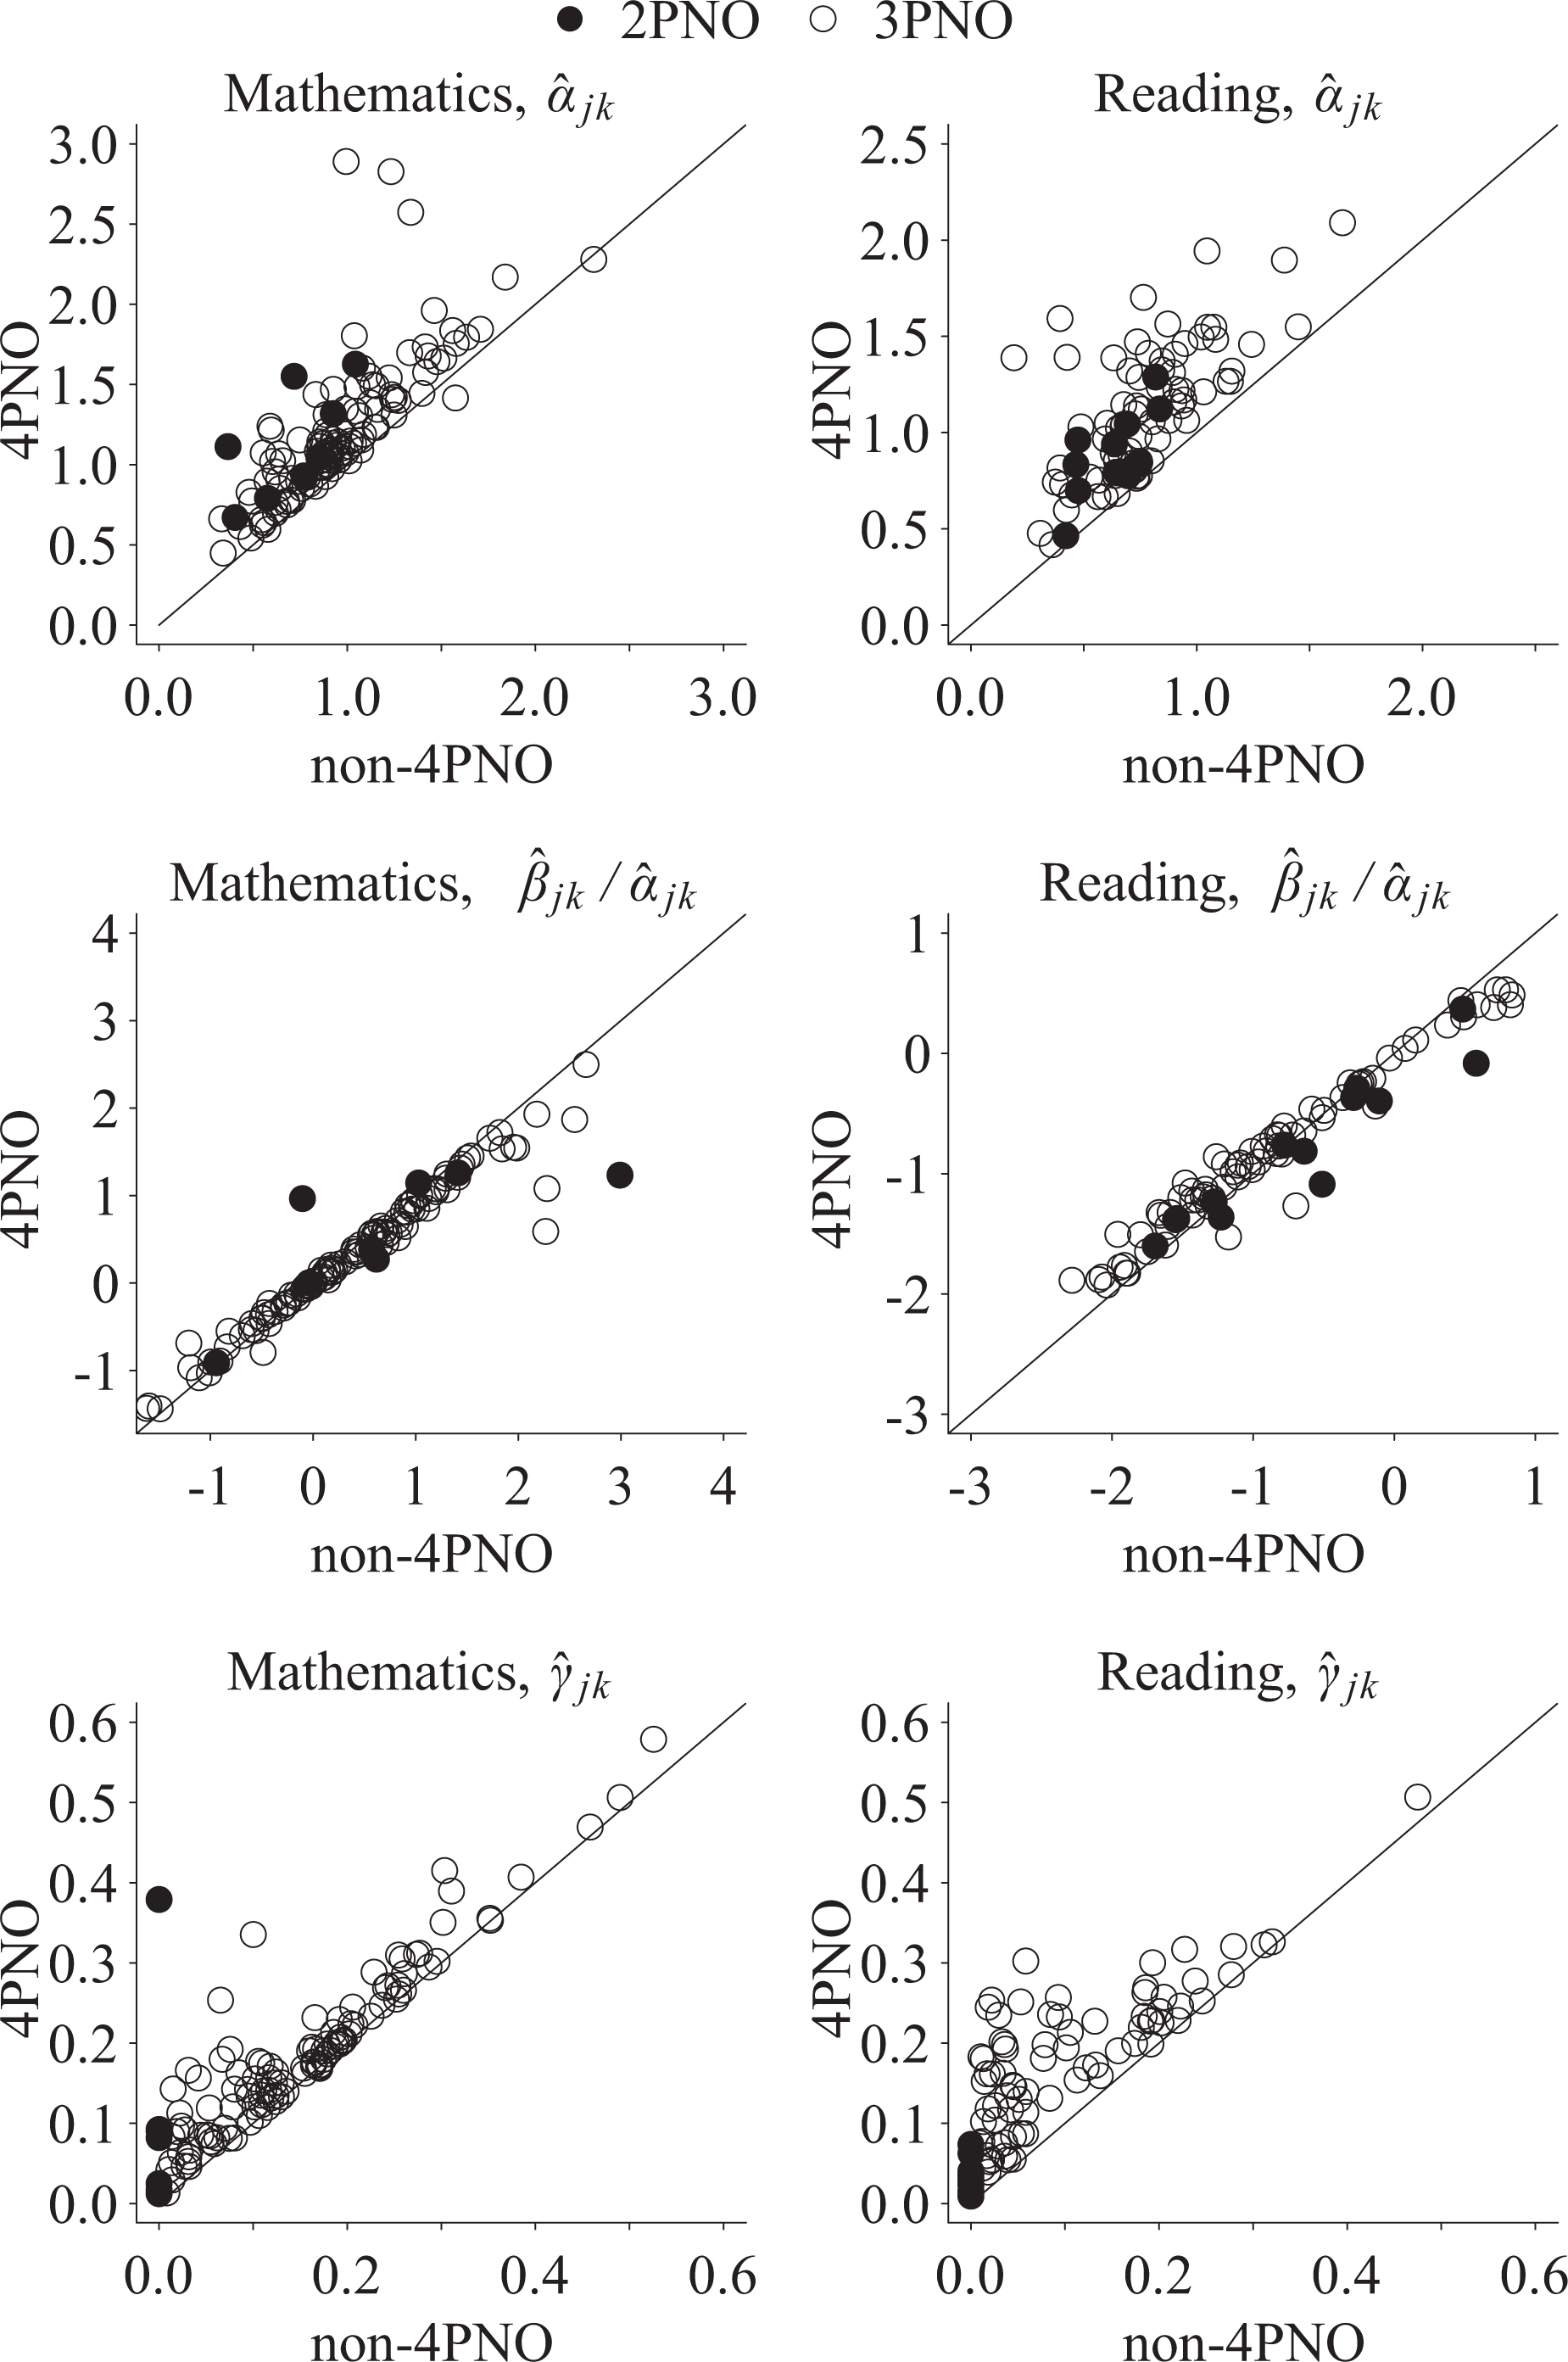
Estimated item slope (i.e.,
The 4PNO estimated guessing parameters even for those items that were originally modeled with the 2PNO. Interestingly, there was evidence of nonzero guessing parameters from the 4PNO fit for several of the 2PNO dichotomously scored mathematics constructed response questions. For instance, M221701 had a guessing parameter of .37. As with “slipping,” “guessing” may be attributed to actual guessing behavior or an item characteristic and additional investigation of the items would be warranted. In contrast, the guessing parameters for the reading 2PNO items were all below 0.1.
Figure 4 demonstrates how estimating slipping probabilities impacts the item slope, location, and guessing parameters. Changes in item parameters imply changes in item information functions. Figures 5 and 6 plot the various mathematics and reading dimensions estimated test information functions for dichotomous items. Note the test information functions were computed as unweighted sums of item information functions, given that NAEP divides the item pool into blocks in a BIB design that “…ensures that approximately equal numbers of students receive each booklet” (Beaton & Zwick, 1992, p. 101). Figure 5 provides evidence that slipping on the dichotomous mathematics items reduced score precision for higher scores across the five latent dimensions. In contrast, the mathematics items provided greater precision in the middle of the latent continuum. The difference in 4PNO and non-4PNO test information functions was greatest for the ALG, DAS, and MEA content areas where

Estimated unweighted test information function (i.e.,
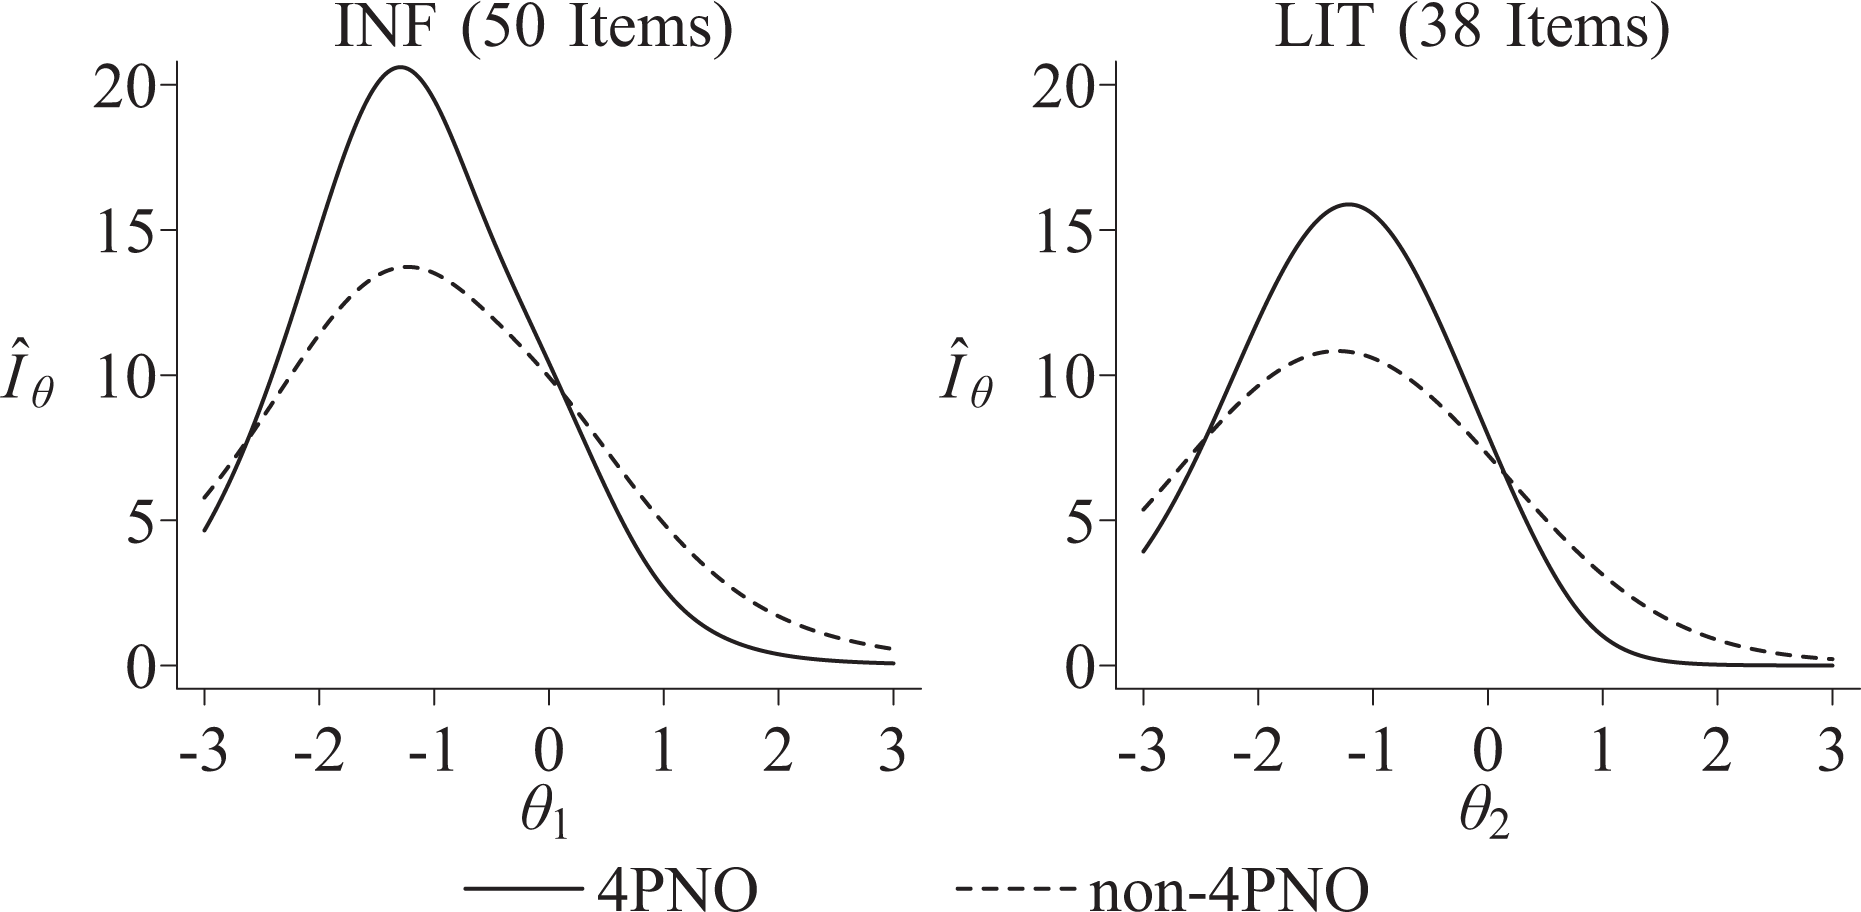
Estimated unweighted test information function (i.e.,
Figure 6 provides similar evidence for the two reading dimensions. There are several important differences in
Discussion
This study serves as an initial inquiry into the prevalence and implications of slipping for low-incentives standardized testing. This section summarizes the contributions of the study and provides recommendations for future research.
First, this study offers new evidence regarding the prevalence of slipping on the low-incentive NAEP mathematics and reading assessments. The probability of slipping exceeded 5% for nearly half of the dichotomous mathematics and reading items. One consequence is that neglecting to estimate slipping leads to a different understanding about test information and score precision. In fact, the results in Figures 5 and 6 provide evidence that employing the status quo, non-4PNO models implied higher scores were measured with greater precision. However, the 4PNO models that allowed for slipping support a different conclusion regarding measurement precision. Specifically, mathematics scores were most precisely measured in the middle of the distribution, whereas reading scores were most precise for latent scores roughly a standard deviation below the average.
This study found that slipping was differentially represented among the mathematics and reading dichotomous items. That is, Figure 6 demonstrated reading test information functions differed more between the 4PNO versus the non-4PNO in comparison to the mathematics test information functions in Figure 5. One explanation is that the two reading content areas consisted of more dichotomous items with nonzero slipping probabilities than the five mathematics content areas. A potential implication for test developers is that adding more dichotomous items in a low-incentive assessment may contribute to more significant disparities in test information when using 4PNO versus non-4PNO models.
The application demonstrates that slipping is a factor that should be considered during test development and construction. Specifically, test information functions under the status quo model suggested that larger θ scores were measured with greater precision. Consequently, ignoring slipping during test construction may result in test developers being overly optimistic about higher latent scores. In contrast, a review of the test information functions for mathematics and reading achievement in Figures 5 and 6 suggests that additional difficult items are needed to improve score precision in the upper portion of the latent continuum.
The differences in interpretation of measurement precision between the status quo and 4PNO models are also important for practitioners. Policymakers are often interested in understanding characteristics of proficient and high-performing test takers to improve the educational experience for all students. The results in this study suggest that scores for high-performing students are measured less precisely. A reduction in measurement precision accordingly would complicate analyses that examine covariates of proficient students, given that increased measurement error attenuates measures of association (May & Nicewander, 1994). Consequently, the presence of slipping in low-incentive assessments would have the effect of making it more difficult to accurately identify correlates of success.
Second, this study presented a new formulation for the 4PNO that is applicable for large-scale assessments with missing data designs. The methodology developed and employed in this study could be applied to assess the prevalence of slipping on other large-scale assessments, such as the Programme for the International Assessment of Adult Competencies, the Programme for International Student Assessment, the Progress in International Reading Literacy Study, and the Trends in International Mathematics and Science Study.
There are several directions for future research. First, standardized tests are increasingly the focus of scrutiny and high-stakes decisions for teachers and schools (Baker, Oluwole, & Green, 2013; Koretz, 2015; Loeb, Soland, & Fox, 2014). High-stakes decisions are often made with achievement tests that bear minimal implications for test takers. That is, unlike college admissions and employment examinations elementary and secondary achievement tests are low-incentive assessments that bear fewer consequences for test takers. Slipping may be an issue in the absence of clear incentives for test takers. Student performance on NAEP tests has shown convergent validity with student achievement on state exams (Braun & Qian, 2007; McLaughlin, 1998). The presence of slipping on NAEP reading tests may offer an impetus for examining slipping on state achievement assessments. Namely, some states and districts routinely use standardized tests to make high-stakes decisions about the performance of teachers and schools. The results in this study demonstrate that the presence of slipping reduces precision for high-performing students and the reduction in information for higher θ values introduces measurement error and would accordingly distort value-added estimates (Doran, 2014; Lockwood & McCaffrey, 2014; McCaffrey, Castellano, & Lockwood, 2015). Additional research is needed to understand the impact of slipping on measures of teacher and school effectiveness.
Second, prior research examined the role of incentives to motivate and encourage test takers to maximize their performance (Braun et al., 2011; O’Neil et al., 1995; O’Neil et al., 2005). For example, Braun et al. (2011) provided test takers a maximum of US$35 based upon performance. Future research should consider the impact of monetary incentives on slipping probabilities. Such research could provide insight regarding the connection between motivation and slipping as measured by IRFs with asymptotes below one. One concern though is that offering monetary incentives is likely too costly for large-scale assessments, so additional research is needed on how to structure nonmonetary incentives to motivate test takers to maximize performance.
Third, previous studies explored several multidimensional factor structures for NAEP content areas (see, e.g., Harrell & Cai, 2016). The presence of slipping necessarily alters item slopes, and researchers may uncover a different structure after accounting for slipping. As noted by an anonymous reviewer, future research should consider the influence of slipping on investigations of factor structure in large-scale assessments. The developed model could be extended to other more general multidimensional structures, such as confirmatory models with complex structure and the exploratory approaches similar to Béguin and Glas (2001).
In short, this article provides evidence that low-incentive examinations are influenced by slipping. The application to the 2011 eighth-grade NAEP mathematics and reading assessments demonstrated how slipping impacts measurement precision. The results suggest that slipping is a factor that should be considered during test development and construction to improve score precision for higher performing test takers.
Footnotes
Declaration of Conflicting Interests
The author(s) declared no potential conflicts of interest with respect to the research, authorship, and/or publication of this article.
Funding
The author(s) received no financial support for the research, authorship, and/or publication of this article.