
Abstract
Collapsing categories is a commonly used data reduction technique; however, to date there do not exist principled methods to determine whether collapsing categories is appropriate in practice. With ordinal responses under the partial credit model, when collapsing categories, the true model for the collapsed data is no longer a partial credit model, and therefore refitting a partial credit model may result in model misspecification. This article details the implementation and performance of an information matrix test (IMT) to assess the implications of collapsing categories for a given data set under the partial credit model and compares its performance to the application of a nominal response model (NRM) and the S − X2 goodness-of-fit statistic. The IMT and NRM-based test are able to correctly determine the true number of categories for an item, given reasonable power through this goodness-of-fit test. We conclude by applying the test to a well-studied data set from the literature.
Introduction
When modeling ordinal data, researchers often collapse categories in the context of methods such as contingency table analysis (Jackson, Gray, & Fienberg, 2008; Murad, Fleischman, Sadetzki, Geyer, & Freedman, 2003; Stromberg, 1996), structural equation modeling (Brown, 1991; Muthen, 1984), and item response theory (IRT; Andrich, 1995; Jansen & Roskam, 1986; Lecointe, 1995; Roskam, 1995; Wilson & Masters, 1993). For item response data, collapsing refers to a process by which the categories of a polytomous item are merged to generate fewer categories for an item than originally were measured. Despite the acceptance of collapsing in common practice, little research has been published on the impact of collapsing when fitting logistic adjacent-category models in IRT.
Categories of a polytomous item may be collapsed for reasons often related to interpretability or computational ease. Since models for dichotomous outcome item response data are easier to interpret and communicate than those for polytomous responses, researchers may choose to dichotomize item responses before analysis in order to use specific precoded modeling procedures. For example, Magis, Béland, Tuerlinckx, and De Boeck (2010) showcase a variety of methods for differential item functioning (DIF) using a data set that contains dichotomized responses to a verbal aggression questionnaire, originally consisting of responses obtained on a 3-point Polytomous Response Scale (Vansteelandt, 2000).
If one category of an item is not endorsed by any respondents in a particular data set, then most available statistical software cannot provide estimates of the item-level parameters pertaining to that specific category. To ameliorate this problem, the nonempty score categories can be renumbered in consecutive order as automatically implemented by software such as the
For the logistic adjacent-category class of IRT models, collapsing categories may induce model misspecification due to the failure of the joining assumption (Jansen & Roskam, 1986). While in practice, the collapsing of categories may be viewed as a step of processing data, in actuality, collapsing categories changes the underlying data-generating model, and, therefore, the properties of models fit to the collapsed data must be examined in light of this procedure. In IRT, these issues have never been studied for collapsing categories. Without a principled methodology to determine whether a category should be collapsed, most current approaches to decide whether collapsing categories is appropriate for a particular data set fail to capitalize on the rigor of statistical inference.
Extending the work of Ranger and Kuhn (2012) in the application of an information matrix test (IMT) to IRT models, this article details the implementation and performance of an IMT to assess the degree of misspecification induced by collapsing categories under the partial credit IRT model. The second section provides necessary statistical background. The third section provides a review of current approaches toward the choice of whether to collapse categories within a particular data set and highlights their shortcomings when collapsing categories is viewed as a form of model misspecification. The fourth section, thus, derives an IMT to assess goodness of fit or misspecification caused by the collapsing of categories. The fifth section provides a simulation study to illustrate the properties of the IMT in practice. The sixth section provides an application of the IMT to responses from a behavioral questionnaire measuring verbally aggressive reactions. The seventh section provides concluding remarks and a discussion of future work.
Statistical Background
Let an instrument be a set of J items, each consisting of mj-ordered score categories, labeled {1,…,mj}. Assume that instrument’s respondents are indexed by i ∈ {1,…,n} and let the ith respondent’s score to the jth item be denoted Xij, with realized value xij. Let XiJ = (Xi1,…,XiJ) and its realized values xiJ = (xi1,…,xiJ) denote the set of responses to a test of length J for a randomly selected individual, and let θi represent his or her value on a unidimensional latent trait. For the ease of notation, the respondent-level subscript, i, is often suppressed. An IRT model has the form:

where f(θ) is the distribution of the latent trait in the population, which often is assumed to be standard normally distributed. Thus, Equation 1 relates the marginal probabilities of the vectors of score patterns of length J to individual-level and item-level parameters as defined by the functional form of the IRT model. For a fixed sample size of respondents, the set of all
The partial credit model (Masters, 1982) is a well-studied member of the logistic adjacent-category class of IRT models:
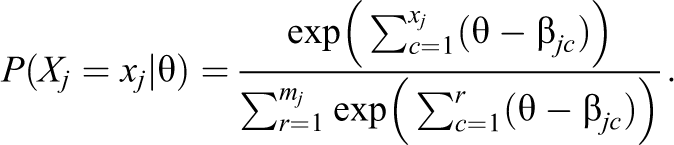
Here, βjc are the item-specific difficulty parameters that represent the critical value of the latent trait continuum at which a score category becomes more likely than the one below it. For the sake of model identification, βj1 ≡ 0 ∀j ∈ {1,…,J}. Most widely used IRT models, including the Partial Credit Model (PCM), assume local independence, which requires that the scores on each item are conditionally independent, given the latent trait for all vectors of item responses:
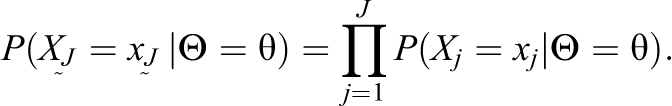
This property relates the specification of the PCM for 1 item to the vector of score patterns.
The PCM may be extended to the generalized PCM (GPCM) through the inclusion of an item-specific discrimination parameter, αj, which measures the strength of the relationship between that item and the latent trait, θ (Muraki, 1992). Due to the wide use of the summed score of the J items and its relationship to the PCM (Hemker, Sijtsma, Molenaar, & Junker, 1996, p. 9, 1997; Sijtsma & Hemker, 2000; van der Ark, 2005; van der Ark & Bergsma, 2010), this article focuses, within the class of logistic adjacent-category models, on the impact of collapsing categories under the PCM.
Collapsing Categories and Model Misspecification
While each IRT model can be expressed in multinomial form, not all multinomial models have probability mass functions that can be written as an IRT model. The IRT models are defined by item-level parameters that induce a structure for how the probabilities of each score pattern relate to the others by linking all patterns that share a common value for each item. From this specification of the IRT model, the item-level parameters are estimated via marginal maximum Likelihood, requiring Gauss–Hermite quadrature to approximate the required integrals in most cases (Muraki, 1992).
The collapsing of score categories of a PCM item is equivalent to merging partitions of the underlying multinomial model. Because each score category of each item appears in many of the score patterns, collapsing two score categories of a single item with mj original categories directly affects
First introduced by Jansen and Roskam (1986), the joining assumption is said to hold when assuming the same structure for the probabilities as Jansen and Roskam (1986) did in their definition:

for any categories, g and h. Therefore, the joining assumption states that if collapsing occurs, the conditional probability of the new category is simply the sum of the conditional probabilities of the categories that were joined. The seminal article introduced the joining assumption and posed it as a necessary property for measurement models used in the analysis of polytomous data. This restricted which models the original authors deem suitable for use, since it is well known that the joining assumption does not hold for the logistic adjacent-category models (Jansen & Roskam, 1986; Roskam, 1995). However, requirement of the joining assumption for valid statistical inference was later refuted by Andrich (1995) as a necessary property in the conceptualization of the response process behind polytomous data.
From a statistical perspective, the fact that the joining assumption does not hold for the logistic adjacent-category models, including the PCM, implies that if categories of data generated from a PCM are collapsed, then the true model for the collapsed data is not a PCM itself. Therefore, refitting a PCM to the collapsed data constitutes model misspecification since no PCM will yield the true marginal pattern probabilities for the collapsed data. This further implies that any estimates of the item-level parameters obtained by the estimation procedure will be biased and inconsistent for the truth (White, 1982). See the study by Harel (2014) for an illustration of this form of misspecification for the PCM and a full characterization of the true model for the collapsed data.
Whether intentional or not, model misspecification is common in all areas of statistics. For example, simple regression models assume linearity in the inputs, and that all inputs necessary to correctly specify the data-generating process are included in the model: two assumptions that may rarely be true in practice. However, in these cases, the ramifications of misspecifying the model on the goals of the analysis are studied and understood. The asymptotic properties of estimates obtained from refitting a PCM to the collapsed data, in light of this potential misspecification, must be characterized and understood and the properties of models fit to the collapsed data should, therefore, be examined.
Review of Current Practice
Current methods for choosing whether to collapse categories focus on the visual analysis of either the item category characteristic curve (ICCC) that plots the model-based probabilities for each score category as a function of the latent trait (e.g., Eklund, Erlandsson, & Hagell, 2012; Forjaz et al., 2013; Grondin & Blais, 2010; Hendriks, Fyfe, Styles, Skinner, & Merriman, 2012; von Davier & Wilson, 2007), the item information function (IIF) that plots Fisher’s information for a particular item as a function of the latent trait (e.g., Muraki, 1993), or through an application of the nominal response model (NRM; Bock, 1972, p. 9; Preston, Reise, Cai, & Hays, 2011; Thissen, Cai, & Bock, 2010).
ICCCs
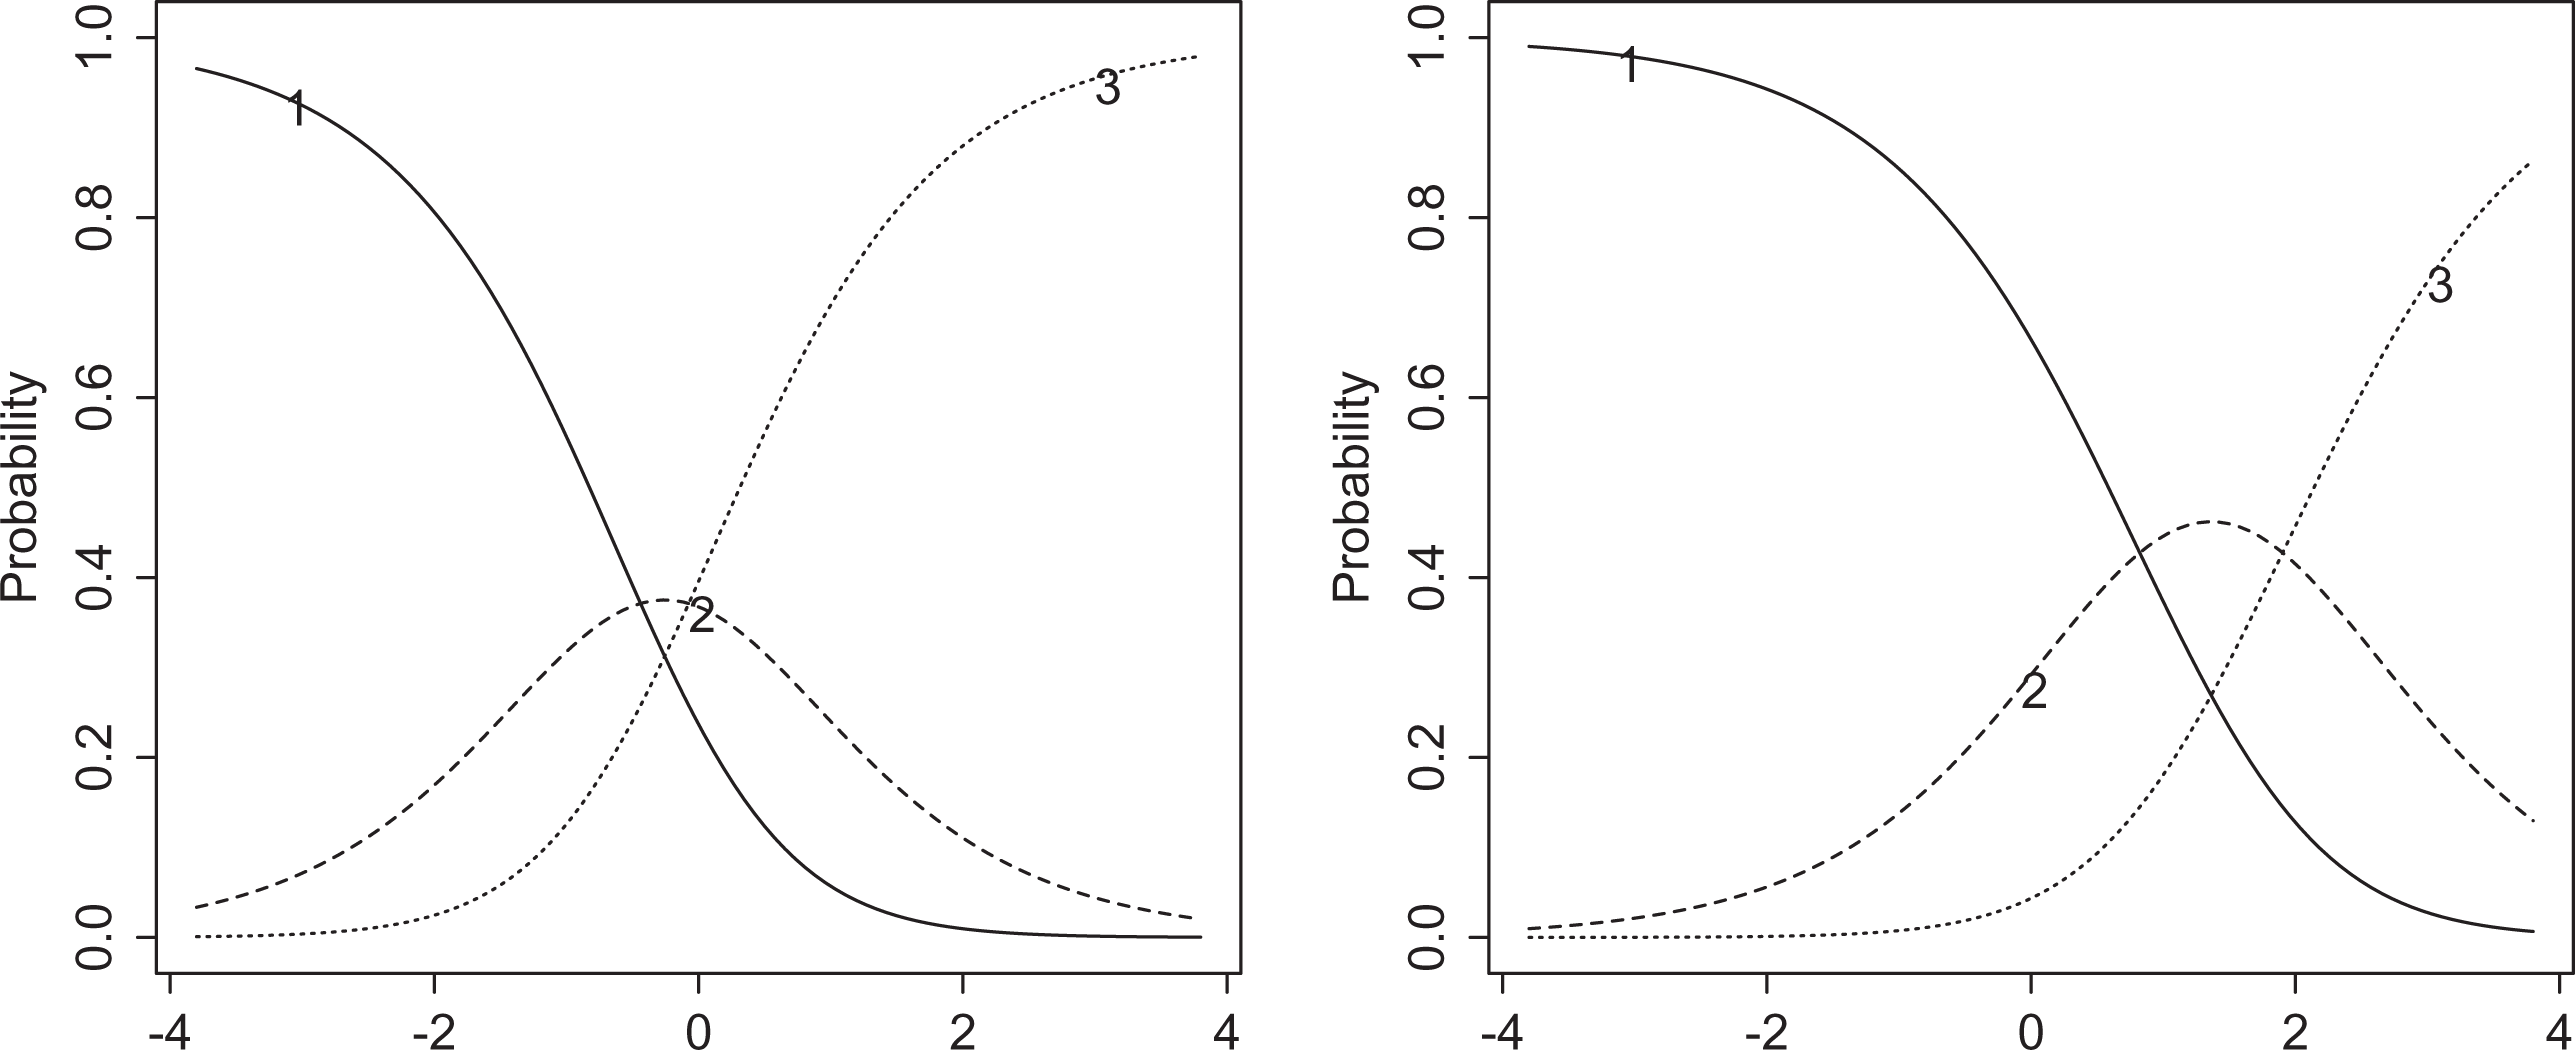
To achieve what is perceived to be a properly functioning item, researchers frequently base the decision to collapse categories on a visual analysis of the ICCC. Figure 1 shows the ICCC for four specifications of the threshold parameters. The top-left subfigure shows an item that would be characterized by many as properly functioning, since the threshold parameters for consecutive categories are ordered, and thus each category has the highest conditional probability at some unique part of the latent spectrum. The top-right subfigure shows an item for which the third score category is only the most likely category for a very small portion of the latent spectrum. The bottom two subfigures show items for which the threshold parameters are disordered, and thus the third score category is submerged beneath the others and, therefore, never the most likely category at any point on the latent spectrum.
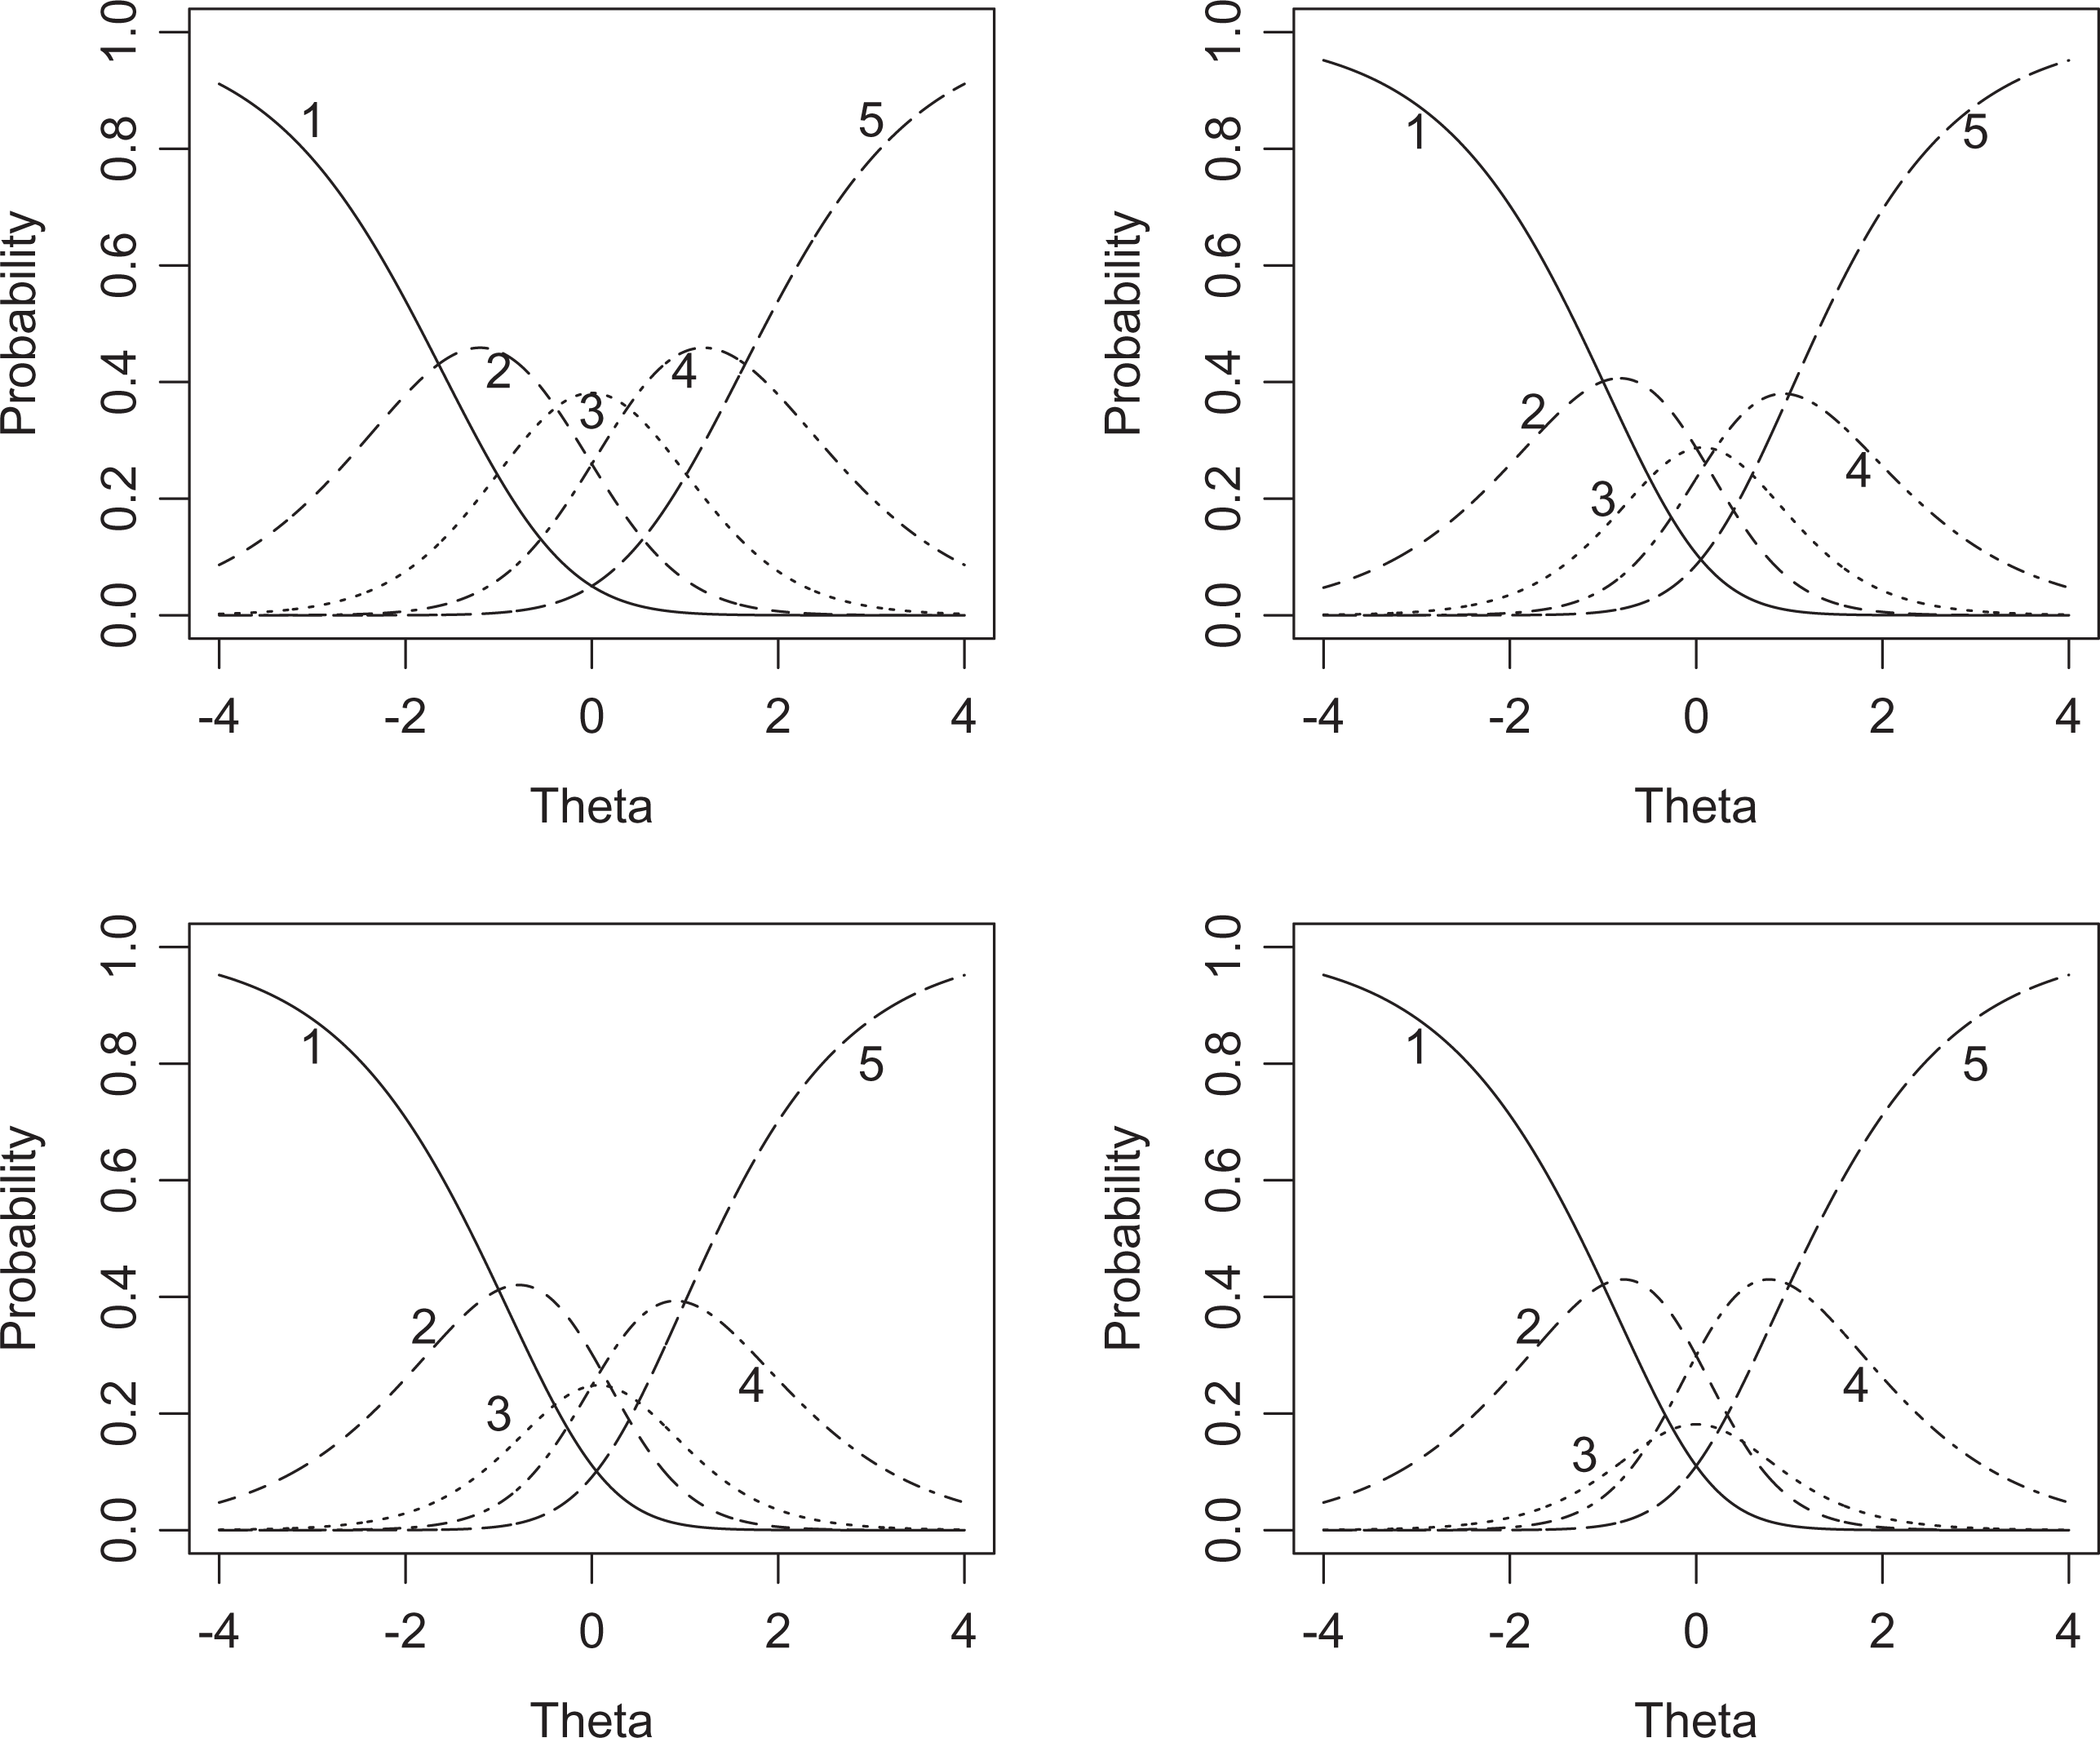
Item category characteristic curves for 4 items from a partial credit model with varying threshold parameters. Each subfigure shows the model-based probabilities for each score category as a function of the latent trait. The label of each score category is indicated with text. In the top left, the threshold parameters are a series of quantiles from a standard normal distribution (β = {−1.645, −0.385, 0.385, 1.645}). In the top right, the threshold parameters are β = {−1, 0, 0.2, 1}. In the bottom left, the threshold parameters are disordered, so that the third category will be submerged beneath the others (β = {−1, 0.2, 0, 1}). In the bottom right, the extent of this reversal is increased (β = {−1, 0.5, −0.5, 1}).
In such cases of disordered thresholds (e.g., Adams, Wu, & Wilson, 2012; Eklund et al., 2012; Forjaz et al., 2013; Hendriks et al., 2012), or when categories have low endorsement, as likely in the item shown on the top right (e.g., Meade, Lautenschlager, & Hecht, 2005; Teresi et al., 2009), the appropriateness of the model and model fit may be questioned. In this case, this item may be labeled as problematic and collapsed to form a “better-functioning” item (Bond & Fox, 2007) under a belief that properly functioning items should be composed of categories that each dominate over all other categories for a distinct part of the latent spectrum. However, this unsystematic approach leaves the decision of whether a category is useful to the researcher and encourages them to arbitrarily recode their data if they are not pleased with the inference from the original data set. Without a principled methodology to determine whether a category should be collapsed, an ICCC-based collapsing approach contravenes the rigor of statistical practice, with no proof of its efficacy (Harel, 2014).
IIFs
Collapsing categories may be motivated by a desire to improve the estimation of the latent trait, θ. Since the estimation of θ relies on the estimates of the item-level parameters, low endorsement of score categories will lead to high amounts of variability in the item-level parameter estimates and issues with latent trait estimates (Cheng & Yuan, 2010). With these issues in mind, others have proposed that researchers may use the IIF to inform the collapsing of categories. The IIF,
The IIF-based approach has two major flaws. First, since the true model for the collapsed data changes, the collapsed data may no longer belong to the class of logistic adjacent-category models. When this occurs, maximum likelihood estimation of the item-level parameters is biased and inconsistent (White, 1982). Therefore, when estimates of the item parameters obtained from the fitting procedure are used to estimate the true IIF, there is no easily obtainable measure of how far the estimated curves are from the truth. Furthermore, it is unclear whether collapsing based on the estimated IIF will lead to the same conclusions as if the true information function for the collapsed data were known. Second, to date, there are no guidelines for how much the information should need to be increased in order to justify collapsing categories and whether any increase in information is sufficient to justify collapsing or whether the increase should be of a certain magnitude before being deemed large enough.
NRM
A newer approach involves the use of an NRM to select the number of categories for a particular item (Bock, 1972; Thissen et al., 2010). The NRM is an extension of the PCM, which allows for separate slope and intercept parameters to be estimated for each category of each item. The likelihood of the NRM for the jth item, with mj categories, is
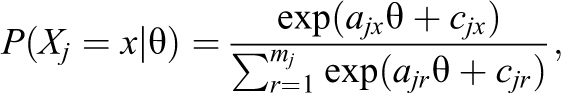
Here, ajx and cjx represent the slope and intercept parameters for Category x, respectively. For any two consecutive categories, we may define a category boundary discrimination (CBD) parameter,
Likelihood-Based Methods
One may wish to base the selection of the number of categories on a likelihood-based information criteria, such as the Akaike information criteria (AIC) or Bayesian information criteria (BIC). However, one cannot directly compare log likelihoods for the collapsed data with the original, uncollapsed data because the transformation to the data applied when collapsing must be accounted for in the calculation of the new likelihood (Jackson et al., 2008). For IRT models, computing the marginal distribution of the collapsed data is complex and beyond the skills of the wide array of people who use IRT modeling.
The IMT, as proposed by White (1982), was developed for this exact kind of problem. The IMT has been applied to dichotomous IRT models in the context of goodness of fit and tests of local independence (Ranger & Kuhn, 2012), to assess person fit (Ranger & Kuhn, 2015), and more broadly in the context of generalized linear mixed models (Abad, Litière, & Molenberghs, 2010) and ordered logit and probit models (Weiss, 1997). To date, the properties of the IMT have not been explored in the context of collapsing categories.
The IMT
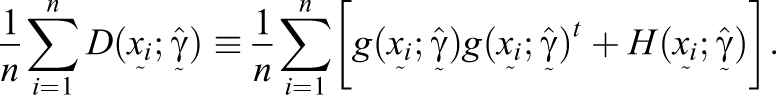
The information matrix provides a measure, given a probability model, of how much information observable data carry about the unknown parameters. The information matrix can be computed in two ways: the expectation of the outer product of the score vector and the negative expectation of the Hessian. When the true model is fit, these two versions of the information matrix are equal, and thus the following equation holds:

In the case of IRT models,
The IMT capitalizes on the difference between the sample versions of the two formulations of the information matrix to assess the potential misspecification of a statistical model fit to a specific data set. Sample versions of these matrices may be calculated based on the observed score patterns on the n respondents in the sample and maximum-likelihood estimates of the item parameters,
Following the notation in Ranger and Kuhn (2012), let
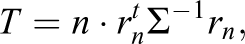
which has an asymptotic
The calculation of Σ requires either algebraic or computational procedures. Traditionally, the calculation of Σ involves the analytical third derivatives of

In practice, the expectations necessary to calculate Σ are estimated from the data. One option involves replacing the expectations with sample means, but this has been shown to lead to undesirable performance in small samples (Orme, 1990). Instead, Monte Carlo simulation, although computationally intensive, may be used to better estimate the variance–covariance matrix (Ranger & Kuhn, 2012). In this case, the marginal maximum likelihood estimates of the item-level parameters obtained from the original model fit are used to simulate score patterns for a large, say R = 100,000, number of simulated latent trait values. Σ may then be estimated based on this large simulated data set.
The IMT represents a goodness-of-fit test. By testing the item-level parameters for a given item, this test may then be used to assess item misfit that could be caused by any number of reasons including the collapsing of categories. While the test has the potential to be used for other potential causes of item misfit, this article focuses on the particular example of the potential misspecification induced by collapsing categories.
One potential issue with the IMT is that, often, it is impossible to base the IMT on all elements of the information matrix since any linear dependence among the parameters will result in the singularity of the variance–covariance matrix (White, 1982). In this case, the IMT can be based on a subset of the model parameters, rather than testing the fit of all parameters at once. This is done by restricting the calculation of the test statistic to the selected elements of rn and their corresponding rows and columns in Σ. When applied to IRT models, this creates a significant issue due to the large number of item-level parameters that are estimated. Therefore, for an IRT model, the IMT may need to be restricted to test the specific elements of the information matrix related to a specific item or set of categories of an item. With specific application to collapsing categories, Harel (2014) shows via simulation that under a PCM, when two adjacent categories are collapsed, only the threshold parameters that surround those categories are affected. This can be justified more formally through a comparison of the E-M algorithm maximization steps for both collapsed and uncollapsed data. Further explanation of this claim is provided in the Supplemental Material, available in the online version of the article. Therefore, if the goal of the test is to assess the implications of a specific collapsing on a data set, then the IMT may be based only on a small number of item-level parameters.
Simulation Study
The IMT can be used to determine the extent to which collapsing categories has violated the model assumptions of the PCM for a particular data set. However, the finite sample properties of the IMT have never been explored under the types of scenarios where collapsing may occur. A simulation study was conducted to explore the finite sample properties of the misspecified model fit to collapsed data and the Type 1 error rates and power of the IMT to detect model misspecification and determine whether the IMT is able to recover the correct category specification for a given item in a given data set, and compare the IMT to the S − X2 item-fit test, and a test of the CBD parameters from an NRM.
Simulation Design and Statistics
The properties and utility of the IMT, as compared to the NRM-based test and S − X2, were compared using a four-way factorial simulation design, varying the number of items per test (J), the number of individuals (n) and the item-level parameters of the true model generating the data (β), and the dosage of collapsing applied. To allow for different levels of power in estimating the parameters of the IRT model, J was set at either 6 or 12, while n was set at 100, 250, 500, or 1,000 individuals. Five hundred simulation iterations were conducted. For each simulation iteration, and for each triple of (J, n, β), person-level parameters, θ, for a set of n respondents were simulated from a standard normal distribution. A data set of responses to the J items was generated from a PCM with the specified item-level threshold parameters.
The threshold parameters of the first J − 1 items were selected to be a series of quantiles of a standard normal distribution, ranging from −1.96 to 1.96, with the items designed to interlace, and thus each cover a large portion of the range of expected θ values. All items were simulated to have five score categories per item. The threshold parameters for the Jth item were varied across four simulation conditions in order to mimic situations where people may choose to collapse categories. The ICCCs for these threshold specifications are shown in Figure 1. In the first condition, the threshold parameters were selected to be a series of quantiles of the normal distribution (
We then compared the performance of the IMT under four collapsing conditions on the Jth item only, varying the dosage of collapsing applied. The first condition, we fit a PCM to the original data, referred to as true model, to determine the Type 1 error rate for the IMT. To mirror the degrees of freedom of the tests for the other conditions, the IMT in this case was based on the two threshold parameters, β3 and β4, surrounding the third category, resulting in a χ2 test on 3 degrees of freedom.
The second condition, referred to as expand, aimed to assess whether the IMT could correctly recognize when an item contained too many score categories and therefore identify cases where the data should be collapsed. The third score category was split into two new categories through a draw from a Bernoulli(.5) distribution; original fourth and fifth categories were renumbered as five and six instead. Therefore, on average, half of the third score category was assigned to a new category, although the exact proportion varied across simulation iterations. A PCM was then fit to the expanded data despite being a misspecified model. The IMT was conducted based on the three threshold parameters, β3, β4, and β5, that surround the third and fourth score categories of the Jth item, resulting in a χ2 test on 6 degrees of freedom.
The third and fourth conditions assessed the power of the IMT under two collapsing dosages. The third condition collapsed the third and fourth categories, referred to as Collapse 1, and renumbered the new categories sequentially. The fourth condition, referred to as Collapse 2, collapsed first and second categories, as well as the third and fourth, and renumbered the three new categories sequentially. In both of these conditions, a PCM was fit to the collapsed data and the IMT was conducted based on the two threshold parameters, β3 and β4, and β2 and β3, respectively, of the model surrounding the collapsed category, resulting in a χ2 test on 3 degrees of freedom as well. The ICCCs for these four conditions are shown, for the first threshold condition, in Figure 2.

Item category characteristic curves for 4 items simulated from a partial credit model with varying levels of collapsing parameters. Each subfigure shows the model-based probabilities for each score category as a function of the latent trait. The label of each score category is indicated with text. For all subfigures, the threshold parameters are originally simulated as a series of quantiles from a standard normal distribution (β = {
In each case that the IMT was used, the variance–covariance matrix, Σ, used in the computation of the test statistic was obtained through Monte Carlo simulation. In each application of the IMT, data were generated from a PCM based on the marginal maximum-likelihood estimates of the item-level parameters for the model being tested for R = 100,000 respondents, with person-parameters drawn from a standard normal distribution. These simulated data were used to obtain an estimate of the variance–covariance for the vector of differences, rn, under the null hypothesis of goodness of fit. The implementation of the IMT, as specified, was performed through the
For each set of generated data sets, the decision to collapse categories was further assessed in two ways, the S − X2 item-fit test and the NRM-based test. The polytomous S − X2 item-level goodness-of-fit test (Kang & Chen, 2008) represents an extension of the S − X2 test developed by Orlando and Thissen (2000) and compares the observed and expected number of respondents in each of the item’s categories. For each condition of the simulation study, the rejection rates of the polytomous S − X2 test were computed at the α = .05 level of significance based on χ2 tests.
Lastly, the NRM was fit to each generated data set. The covariance matrix of the parameter estimates was estimated using the Oakes method (Chalmers, 2018). Since the NRM method is not a goodness-of-fit test, this method was employed to compare the three misspecified conditions to the true model. To assess whether the expand condition should be collapsed into the true model condition, and thus to determine the Type 1 error rate of this test, the CBD for the fourth category under the expand condition was tested. The null hypothesis for this test was that the CBD for the fourth category was equal to 0, tested against the alternative, that this CBD was not equal to 0. To assess whether the true model condition should be collapsed into the Collapse 1 condition, and thus assess the power of the NRM to detect this type of misspecification, the CBD for the fourth category under the true model condition was tested. Again, the null hypothesis for this test was that the CBD for the fourth category was equal to 0, tested against the alternative, that this CBD was not equal to 0. To test whether the true model condition could be collapsed to form the Collapse 2 condition, the CBDs for the second and fourth categories were tested. The null hypothesis for this test was that the CBD for the fourth category was equal to 0 and that the CBD for the second category was equal to 0, tested against the alternative, that either of these CBDs were not equal to 0. Each of these three Wald tests were conducted at the α = .05 significance level based on χ2 tests with 1, 1, and 2 degrees of freedom, respectively, and the rejection rates were recorded. The S − X2 and NRM were fit using the
Note that the

with d0 = 0, ak0 = 0, and ak(k−1) = (k − 1), and where ψ is a vector of the item-level parameters. In finite samples, Wald tests for the hypotheses involving NRM parameters may yield different results under reparametrizations of the likelihood. In the test of the CBD parameters using the
Simulation Results
Table 1 shows the Type 1 error rates and power for the IMT under all simulation conditions. Across all simulation conditions, the IMT displayed reasonable Type 1 error rates under the true model. As expected, within each condition on the threshold parameters and within each collapsing condition, the power of the IMT increased with both J and n. Overall for n = 100, the power under the different levels of collapsing was low; for n = 250, the power was moderate, particularly for the expand and Collapse 2 conditions. for n = 500 and n = 1,000, the power was moderate to high. Within each combination of J and n and for each condition on the threshold parameters, the power of the IMT was larger under the Collapse 2 condition than the Collapse 1 condition, showing that the degree of misspecification increases as more categories are collapsed. Similarly, in each case, the IMT had reasonable power to detect the misspecification of the expand condition, indicating that, given reasonable power, the IMT is able to recover the correct model and thus determines the correct number of categories for a PCM item. Lastly, although it may be tempting to collapse categories when thresholds are reversed, as in the third and fourth conditions on the thresholds, overall the test had higher power in detecting the misspecification for these conditions than for the first two conditions on the thresholds. This result indicates that disordered thresholds do not necessarily imply issues with model fit and that collapsing categories is not necessarily a solution to ameliorate the perceived potential problems with such items under the PCM.
Type 1 Error Under the True Model and Power Under the Other Conditions of the Information Matrix Test

Type 1 Error Under the True Model and Power Under the Other Conditions for the S − X2 Item Fit Statistic

Type 1 Error Under the Expand-to-True Model and Power Under the Other Conditions of the Nominal Response Model

While an analysis of Type 1 error and power is useful for those who wish to use the IMT for a hypothesis test at an α = .05 level of significance, the empirical cumulative distribution function (ECDF) of the test statistic provides a more complete view of the entire sampling distribution for the IMT. Figure 3 illustrates these results through the ECDFs for all 16 simulation conditions with J = 6 and n = 1,000. The top-right subfigure shows that under the true model, all ECDFs are close to the true cumulative distribution function (CDF), indicating that test statistic behaves as expected under the null hypothesis. However, the top-left and bottom panels show that the ECDFs for the sampling distribution of the test statistic are not similar to the true CDF under the null hypothesis, further illustrating that the test has power to detect misspecification that results in departure from the null hypothesis.
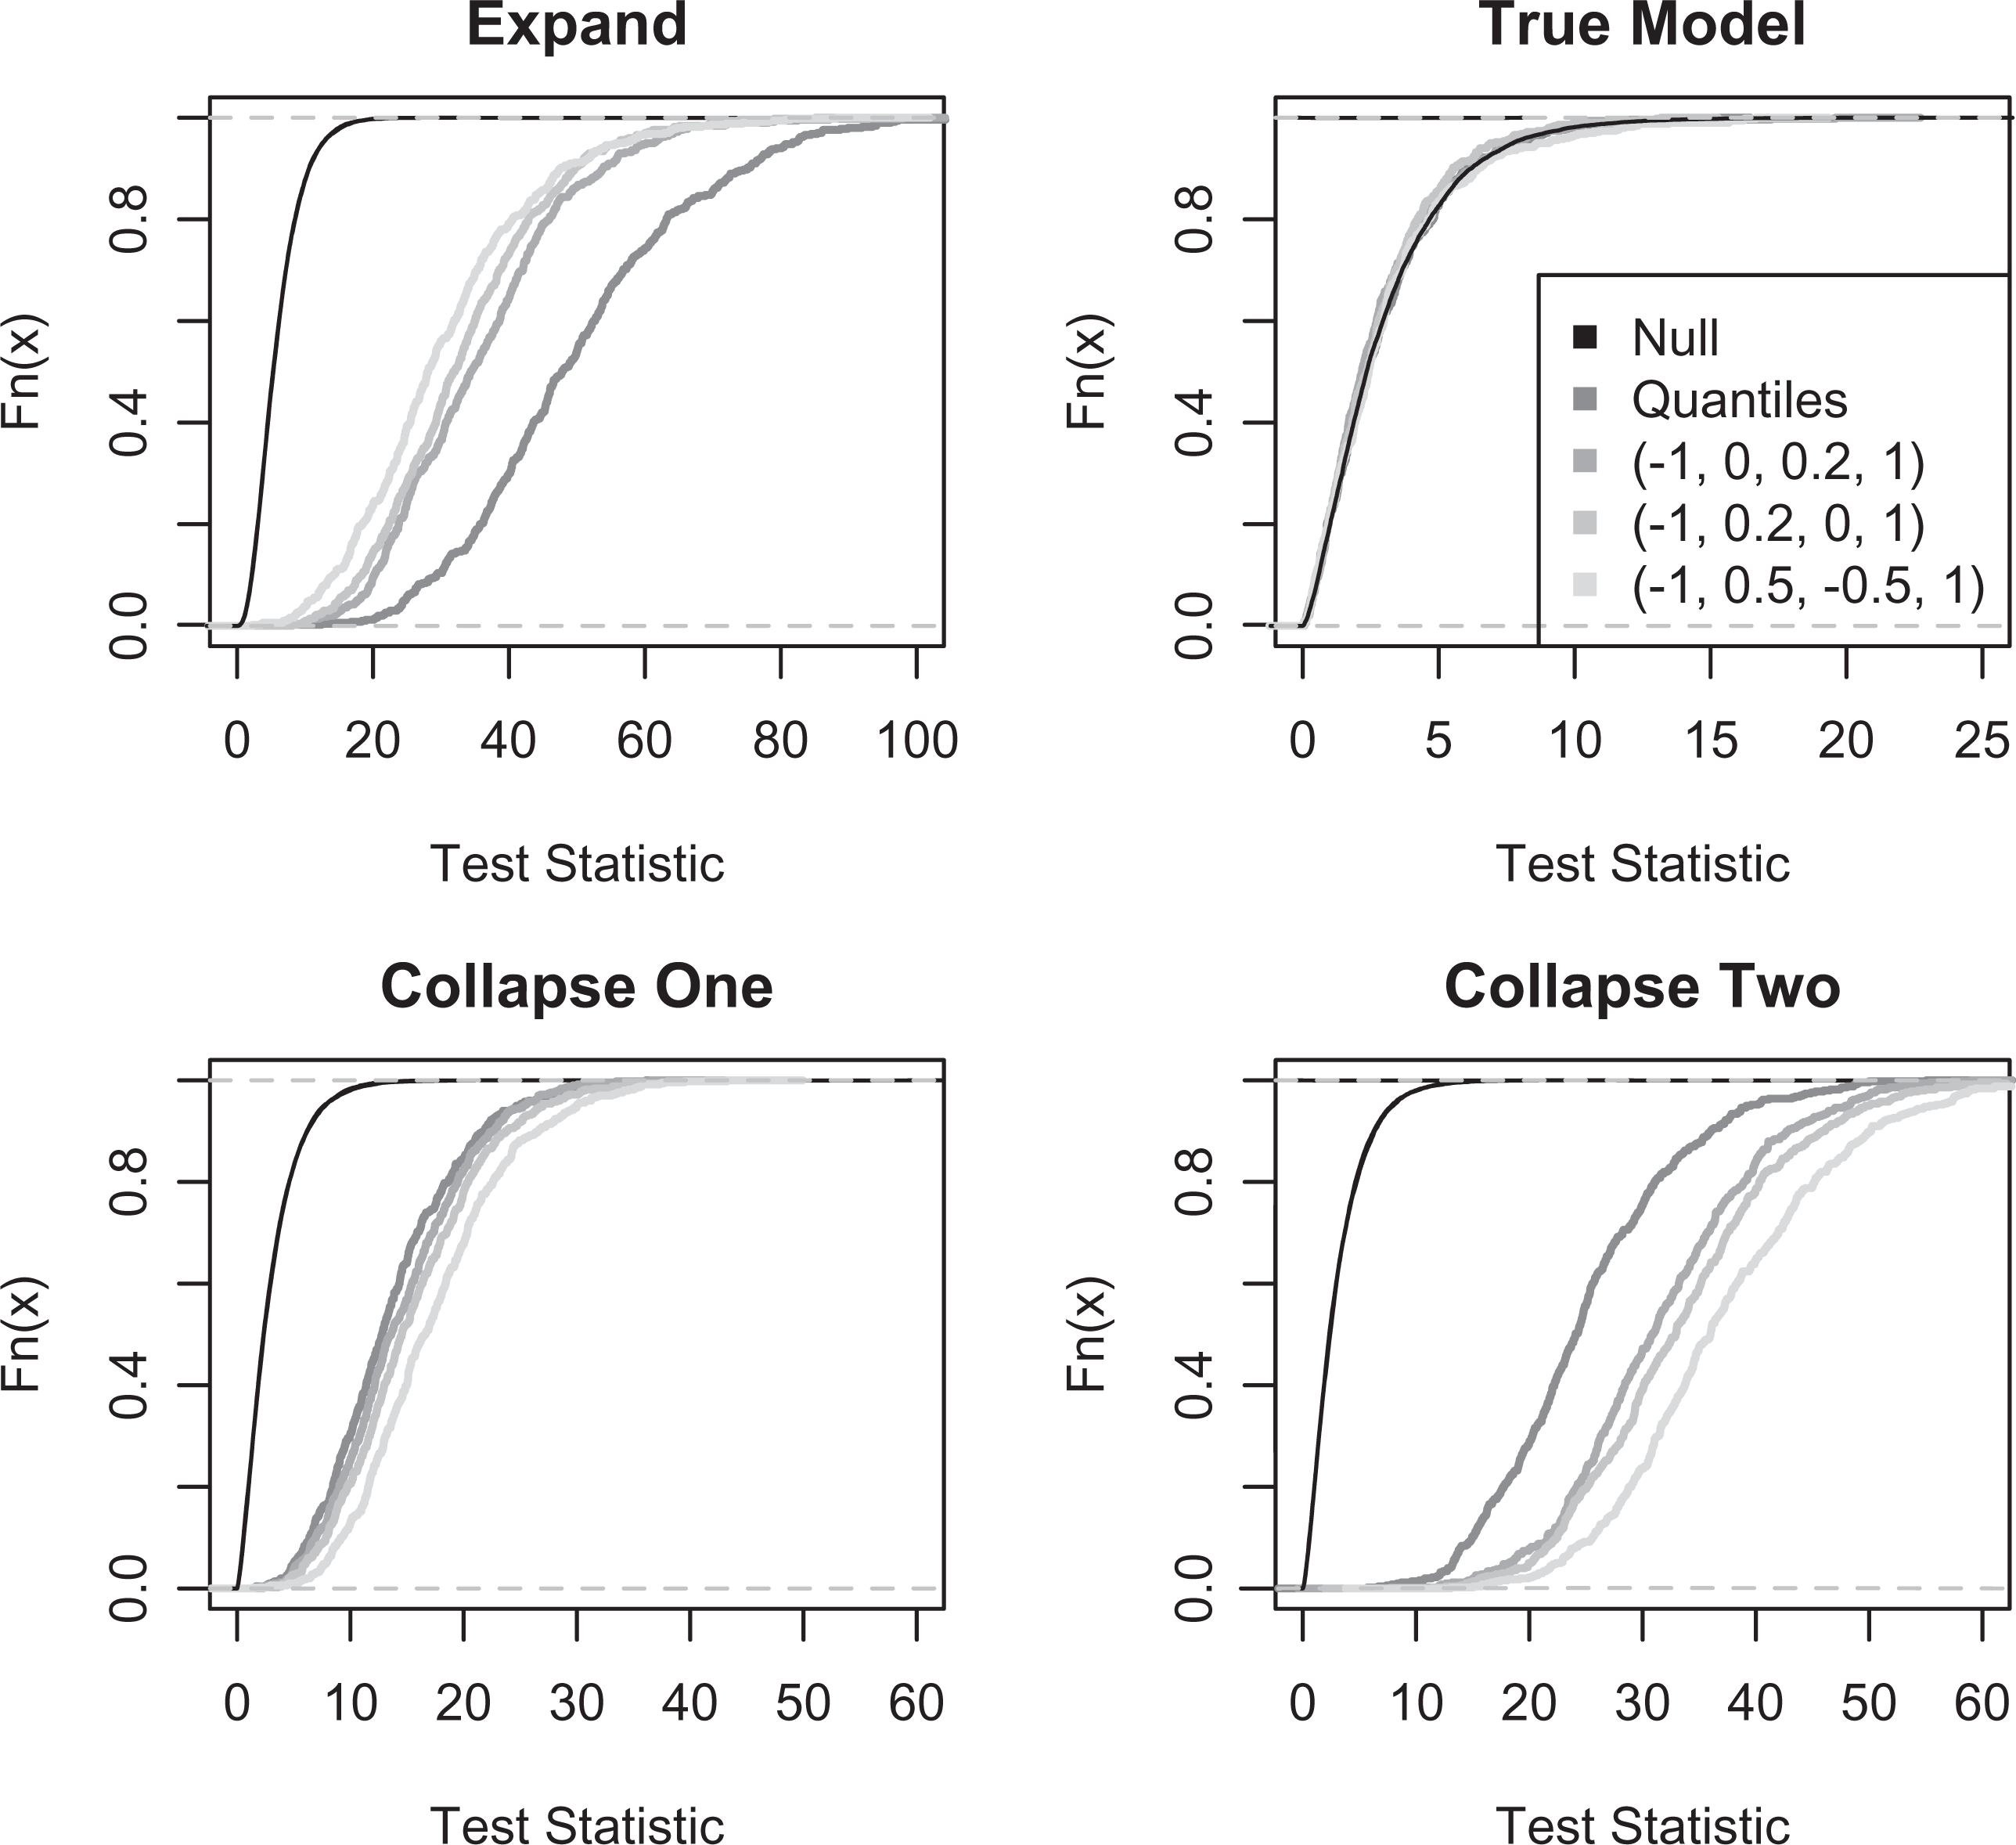
The empirical cumulative distribution functions for the information matrix test for all simulation conditions with J = 6 and n = 1,000 based on 500 simulation iterations. On the top left, the empirical cumulative distribution functions (ECDFs) for the four threshold conditions under the expand condition. On the top right, the ECDFs for the four threshold conditions under the true model condition. On the bottom left and right, the ECDFs for the four threshold conditions under in the Collapse 1 and Collapse 2 conditions, respectively. In all subfigures, the asymptotic CDF for the test statistic under the null hypothesis for the test performed is shown in black.
As shown in Table 2, the S − X2 item-fit statistic had lower power than the IMT across all simulation conditions. The S − X2 attained moderate power for n = 500 and high power for n = 1,000 for the expand condition, and moderate power for n = 1,000 for the Collapse 2 condition. Across all simulation conditions, the power for the Collapse 1 condition was low. This indicates that S − X2 was not sensitive to the type of misspecification caused by the collapsing of categories for moderate sample sizes, or moderate amounts of collapsing.
As shown in Table 3, the power of the NRM-based test was low for the n = 100 conditions and moderate to high for the other sample sizes. For the simulation conditions with 12 items and 100 respondents, the scenarios with the lowest power to estimate the item-level parameters, both the Type 1 error rates and the power of the NRM-based test were 0, indicating that the NRM-based test was unable to detect the proper category specification. The NRM-based test attained full power for sample sizes greater than 500, while the IMT only attained full power for a sample size of 1,000 respondents. However, the NRM-based test had lower Type 1 error rates than the nominal size of the test across most simulation conditions, indicating that the test was more liberal in encouraging the collapsing of categories than should be expected.
Application to Verbal Aggression Data
A commonly analyzed data set in the illustration of IRT methods consists of 316 responses to 24 items referring to verbally aggressive reactions to situations that may be frustrating (e.g., De Boeck & Wilson, 2004; Magis, Béland, Tuerlinckx, & De Boeck, 2010; Vansteelandt, 2000). Responses to the items are collected on a 3-point Ordinal Scale, with categories labeled as “yes,” “perhaps,” or “no.” The data set is publicly available, through the
The 24 items are constructed by varying three factors: situation, behavior mode, and potential action. The first factor consists of four situations, two of which are self to blame: “The grocery store closes just as I am about to enter” and “The operator disconnects me when I had used up my last 10 cents for a call”; and two of which are others to blame: “A bus fails to stop for me” and “I miss a train because a clerk gave me faulty information.” The second factor consists of two behavior modes: want and do. The third factor consists of three potential actions: curse, scold, and shout. An item is then constructed, for example, as “A bus fails to stop for me. I would want to shout.” For the sake of simplicity, this analysis focuses on the first 12 items of this data set, pertaining to the behavioral mode “want.”
A PCM was fit with the items scored on the original 3-point Response Scale. Figure 4 shows the ICCCs for Items 1 (“A bus fails to stop for me. I would want to curse”) and 8 (“The grocery store closes just as am about to enter. I would want to scold.”) In both items, it appears that the second score category is nearly submerged beneath the others. In fact, this data set is also commonly used in a dichotomized format, where the second and third categories have been collapsed, to illustrate dichotomous DIF procedures and is available in dichotomous form through the
Item category characteristic curves for Items 1 (left) and 8 (right) under a partial credit model fit to the first 12 items of the verbal aggression data set.
To answer the first question, the IMT was used to test the threshold parameters of each item separately, resulting in 12 χ2 tests each on three degrees of freedom. To control the false discovery rate and alleviate concerns due to multiple comparisons, the p values were adjusted using the Benjamini–Hochberg (1995) procedure. To answer the second question, the items were dichotomized one at a time, by collapsing the second and third categories, termed collapsed up. A PCM was fit to the new, collapsed data, and the IMT was used to test the threshold parameter of the collapsed item. This resulted in 12 χ2 tests, each on 1 degree of freedom, and the p values were similarly adjusted. To answer the third question, the items were dichotomized one at a time, by collapsing the first and second categories, termed collapsed down. As in the previous cases, a PCM was fit and the IMT was applied to the collapsed item to obtain an adjusted p value.
Table 4 shows the adjusted p values for the IMT applied to each of the three category specifications. In the first column, only the p value for Item 8 is statistically significant at the α = .05 level, indicating that for 11 of the 12 items tested, there is insufficient evidence to reject goodness of fit of the PCM on this category specification. When the middle category is collapsed up, the second column of Table 4 shows that while Item 8 no longer rejects goodness of fit, instead Items 1, 2, 4, and 5 reject goodness of fit when they had not previously. Therefore, collapsing the middle category creates more potential issues with lack of fit than it solves. The third column shows that if the middle category is collapsed down into the first category, then the IMT fails to reject goodness of fit for all items.
Adjusted p Values for the Information Matrix Test Applied, Item by Item, to the Verbal Aggression Data Set

Note. The first column shows p values for the information matrix test (IMT) on the original data, consisting of three categories. The second column shows p values for the IMT when the second and third categories are collapsed. The third column shows p values for the IMT when the first and second categories are collapsed.
* Statistically significant p values at the α = .05 level.
As a comparison to the IMT, the S − X2 statistic was used to assess goodness of fit of each of the three category specifications. First, the S − X2 statistic was calculated and tested for each item individually under the original category specification. To control the false discovery rate and alleviate concerns due to multiple comparisons, the p values were adjusted using the Benjamini–Hochberg (1995) procedure. Second, the items were dichotomized one at a time, by collapsing the second and third categories to achieve the collapsed up condition. A PCM was fit to the new, collapsed data, and the S − X2 statistic was calculated and tested for each item. This resulted in 12 χ2 tests and the p values were similarly adjusted. To answer the third question, the items were dichotomized one at a time, by collapsing the first and second categories, to achieve the collapsed down condition. As in the previous cases, a PCM was fit and the S − X2 statistic was calculated and tested to the collapsed item to obtain an adjusted p value.
Table 5 shows the adjusted p values for the S − X2 statistic applied to each of the three category specifications. Under all three category specifications, goodness of fit is not rejected for any of the items. This implies that the S − X2 statistic does not have the power necessary to detect the potential misspecification caused by collapsing categories.
Adjusted p Values for the S − X2 Statistic Applied, Item by Item, to the Verbal Aggression Data Set

Note. The first column shows p values for the S − X2 on the original data, consisting of three categories. The second column shows p values for the S − X2, when the second and third categories are collapsed. The third column shows p values for the S − X2, when the first and second categories are collapsed.
Lastly, the NRM-based test was used to assess two comparisons. First, the collapse up condition was compared to the original category specification. Second, the collapse down condition was compared to the original category specification. For both comparisons, the items were collapsed one at a time, and an NRM was fit to the collapsed data. The null hypotheses tested were that the CBD parameter for the middle category was equal to 0 for the comparison with the collapsed down condition and that the CBD parameter for the middle category was equal to 2 for the comparison with the collapsed up condition. Each test conducted was a Wald test on 1 degree of freedom. The Benjamini–Hochberg procedure was again used.
Table 6 shows the adjusted p values for the NRM-based test applied to each of the two category comparisons. For the comparison between the collapsed up and original condition, the NRM-based test rejected the null hypothesis in 11 of the 12 items. For the comparison between the collapsed down and the original condition, the NRM-based test rejected the null hypothesis in all 12 items. Therefore, the test of the NRM parameters indicates that collapsing is inappropriate for this data set for 23 of the 24 item comparisons.
Adjusted p Values for the Nominal Response Model (NRM)-Based Test Applied, Item by Item, to the Verbal Aggression Data Set

Note. The first column shows p values for the NRM-based test for the comparison between the original data and the collapsed up condition. The second column shows p values for the NRM-based test for the comparison between the original data and the collapsed down condition.
* Statistically significant p values at the α = .05 level.
Therefore, this analysis illustrates how the IMT, S − X2, and NRM might be used in practice to determine if, and if so, which, collapsing can be applied to a given data set. In conclusion, the NRM-based test proved to be the most useful in determining that collapsing was inappropriate for this data set.
Discussion
This article details the implementation of an information matrix goodness-of-fit test that can assess the degree of misspecification induced by collapsing categories under the partial credit model and compares it to the S − X2 statistic and an approach based on the NRM. While some may consider collapsing categories as a data-processing step, the second section shows that if the data are originally generated from a PCM, once collapsing occurs, the true model for the collapsed data is no longer a PCM. Therefore, collapsing categories must be considered as part of modeling, not processing, the data. The IMT, as proposed by White (1982) and reviewed in the fourth section, could be used to determine whether to collapse categories.
The fifth section presents a simulation study to explore the finite-sample properties of the IMT under a variety of scenarios where collapsing may occur. This simulation study shows that in reasonably powered situations, such as for a large enough sample size of respondents and items, the IMT is able to determine the true number of categories for an item under the PCM. In the lower powered cases where n = 100, the low power of the Collapse 1 condition indicates that the test may fail when the degree of collapsing is small. However, this simulation study only focused on collapsing categories of 1 item. Therefore, if categories on more than 1 item are collapsed, as would be the case when all items are dichotomized, the degree of misspecification induced by the collapsing would likely be higher.
In all of our simulation conditions, however, the collapsed category was in the center of the latent trait distribution and therefore directly affected a larger proportion of respondents than if the highest or lowest score category were collapsed. In such a case where the collapsed category was at either end of the Response Scale, fewer respondents would be directly affected, and, thus, we would expect the power of the IMT to be lower. Furthermore, in each of our simulation conditions, there was at least one respondent in the collapsed category, allowing for the estimation of that category’s threshold parameters. In a case where a category contains no respondents, data analysts may have no choice but to collapse.
The simulation study also explored the utility of the S − X2 item-fit statistic, and a test of the CBD parameters from an NRM, to detect the correct category specification under the PCM. The S − X2 item-fit statistic had low power and, thus, was not sensitive to the type of misspecification caused by collapsing categories. The NRM-based test attained high power for moderate and large sample sizes (n = 500 and n = 1,000) and moderate power for n = 250. Specifically, for moderately or high-powered situations, the NRM-based test was able to detect the correct category specification more often than the IMT or S − X2 statistics, indicating that for the issue of collapsing categories, the approach based on the NRM was promising and should prove useful in practice.
However, there are a few potential issues with the NRM-based test. First, while the IMT is a goodness-of-fit test as well, and may be sensitive to other forms of model misspecification, the NRM-based test could only be used to detect issues pertaining to collapsing categories. This may be an issue if a researcher obtains data that have already been collapsed, as may be the case when issues arise pertaining to confidentiality or data privacy, since the NRM-based test is unable to determine whether the PCM adequately fits the data. Second, in situations where there are a large number of items and a small number of respondents, the NRM-based test had lower power than the IMT, as evidenced in the J = 12, n = 100 condition. Therefore, if the ratio between the number of items and the sample size of respondents is too high, then the NRM-based approach may underperform, as compared with the IMT. This is likely due to the fact that under the NRM, there are a large number of parameters to be estimated, resulting in high levels of variability in each of the parameter estimates.
As shown in the third section, methods based on a visual inspection of the ICCC or IIF are based on estimated item-level parameters under misspecified models without a measure of how far these estimates are from the true model for the collapsed data. Furthermore, for a given data set, two people may apply the same procedure but come to different conclusions since the final decision about the utility of a category is left to the judgment of the data modeler. These methods were not investigated in the simulation study due to their subjective nature. Future research could attempt to formalize these methods and investigate their potential. Similarly, common likelihood-based statistical approaches for model selection, such as the AIC or BIC, are not easily applied. Jackson, Gray, and Fienberg (2008) explore ways to compute deviances for collapsed contingency tables under hierarchical joint log-linear models. However, the model they consider is collapsible across factors, while the PCM is only conditionally collapsible across items conditional on the latent trait, and therefore not hierarchical in the margins. Therefore, these methods are not appropriate for use in practice.
The sixth section illustrates how the IMT, S − X2, and the NRM can be used in practice through the analysis of a data set containing responses to a verbal aggression questionnaire. This analysis showed that while some may dichotomize data out of convenience, in the case of the data set in question, there was little evidence to support collapsing categories. Furthermore, if the data were to be dichotomized, then the direction in which middle category was collapsed, that is, either up or down, had implications for the goodness of fit of the PCM. The NRM-based tests showed that collapsing either up or down was not statistically justified in almost all cases. For the IMT, one reason that few items rejected goodness of fit after the categories have been collapsed may have been due to the low power of the IMT in this scenario. In this example, the S − X2 statistic was unable to discriminate between the goodness of fit of the three category specifications. One thing to note, however, is that while we apply the three methods to a data set frequently used in the context of DIF, we do not intend to suggest that they provide the best information regarding collapsing for detecting DIF.
Another potential application of these methods pertains to the selection of the optimal number of categories for an item during the instrument design process. When developing a measure, it may be unclear how many score categories would be most appropriate for a particular Likert-type scale item. If it is possible to collect pilot data on a variety of options of potential response scales, then the IMT may be used to provide an empirical justification for the most appropriate number of categories under a PCM.
We explored, through preliminary simulations, the use of the IMT when fitting a GPCM to collapsed data. We observed computational challenges due to dependence among the item-level parameters. Specifically, the inclusion of a discrimination parameter led to a linear dependence among the total set of item-level parameters. Therefore, as discussed in the fourth section, such dependence requires the careful selection of which parameters should be tested through the IMT. Choosing the best set of parameters to test in this context was not obvious due to the complexity of the dependence structure. It should be noted that an extension of the IMT to the GPCM, or more broadly to the NRM, may result in a test of lower power due to their increased flexibility over the PCM. In such a case, even if the model were misspecified, it may be possible to obtain parameter estimates close enough in Kullback–Liebler divergence to the true model, resulting in a failure to reject goodness of fit.
Similarly, one could argue that fitting a graded response model, for which the joining assumption is known to hold, would be preferable if collapsing categories is necessary. However, if the true data-generating model is a member of the logistic adjacent-category class, then fitting a graded response model is also a form of model misspecification that must be characterized and understood. Therefore, we believe these two issues would be very interesting avenues for future research.
In conclusion, the IMT and NRM provide practical and theoretically justified tools to assess the correct category specification when collapsing categories. In situations where collapsing categories may be unavoidable, or even potentially desirable, the IMT and an NRM-based test can be used to determine if collapsing categories has violated modeling assumptions for a particular data set and thus allow for a more rigorous and systematic approach to selecting the appropriate category specification for an item.
Supplemental Material
Supplemental Material, DS_10.3102_1076998618787478 - An Information Matrix Test for the Collapsing of Categories Under the Partial Credit Model
Supplemental Material, DS_10.3102_1076998618787478 for An Information Matrix Test for the Collapsing of Categories Under the Partial Credit Model by Daphna Harel, and Russell J. Steele in Journal of Educational and Behavioral Statistics
Footnotes
Acknowledgments
We acknowledge and thank the reviewers and associate editors for their comments that greatly improved this article.
Declaration of Conflicting Interests
The author(s) declared no potential conflicts of interest with respect to the research, authorship, and/or publication of this article.
Funding
The author(s) disclosed receipt of the following financial support for the research, authorship, and/or publication of this article: Dr. Harel’s work is funded by NYU start-up research funds. Dr. Steele’s work was funded by a Discovery Grant from the Natural Sciences and Engineering Research Council of Canada (NSERC).
References
Supplementary Material
Please find the following supplemental material available below.
For Open Access articles published under a Creative Commons License, all supplemental material carries the same license as the article it is associated with.
For non-Open Access articles published, all supplemental material carries a non-exclusive license, and permission requests for re-use of supplemental material or any part of supplemental material shall be sent directly to the copyright owner as specified in the copyright notice associated with the article.