
Abstract
The development of academic English proficiency and the time it takes to reclassify to fluent English proficient status are key issues in English learner (EL) policy. This article develops a shared random effects model (SREM) to estimate English proficiency development and time to reclassification simultaneously, treating student-specific random effects as latent covariates in the time to reclassification model. Using data from a large Arizona school district, the SREM resulted in predictions of time to reclassification that were 93% accurate compared to 85% accuracy from a conventional discrete-time hazard model used in prior literature. The findings suggest that information about English-language development is critical for accurately predicting the grade an EL will reclassify.
English learner (EL) students often face considerable academic challenges as they attempt to develop content knowledge in core academic subjects and English language proficiency in tandem (Council of Chief State School Officers, 2016; Linquanti & Cook, 2013; Pompa & Villegas, 2017). The Every Student Succeeds Act (ESSA) of 2015 defines ELs as students whose difficulties in speaking, reading, writing, or understanding the English language may prevent them from meeting challenging state academic standards or succeeding in a classroom where the language of instruction is English (ESSA regulatory guidance). These difficulties often mean that ELs have lower achievement and higher dropout rates than their academic peers (Kao & Thompson, 2003; Pompa & Villegas, 2017). Given ELs constitute a rapidly growing student subgroup in U.S. schools (Cook, Linquanti, Chinen, & Jung, 2012), educators and policymakers have made the education of ELs a major emphasis in federal, state, and local policy (Hopkins, Thompson, Linquanti, Hakuta, & August, 2013; Pompa & Villegas, 2017). For example, under ESSA, districts and schools are held accountable for how quickly ELs develop English proficiency, as well as their achievement in core subjects like mathematics and reading (Council of Chief State School Officers, 2016).
A pivotal moment in ELs’ schooling is when they are reclassified as “fluent English proficient” (Umansky & Reardon, 2014), which is the point at which the student is no longer considered an EL. EL status is associated with academic supports like modified instructional content, English-language development classes, instruction from specialized teachers, and annual assessment of English language proficiency (Council of Chief State School Officers, 2016; Pompa & Villegas, 2017; Umansky & Reardon, 2014). However, once students are deemed proficient enough in English to succeed in mainstream English classrooms, they are reclassified and those supports either diminish or disappear entirely, as do most of the federal funds earmarked for those supports (Council of Chief State School Officers, 2016; Pompa & Villegas, 2017; Robinson, 2011). Depending on when students are reclassified, the transition could either slow their development if the new material is overwhelming or accelerate it if they gain access to advanced material they are prepared to learn (Abedi, 2008). Factors influencing a student’s readiness can include the type of educational program they were enrolled in (Umansky & Reardon, 2014) and the student’s native language (Slama, 2014).
Reclassification can be based on several factors, but virtually all states use some combination of reading achievement test scores and English language proficiency test scores as criteria (Pompa & Villegas, 2017). Given policymakers usually set cut cores on these tests for the purposes of reclassifying ELs, state and local reclassification criteria can impact when an EL reclassifies and, thereby, whether that transition is appropriately timed. A growing body of evidence documents the consequences of reclassifying ELs before or after they are ready. Robinson (2011) found that, in the district he studied, reclassification had a null effect on reading achievement for students in elementary and middle grades, but significant negative effect for students in high school, suggesting no evidence that the cutoff was inappropriately set in younger grades, but that students in later grades did not appear to benefit from having EL services reduced or discontinued. Robinson-Cimpian and Thompson (2016) also looked at how changes in reclassification criteria over time impacted achievement and graduation rates. They found that higher reclassification benchmarks were associated with a 0.18 standard deviation (SD) increase in reading achievement and a 11 percentage point increase in graduation rates.
Given the importance of the decision to reclassify and its timing, several studies use discrete time survival analysis to model time-to-reclassification (Kieffer & Parker, 2016; Motamedi, Singh, & Thompson, 2016; Thompson, 2015b; Umansky & Reardon, 2014). From a policy standpoint, such models are useful in three primary ways. First, they can be used to estimate an average time to reclassification that helps educators know how fast ELs entering the school system can be reasonably expected to reclassify (Hakuta, Butler, & Witt, 2000; Motamedi et al., 2016). Related information can inform policies to hold schools accountable for the achievement and language development of ELs, including how to avoid policies that expect students to be reclassified in an unreasonable amount of time (Parrish, Perez, Merickel, & Linquanti, 2006). Second, such estimates can inform early warning systems designed to identify and support ELs who are not on track to reclassify in roughly the average amount of time (Kieffer & Parker, 2016; Motamedi et al., 2016). Third, these models can help evaluate the effects of different educational programs for ELs on time to reclassification (Umansky & Reardon, 2014). For example, Umansky and Reardon (2014) showed that ELs in dual language programs were reclassified at a slower pace than ELs in other programs but that those same students had higher overall reclassification rates and English proficiency by 12th grade.
While studies using discrete time survival analysis to model time to reclassification have made valuable contributions to EL practice and policy, the models generally do not account for the rate at which English proficiency develops for individual students. For example, most of the models reviewed included controls for initial English language proficiency in Kindergarten but did not model growth in that language proficiency over time. This omission could represent a shortcoming of the models, given reclassification determinations under state policy are largely a function of when a student is deemed proficient in English, which is in turn a function of how fast the student’s English develops (Cook et al., 2012; Pompa & Villegas, 2017; Ramsey & O’Day, 2010). In fact, research shows it is likely unrealistic for English proficiency to develop at the same rate across students (Cook, Boals, & Lundberg, 2011), suggesting that including a student’s unique developmental trajectory in the time-to-reclassification model would likely be highly predictive of reclassification.
One reason English-language development is not included in discrete time survival analysis models for reclassification is that the observed test scores used to measure language proficiency over time would be endogenous time-varying covariates measured with error (Kalbfleisch & Prentice, 2011), which can induce bias in the parameter estimates (Prentice, 1982). To address this technical issue—and the gap in the EL literature—we fit two discrete-time survival models akin to those from prior studies (including using controls for initial English proficiency) and two shared random effects models (SREMs) that jointly estimate a growth model based on longitudinal English language proficiency test scores and a discrete-time survival model for the reclassification data that include the random effects estimated from the growth model as latent covariates. In doing so, we examined whether growth in English language proficiency can improve predictions of time to reclassification. After fitting the models, we compared them based on their ability to accurately predict the time at which a student reclassified. As we show in the study, the SREMs substantially improved rates of accurate classification of students as either remaining in EL status or being reclassified at a given point in time.
Joint Models for Repeated Measures Data and Discrete-Time Event Data
In research using cross-sectional data, covariate endogeneity for a fitted model exists when the covariance between the covariate and the residual does not equal zero (Angrist & Pischke, 2008). In the longitudinal context, covariate endogeneity becomes more complex and has been well studied in both the analysis of repeated measures data (Diggle, Zeger, Liang, & Heagerty, 2002) and the analysis of survival data (Kalbfleisch & Prentice, 2011). For survival analysis, a time-dependent variable is exogenous (referred to as external in the survival literature) if its process influences the rate of event occurrence over time, but its future path is not affected by the occurrence of the event (Kalbfleisch & Prentice, 2011). Such variables include defined covariates where the values are established in the study design and ancillary covariates where the stochastic process is outside of the individual under study. In an experimental setting, examples of exogenous time-dependent covariates include varying treatments determined prior to randomization.
A time-dependent variable is endogenous (referred to as internal in the survival literature) if its future path is affected by the event occurrence (Kalbfleisch & Prentice, 2011). These variables are typically the output of a stochastic process associated with the participant and therefore require their own statistical model (Kalbfleisch & Prentice, 2011). The SREM provides a useful approach for incorporating endogenous time-varying covariates into survival analysis (Kalbfleisch & Prentice, 2011; Rizopoulos & Lesaffre, 2014). Below, we provide the formulation of the SREM and review its application in research.
The SREM provides a robust framework for describing the association between one or more repeated measures outcomes and event times (see Guo & Carlin, 2004; Proust-Lima, Séne, Taylor, & Jacqmin-Gadda, 2014; Tsiatis & Davidian, 2004). For a single continuous repeated measure outcome and a single discrete event occurrence, the SREM can be understood through the specification of a submodel for each outcome that highlights their dependence structure. Start by expressing a mixed model for the repeated measures outcomes. Let there be

where

For Equation 1,
Because reclassification can only occur at discrete time points,
When fitting discrete event time data, one has the option of using a logit link function or a complementary log-log (clog-log) link function. Use of the clog-log link leads to the proportional hazard model while opting for the logit link leads to the proportional odds model. Only when the temporal distance between the discrete events becomes small can the estimates be interpreted on the hazard scale (Singer & Willett, 2003). For this article, we use the logit link function, and because reclassification is an annual event, the model is a proportional odds model. The log odds of reclassification for student j at time t can be expressed as

and the probability of reclassification as:

where
Assuming the repeated measures are independent from the reclassification indicators given the random effects, we can express the conditional probability density for the SREM as

where
The SREM paradigm has been well developed in the statistics and biostatistics literatures. The first SREM was published by Wu and Carroll (1988) to deal with what Little (1995) termed latent variable dependent missingness. The use of SREMs to understand the association between a set of repeated measures and the time to some event was popularized by early HIV clinical trials (De Gruttola & Tu, 1994; Tsiatis, Degruttola, & Wulfsohn, 1995; Wulfsohn & Tsiatis, 1997). These studies aimed to understand how C4D T-lymphocytes were associated with onset of AIDS or death for those subjects with HIV. Henderson, Diggle, and Dobson (2000) utilized an SREM to reanalyze the effect of drug therapy for schizophrenia patients while simultaneously accounting for attrition.
The SREM framework has been less commonly used in education research. Muthén and Masyn (2005) fit a latent class growth model to students’ aggressive behavior in Grades 1 and 2 that was used to predict the time to removal in Grades 3 through 7 using a discrete time survival process with a latent class frailty. Feldman and Rabe-Hesketh (2012) employed an SREM to understand if achievement trajectories were impacted by possibly nonrandom dropout in a large national data set. Their discrete-time hazard submodel included separate parameters for the random intercept and random slope. Estimates from the SREM and a competing model fit to the data assuming the missing data mechanism was ignorable were consistent, suggesting the data were not sensitive to missing data assumptions (Feldman & Rabe-Hesketh, 2012). Finally, Thum and Matta (2015a, 2015b) employed an SREM for longitudinal interim assessments between Grades 4 and 9, SAT and ACT scores between Grades 10 and 12, and a logistic regression model for the probability of taking a college test. The parameter estimates were then used to establish college readiness benchmarks for the interim assessment.
Method
Data
The data were from a single cohort of ELs tracked longitudinally from third grade in academic year 2007–2008 through seventh grade in 2011–2012 from a large urban school district in Arizona. During this time, Arizona implemented an English-only instruction law resulting in homogeneity of language programs across schools (Gándara & Orfield, 2010). The Grade 3 EL cohort consisted of 277 students in 18 schools or 20.77% of all third grade students in the district. By Grade 7, there were 20 ELs in 5 schools remaining.
The outcome variables for this study included students’ repeated Arizona English Language Learner Assessment (AZELLA) total score as well as the binary indicator of student reclassification from EL to fluent English proficient. Each student has a collection of AZELLA total scores for each year they were classified as an EL. The AZELLA total score is a vertically scaled item response theory (IRT)-based score that is a composite of reading, writing, listening, and speaking scores (Harcourt, 2007). The vertical scale of the total score provides a foundation for analysis of the measures across grades, enabling the estimation of growth in English, or English-language development. The binary reclassification indicator was coded 0 for each grade a student was classified as an EL and was coded 1 for the grade in which a student met the reclassification criteria. After reclassification, the student was no longer tracked. For these data, and consistent with the Arizona reclassification policy at the time, a student was reclassified when they earned an AZELLA total score that exceeded the proficiency threshold (Harcourt, 2007).
For this study, the AZELLA Scale was transformed by dividing observed scores by 10 for computational purposes. Figure 1 plots the sample median, first and third quartile, and .025 and .975 percentiles at each grade for the AZELLA total score. Student with a disability (SWD) status was coded as 1 for those ELs who were ever classified as a SWD and as 0 for those ELs who were never classified as a SWD. Across the sample, 83.75% of students were never diagnosed with a disability. Finally, female ELs made up 48.38% of the sample and were coded as 0, while males were coded as 1. Potential idiosyncrasies of Arizona’s English language policies and practices, and their impact on generalizability, are discussed in the Limitations section.

Sample quartiles for Arizona English Language Learner Assessment total scores by grade.
Analysis
In this study, we compared how accurately discrete time survival analysis models used in prior literature (Slama, 2014; Thompson, 2015a; Umansky & Reardon, 2014) and SREMs predicted when an EL student reclassified. For these data, there were
The first two models used discrete time survival analysis, with Model 1 (M1) controlling for disability status and Model 2 (M2) controlling for disability status and initial English language proficiency. M2 was very similar to the models used in several other studies (Slama, 2014; Thompson, 2015a; Umansky & Reardon, 2014). The third and fourth models were SREMs. Model 3 (M3) included disability status and the random student intercept from the AZELLA growth model in the reclassification model, which is akin to including a latent estimate of initial language proficiency. Thus, M3 and M2 were similar, with the latter using a manifest covariate for initial status and the former using a latent covariate. Model 4 (M4), the second SREM, added the random slope coefficient from the AZELLA growth model (linear growth trajectory).
All four models were built from two submodels, one to estimate reclassification and the other to estimate English-language development as measured by the longitudinal AZELLA scores. In the SREMs (M3–M4), the two submodels shared student-specific random effects. In the traditional discrete time survival analysis models (M1–M2), the submodels were estimated simultaneously but were not connected by random effects (nor by any other parameter). The two submodels were estimated together in M1 and M2, so that the number of parameters were more comparable across discrete time survival analysis models and SREMs, which made comparing model fit more straightforward. In the remainder of the Methods section, we detail our four models, including submodels for reclassification and language development, and discuss how we compared model fit.
The four models have been depicted by two directed graphs in Figure 2. Figure 2a characterizes the simultaneous but separate estimation of M1 and M2. The directed path from g to y illustrates the regression of the repeated measure y on grade g at occasion t for student j. The student-specific random effects are characterized by the round nodes, the random intercept,
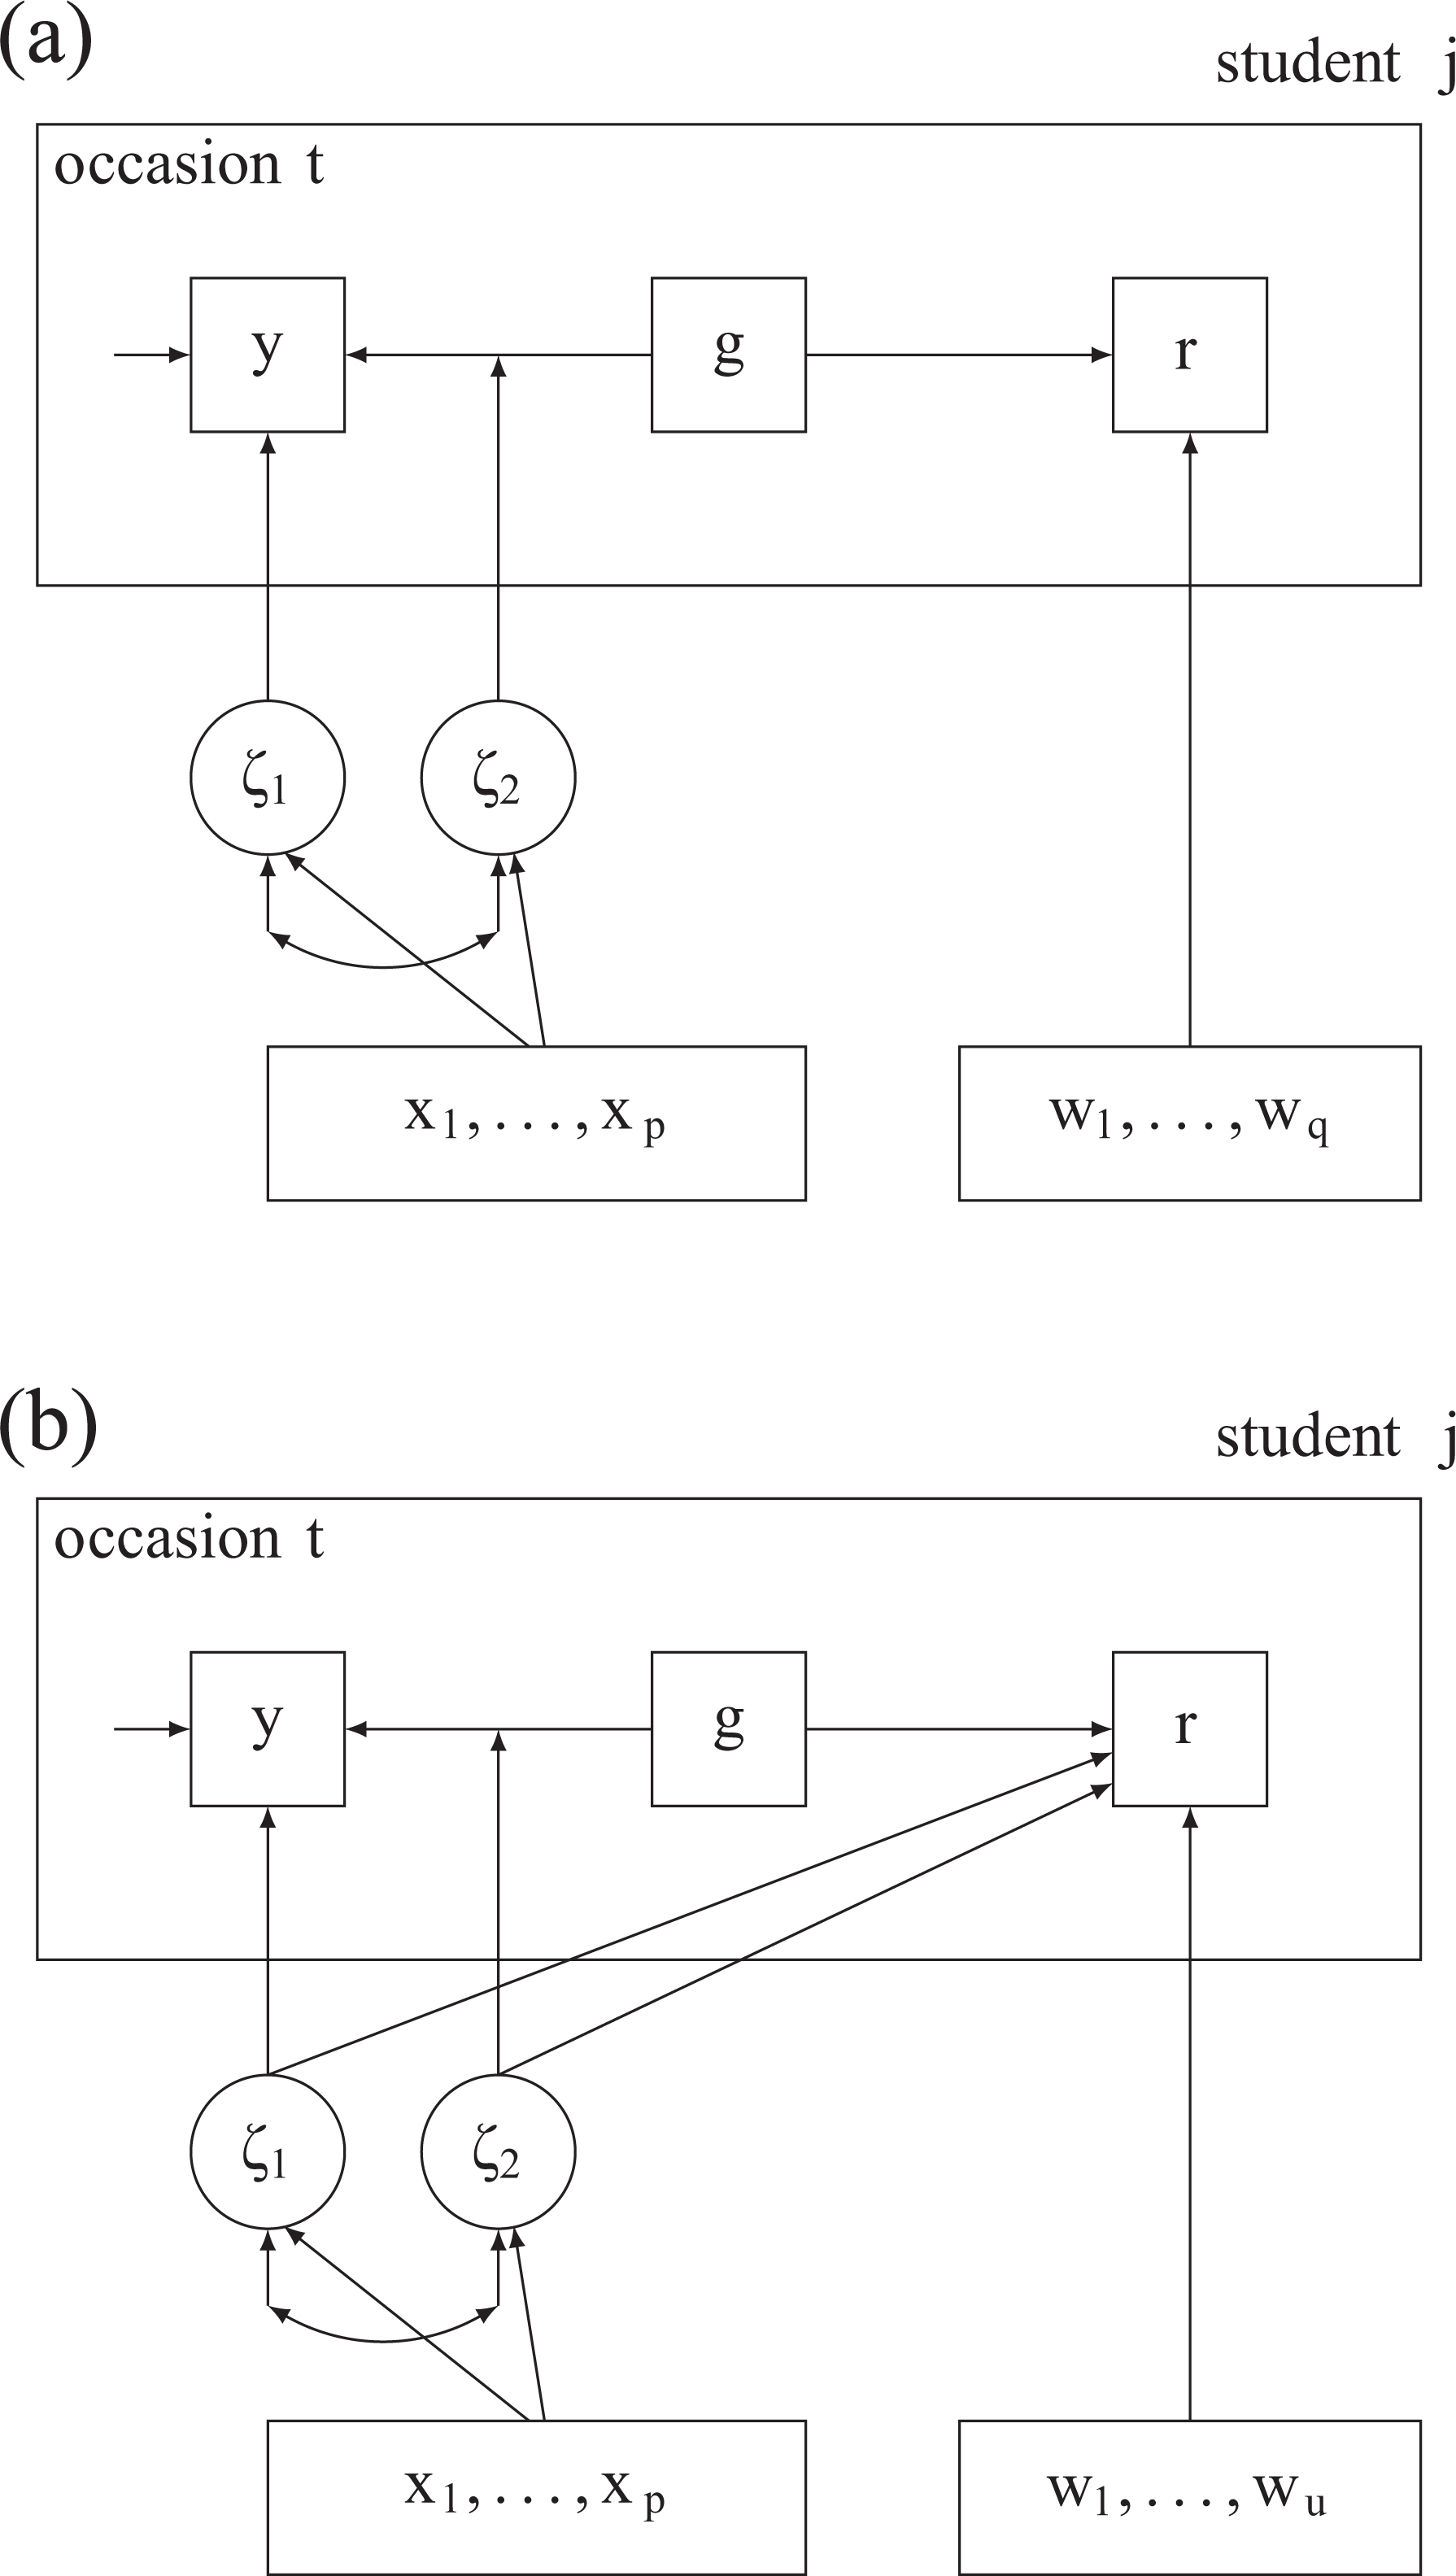
Directed graphs for English language proficiency (y) growth and time-to-reclassification (r). (a) Separate growth and reclassification models with covariates (M1 and M2). (b) Shared random effects model with covariates (M3 and M4).
The growth submodel estimated for the longitudinal AZELLA total scores can be expressed as a unit-level model:

where β was the p × 1 vector of fixed effects corresponding to the known p × 1 vector of explanatory variables,
The final growth submodel was selected based on the evaluation of a series of univariate growth models using a systematic search for the best functional form. Because so many students in the sample were reclassified between third and fifth grade, however, the number of potential growth models was limited. Both linear and quadratic functions for the mean structure were assessed, although the data supported student- and school-level variance components for the intercept and linear growth component only. The final growth submodel used in all four models included main effects for female and disability status as well as a disability status by linear growth interaction.
All four reclassification submodels utilized a logit link, resulting in a proportional odds model for reclassification. The first two submodels can be expressed as

where
Recall that M3 and M4 are the SREMs. As such, the reclassification submodels included student-specific random effects estimated by the growth model as latent covariates. We express the reclassification submodels for M3 and M4 as

where
All models were fit within the probabilistic modeling language Stan (Gelman, Lee, & Guo, 2015) using Hamiltonian Monte Carlo estimation (Hoffman & Gelman, 2014). Unless otherwise noted, uninformative priors were specified such that a random variable, x, was
Predictive Accuracy
Model performance was evaluated in two ways, by information criteria and classification accuracy. We use approximate leave-one-out (LOO) cross-validation using Pareto smoothed importance sampling (Gelman, Hwang, & Vehtari, 2014; Vehtari, Gelman, & Gabry, 2016) for an information criteria-based metric. LOO computes the expected log pointwise predictive density for a new data set, elpd, and may be multiplied by
The performance of the four models was also compared based on classification accuracy. ELs are eligible for reclassification at discrete times,
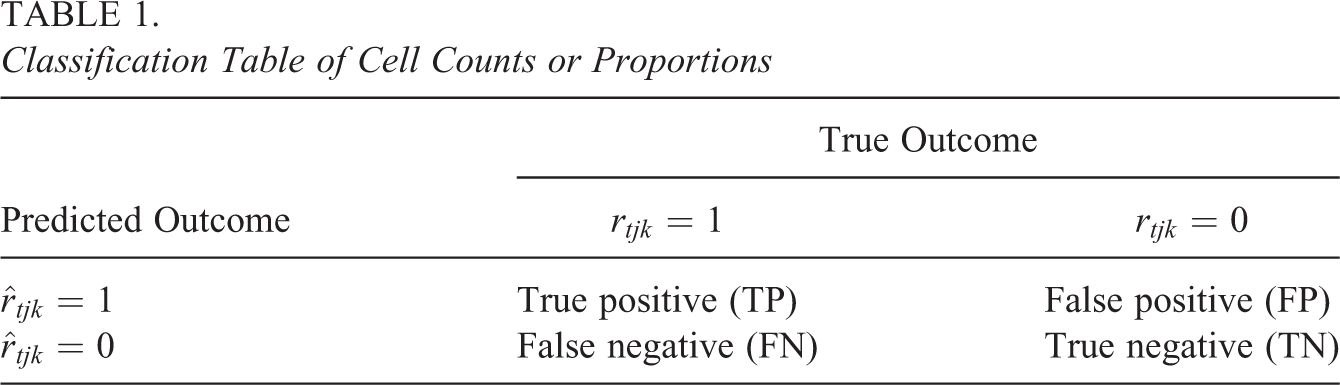
The classification accuracy of the models can be understood through the cross-classification of
Classification Table of Cell Counts or Proportions

The receiver operating characteristic (ROC) curve was generated by computing the TPRs and TNRs for
Results
Four models were fit to understand whether, and to what extent, students’ English-language development improved predictions of time to reclassification. The first model, M1, predicted reclassification using students’ disability status as a time-invariant manifest covariate. The second model, M2, added initial (Grade 3) English proficiency scores as a manifest covariate. The third model, M3, the first SREM, replaced the manifest initial English proficiency score with the student-specific initial status random coefficient from the AZELLA growth model as a latent covariate. The final model, M4, the second SREM, added the student-specific linear growth random coefficient from the AZELLA growth model. The fitted models were compared based on their LOOIC and their ability to accurately predict the time a student reclassified. Table A1 in the Appendix provides posterior means and SDs for the parameters associated with the four models.
Model Fit
The LOOIC for each model is presented in Table 2. Comparing M1 to M2, the difference in the LOOIC, compared to its standard error, suggests there is an improvement in model fit when the Grade 3 English proficiency scores are used to predict reclassification,
Model Fit and Classification Statistics for Fitted Models

Note. Classification statistics were computed using π = .5. LOOIC is the deviance-scaled approximate leave-one-out cross validation, TPR is the true positive rate, TNR is the true negative rate, ACC is accuracy, AUC is the area under the curve. M is the posterior mean and SD is the posterior standard deviation.
The likely reason M3 outperforms M2 by so much, and why M4 shows little improvement over M3, is due to the fact that the growth submodel estimates the random coefficients as a bivariate normal with a strong positive correlation. As a result, the latent intercept covariate in the M3 reclassification submodel is borrowing information from the slope coefficient through the estimated correlation. This becomes clearer when we examine the parameter estimates of M3 and M4 in Table A1. For M3, the estimated correlation between the initial status and linear growth is
Classification Accuracy
The classification statistics regarding how well each of the four models predicted whether or not reclassification would occur for subject j at time t are presented in Table 2. Using π = .5 as a probability threshold, M1 was 80% accurate when predicting whether reclassification did or did not occur for the 720 observations across 277 ELs. The TPR was .73 indicating that 73% of the ELs who reclassified at the end of a given grade were predicted by the model to reclassify at the end of that grade. The TNR was .88 indicating that 88% of the students who did not reclassify at the end of a given grade were also predicted by the model to not reclassify at the end of that grade. The area under the curve (AUC) was .78 which is illustrated by the ROC curve in Figure 3. In the context of model comparison, the AUC and ROC curve for M1 provided a baseline to compare the predictive power of the remaining three models.

Receiver operating characteristic curves for the time-to-reclassification models.
Including the manifest Grade 3 English proficiency scores in the reclassificaiton model improved the classification accuracy by 5 percentage points over the baseline. The TPR was .76, the TNR was .85, and the AUC was .82. The first SREM with only a latent covariate for initial English proficiency, M3, predicted the time to reclassification with 93% accuracy. The TPR was .89 indicating that 89% of the ELs who reclassified at the end of a given grade were predicted by the model to reclassify at the end of that grade. The TNR was .95 indicating that 95% of the students who did not reclassify at the end of a given grade were also predicted by the model to not reclassify at the end of that grade. Furthermore, the AUC for the model was .92. Finally, the inclusion of the latent growth coefficient in the last model, M4, resulted in the same classification statistics as M3. The classification statistics corroborate the results from the
Subject-Specific Predictions
Student-specific predictions from M4 are illustrated using the model estimates and observed data to plot both the subject-specific AZELLA total score growth trajectory and the subject-specific probability of reclassification for four individuals selected at random from the data set. Figure 4a to d illustrates the average developmental trajectory (dashed line) and the subject-specific developmental trajectory (solid line) for total English proficiency for four students in the data set. The five horizontal lines illustrate the reclassification benchmarks for each grade. Figure 4e to h illustrates the corresponding probability of reclassification at each grade for those same students. These plots demonstrate how, as a student’s estimated growth trajectory approaches the benchmark, his or her probability of reclassification increases.

Top row: Marginal (dashed) and subject-specific (solid) Arizona English Language Learner Assessment total English proficiency trajectories for a random sample of students. Bottom row: Probability of reclassification for the same random sample of students.
Figure 4a and e illustrates how Student 34’s probability of reclassification increased from nearly 0 to nearly 1 over 2 years as predicted scores increased. Figure 4b and f illustrates that, as Student 88’s predicted score exceeded the Grade 6 benchmark, there was a 40% chance he or she would reclassify at the end of Grade 6. While the student met the benchmark in Grade 6, the probability of reclassification remained low because the student was quite far from the average growth trajectory. Thus, using π = .5, Student 88’s Grade 6 prediction contributed to the model’s false negatives. Figure 4d and h illustrates that, as Student 96’s predicted score approached the benchmark, the probability of reclassification increased. Finally, Figure 3 illustrates the situation where the growth model incorrectly predicted Student 244 to reach the benchmark in Grade 5, but the estimated probability of reclassification at the end of Grade 5 remained lower than .5. By Grade 6, when the predicted score far exceeded the threshold (as did his or her observed score), the student’s probability of reclassification increased above .5 (to nearly 1).
Discussion
For students who enter the U.S. school system not speaking English, several factors influence when they are ready to benefit from English-only instruction in mainstream classrooms (Motamedi et al., 2016; Robinson-Cimpian & Thompson, 2016; Slama, 2014; Umansky & Reardon, 2014). Two of the most important factors are whether ELs have sufficient content mastery in core academic subjects like mathematics and whether their English language proficiency is sufficient to understand the instruction being given (Council of Chief State School Officers, 2016; Linquanti & Cook, 2013). The intent of reclassification policies is generally to identify students who meet these criteria and are ready to learn in mainstream classrooms. Learning core academic content and English are both complex developmental processes. Oftentimes, students learn colloquial English quickly but struggle to master some of the more complex language used in academic settings (Bailey, 2007; Scarcella, 2003), suggesting that language development is often nonlinear and asymptotic. These developmental language processes can also differ depending on how old the student is upon entering the United States and what the student’s original language is (Hakuta et al., 2000; Thompson, 2015a). Although researchers have used models to predict when a student will reclassify, these models do not incorporate English-language development (likely due to endogeneity concerns), opting instead to control for initial English proficiency (Slama, 2014; Thompson, 2015a; Umansky & Reardon, 2014). One could imagine explicitly accounting for language development in models designed to predict reclassification might improve on classification accuracy relative to those that do not.
The primary purpose of this article was to propose a multilevel SREM that shows whether heterogeneity in English-language development contributes to prediction of reclassification. These SREMs explicitly incorporate English-language development via a statistical model through a specification that incorporates its endogenous properties (Kalbfleisch & Prentice, 2011). The classification accuracy of these SREMs was then compared to that of more traditional discrete-time survival models used in the prior literature on reclassification (Slama, 2014; Thompson, 2015a; Umansky & Reardon, 2014). The final discrete-time survival model that controlled for whether the student was ever diagnosed with a disability and initial English proficiency status predicted the time of a student’s reclassification with 85% accuracy. The final SREM with disability status, and initial language status and linear growth random effects as predictors, by contrast, improved classification accuracy to 93%. While the predictive accuracy of the discrete-time survival model met most conventional criteria for diagnostic models (Steyerberg et al., 2010), classification rates based on the SREM were markedly better.
The superior predictive accuracy of the SREM was, in part, due to the fact that the growth submodel was able to track the longitudinal measures well. The SREM reclassification submodel utilized estimates that describe student-specific English development. Had the growth model fit the longitudinal data poorly, the estimates that characterize English-language development would likely have had little, or possibly detrimental, impact on predicting time-to-reclassification. That is, had the model-based estimates of English proficiency for a given student at a given grade been far off from the observed proficiency measures, their use as covariates in the reclassification submodel may not have had such a positive outcome. Therefore, although this article does not focus on the fitting of the growth submodel, one should realize the inherent connection between good model fit for the growth submodel and the classification accuracy of the survival submodel of the SREM.
Beyond predicting time of reclassification, SREMs likely have other potential uses in education, and for EL policy in particular. Specific to ELs, explicitly accounting for English-language development in models of reclassification could be useful when evaluating programs. For example, Umansky and Reardon (2014) used discrete-time survival models to show that ELs in dual language programs were reclassified at a slower pace than ELs in other programs, but that those same students had higher overall reclassification rates and English proficiency by the end of high school. Conducting a similar study using the SREM may provide additional insight. For example, the SREM would allow researchers to test if language development acts as a mediator between language program and time-to-reclassification.
There also may be benefits to using the SREM when modeling other educational outcomes. For instance, a vast literature describes early warning indicators that can be used to identify students at risk of dropping out and, ideally, intervene before the student gets offtrack (Balfanz, Herzog, & Mac Iver, 2007; Davis, Herzog, & Legters, 2013; Heppen & Therriault, 2008; Neild, Balfanz, & Herzog, 2007). One could imagine SREMs that incorporate survival models for dropout and developmental processes like growth in mathematics and reading might improve the accuracy with which dropout is classified, as well as help identify additional indicators that a student is not on track. Similarly, developmental processes for students with learning disabilities could be modeled in tandem with special education status to help understand those processes better. Although SREMs are still in their relative infancy, they show potential in helping to illuminate the complex processes that underlie educating students.
Limitations and Future Research
As discussed in the Data section, we used data from a large urban school district in Arizona collected between 2007 and 2012. Thus, one of the most significant limitations of this study is its generalizability. In particular, there are two broad threats to generalizability. First, the data were collected prior to the passage of ESSA when the No Child Left Behind (NCLB) Act of 2001 was still the law governing federal accountability related to ELs. Second, during this time, Arizona based reclassification entirely on whether students score above certain thresholds on their English language proficiency test. By contrast, states like California include educator and parent input in their reclassification decisions, as well as other criteria in some districts (Parrish et al., 2006). Arizona has also been the defendant in several lawsuits questioning the state’s reclassification policies, parts of which are still ongoing (Jimenez-Silva, Gomez, & Cisneros, 2014). These aspects of our sample naturally raise fundamental concerns about the generalizability of our findings.
Despite these concerns, there are several reasons the SREM is still likely valuable to educators interested in better understanding reclassification rates and timing. In terms of the policy context, while there are fundamental differences between how ESSA and NCLB treat ELs, one could argue the new federal law actually increased the emphasis on English-language development test scores and related growth trajectories. For example, whereas states needed to set English-language development standards in listening, speaking, reading, and writing under NCLB, ESSA goes one step further and requires that proficiency levels be defined in each of those subdomains (Council of Chief State School Officers, 2016). ESSA further requires states to report the number and percentage of ELs who attain language proficiency based on state English-language development standards and separately report the number and percentage of ELs who are reclassified based on their attainment of language proficiency (Council of Chief State School Officers, 2016).
Specific to state reclassification policy, there are also reasons that Arizona’s idiosyncrasies do not necessarily make the SREM irrelevant in other contexts. Under proposed ESSA plans, many states will still rely heavily if not entirely on cut scores on achievement and English language proficiency test scores when making reclassification determinations (Council of Chief State School Officers, 2016; Pompa & Villegas, 2017). Further, the lawsuits filed against Arizona did not challenge the general approach to reclassification; rather, they contended that the cut scores used were not rigorous enough to make the transition from EL status effective for students (Jimenez-Silva et al., 2014). Thus, while states may differ from Arizona on the number and rigor of the criteria used to reclassify students, the general processes governing and, core inputs to, reclassification are generally quite consistent across states, as well as pre- and postpassage of ESSA.
From a modeling standpoint, one of the main benefits of the SREM is its flexibility. For districts and states that use additional tests or other measured criteria that are time-varying and potentially endogenous, the SREM can incorporate those information, whereas models used in other studies typically cannot. For example, California also requires that ELs show proficiency in reading achievement. The SREM is flexible enough that a reading growth submodel could be fit to the reading test scores, whereby the reading random effects could also be incorporated into the reclassification submodel. Thus, theoretically, the SREM’s ability to address the endogeneity of time-varying covariates is a potential advantage, not a shortcoming when considering how to apply the model in other contexts.
Ultimately, we cannot be certain how the SREM might perform in terms of classification accuracy in other districts or states, nor how it will perform when using criteria established post-ESSA. To address those questions, more research is needed that employs the SREM in a broader range of contexts. The purpose of the article is not to argue that SREMs will uniformly outperform other models or that it will be applicable in all situations. Rather, the study is meant to demonstrate the potential utility of incorporating developmental processes in models for event outcomes like reclassification that are often the focus of educational accountability systems.
Footnotes
Appendix
Declaration of Conflicting Interests
The author(s) declared no potential conflicts of interest with respect to the research, authorship, and/or publication of this article.
Funding
The author(s) received no financial support for the research, authorship, and/or publication of this article.