




Abstract
The speed–accuracy trade-off (SAT) suggests that time constraints reduce response accuracy. Its relevance in observational settings—where response time (RT) may not be constrained but respondent speed may still vary—is unclear. Using 29 data sets containing data from cognitive tasks, we use a flexible method for identification of the SAT (which we test in extensive simulation studies) to probe whether the SAT holds. We find inconsistent relationships between time and accuracy; marginal increases in time use for an individual do not necessarily predict increases in accuracy. Additionally, the speed–accuracy relationship may depend on the underlying difficulty of the interaction. We also consider the analysis of items and individuals; of particular interest is the observation that respondents who exhibit more within-person variation in response speed are typically of lower ability. We further find that RT is typically a weak predictor of response accuracy. Our findings document a range of empirical phenomena that should inform future modeling of RTs collected in observational settings.
1. Introduction
The basic notion of the speed–accuracy trade-off (SAT) is an intuitively appealing one: An individual’s slow, deliberative decisions should, all else equal, be more accurate than rushed decisions (Wickelgren, 1977; see also Figure 1). Beyond its intuitive appeal, it has been verified using extensive work in experimental settings, wherein a variety of manipulations are used to induce changes in speed (Heitz, 2014). While there is great power in using experimental manipulation of time pressure for the identification of this phenomena, experimental results do not necessarily generalize to nonexperimental settings where additional factors may impact the choice of speed and the resulting level of accuracy. The ubiquity of digital interfaces for all manner of widely varying psychometric instruments has rapidly increased the availability of response time (RT) data in observational settings. This increase in RT data increases the need for models—both conceptual and statistical—for understanding such data and also increases the importance of questions about the generalizability of insights regarding RT derived from experimental settings.
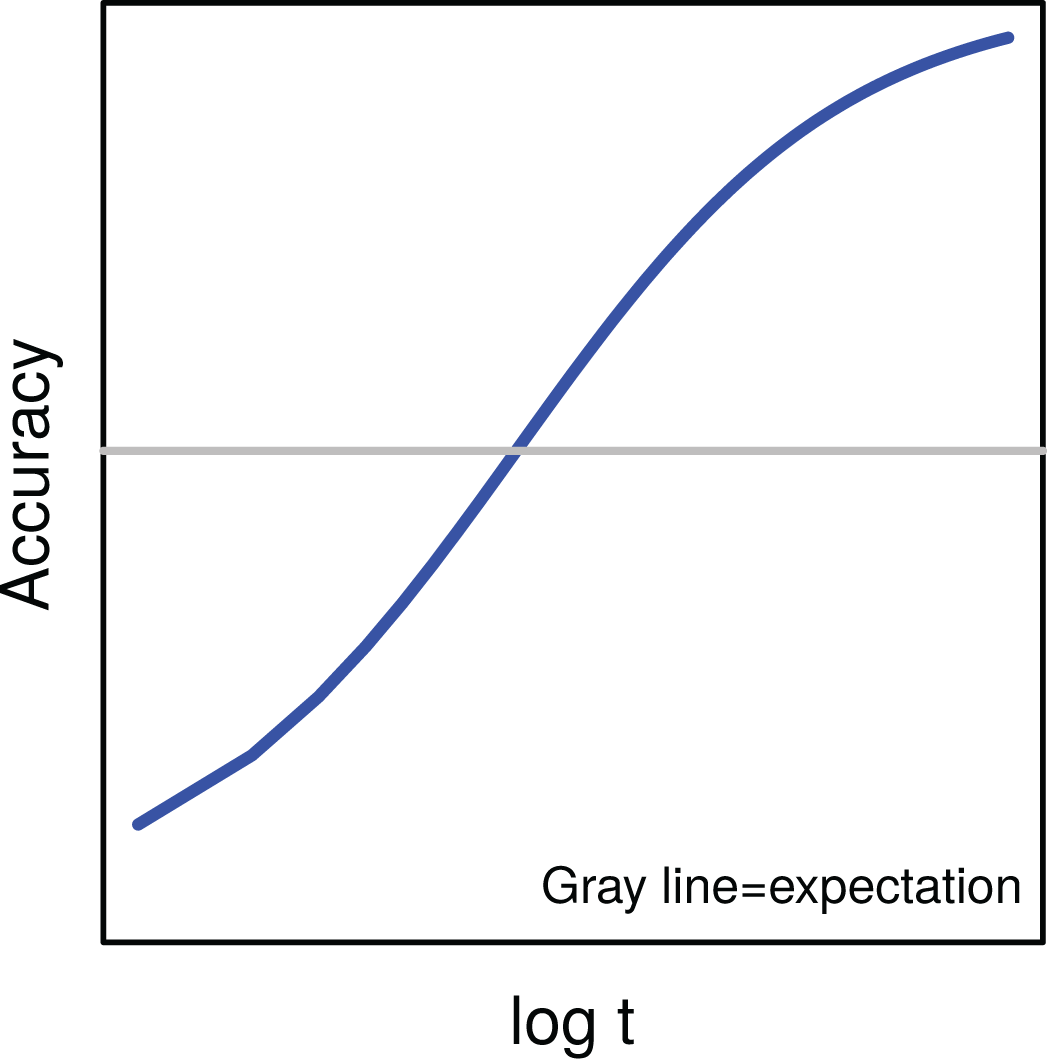
Prototypical speed–accuracy trade-off. For an individual, increases in response time are, all else equal, expected to translate into increase in accuracy relative to expectation (gray line); this is indicated by the upward slope of the blue line. Note that there is no time limit considered in this hypothetical scenario.
In settings wherein time pressures are not explicitly being manipulated, the SAT may still be a relevant model of behavior. Earlier work has described this kind of SAT, based on idiosyncratic within-person changes in speed during the measurement process, as a “micro” SAT (Dennis & Evans, 1996) in contrast with the “macro” SAT, which is typically targeted via direct experimental manipulation. Initial empirical work supported the concept (Lappin & Disch, 1972; Schouten & Bekker, 1967). Such work posits that individuals are continuously making choices about trade-offs between speed and accuracy in the course of responding, thus making it a relevant phenomenon even when speed is not being explicitly manipulated. In nonexperimental work, respondents are potentially making decisions about time usage due to other pressures (i.e., boredom, fatigue, or testing anxiety may play a role in some settings) that may have different implications for accuracy. This study probes the general utility of the SAT in anticipating behavior across a broad variety of cognitive tasks wherein we study the association of speed changes with accuracy.
The increase in RT data is also leading to the development of a suite of statistical approaches for the study of RT, especially in conjunction with response accuracy (Molenaar et al., 2018; Ranger et al., 2015; Ratcliff et al., 2016; van der Linden, 2007). These approaches account, or do not, for the SAT in several ways. For example, the hierarchical model (van der Linden, 2007)—which has been widely used in educational measurement settings—posits no within-person interplay between speed and accuracy by assuming that speed is constant (as it might be in, for example, a high-stakes measurement scenario with no time constraints). An alternative viewpoint posits that RT is a mixture of guessing and solution behavior wherein these two modes have different implications for accuracy (Wang & Xu, 2015). Other approaches (e.g., the drift diffusion model, Ratcliff et al., 2016) explicitly link RT and accuracy based on the models of decision making (such an approach has experimental support, Palmer et al., 2005) and still others (van Rijn & Ali, 2018) upweight rapid responses in terms of how they inform inferences about respondent ability. These approaches all make presumptions about interplay between RT and accuracy that may not be empirically supported in specific contexts.
While it is clear that the SAT is a useful hypothesis for describing behavior in some settings, we argue that it deserves further scrutiny when applied to nonexperimental data across a range of tasks. We aim to study, in a variety of data, whether the general intuition behind the SAT holds. Conceptually, this study builds on work suggesting that additional time spent on a response does not always increase its accuracy (Bolsinova & Molenaar, 2018; Goldhammer et al., 2014; Ranger et al., 2021). For example, Chen et al. (2018) discuss a curvilinear relationship between RT and accuracy: Increases in time spent on an item were associated with increases in accuracy, but only up to a certain point.
In the spirit of earlier work on the SAT (Pew, 1969), we explore this issue using a large number of data sets containing both response accuracy and time from various cognitive tasks. We combine this data with a flexible exploratory approach describing the relationship between within-person variation in time usage and accuracy. We first use an item response model to generate an estimate of the probability of accuracy for a person-item interaction. We then use within-person variation in RT to ask whether extra time spent on an item tends to yield marginal increases in accuracy net of this probability. In such cases, the basic logic of the SAT holds, but, of course, it need not.
Alongside this main question, we ask several additional questions pertaining to interplay between speed and accuracy. We focus on the issues of interest that have seen relatively limited empirical work (especially across diverse data). We ask whether there is heterogeneity in the association between time usage and accuracy as a function of the task or item’s level of difficulty (i.e., the probability of accuracy as specified by an item response model). We ask about the existence of item-level and person-level variation in the degree to which marginal changes in time predict change in accuracy. Finally, given the interest in formal models linking time and accuracy, we use RT to predict accuracy in out-of-sample analyses. Collectively, answers to these questions offer insight as to the degree to which the SAT should be embedded in our conceptual and statistical models for responses not collected in experimental settings.
2. Methods
2.1. Data
We consider item response data sets containing a variety of tasks and with respondents of various ages; they are documented in the Supplemental Information (SI). The primary criteria for inclusion were as follows: (1) Time pressures were not experimentally manipulated across the tasks, 1 (2) the data came from cognitive tasks, and (3) accuracy can be appropriately modeled as a monotonically increasing function of some latent trait. Data that are appropriately modeled using item response theory (IRT) models with monotonic item response functions would thus be permissible. In contrast, data from measures of affective traits (e.g., personality) or otherwise characterized by nonmonotonic models—e.g., “D”/“unfolding” models (Molenaar et al., 2015)—would not be included. We focus on data that had responses scored in two categories (e.g., correct or incorrect). 2 Collectively, these data draw from measures that span a range of constructs measured across the lifecourse.
Descriptive statistics, including the size of each data set, are in Table 1. Data range widely in scale; e.g., 30 people or
Descriptive Statistics for the Data Sets (Including Time Limits for Those Data Sets That Impose Them at the Item Level)
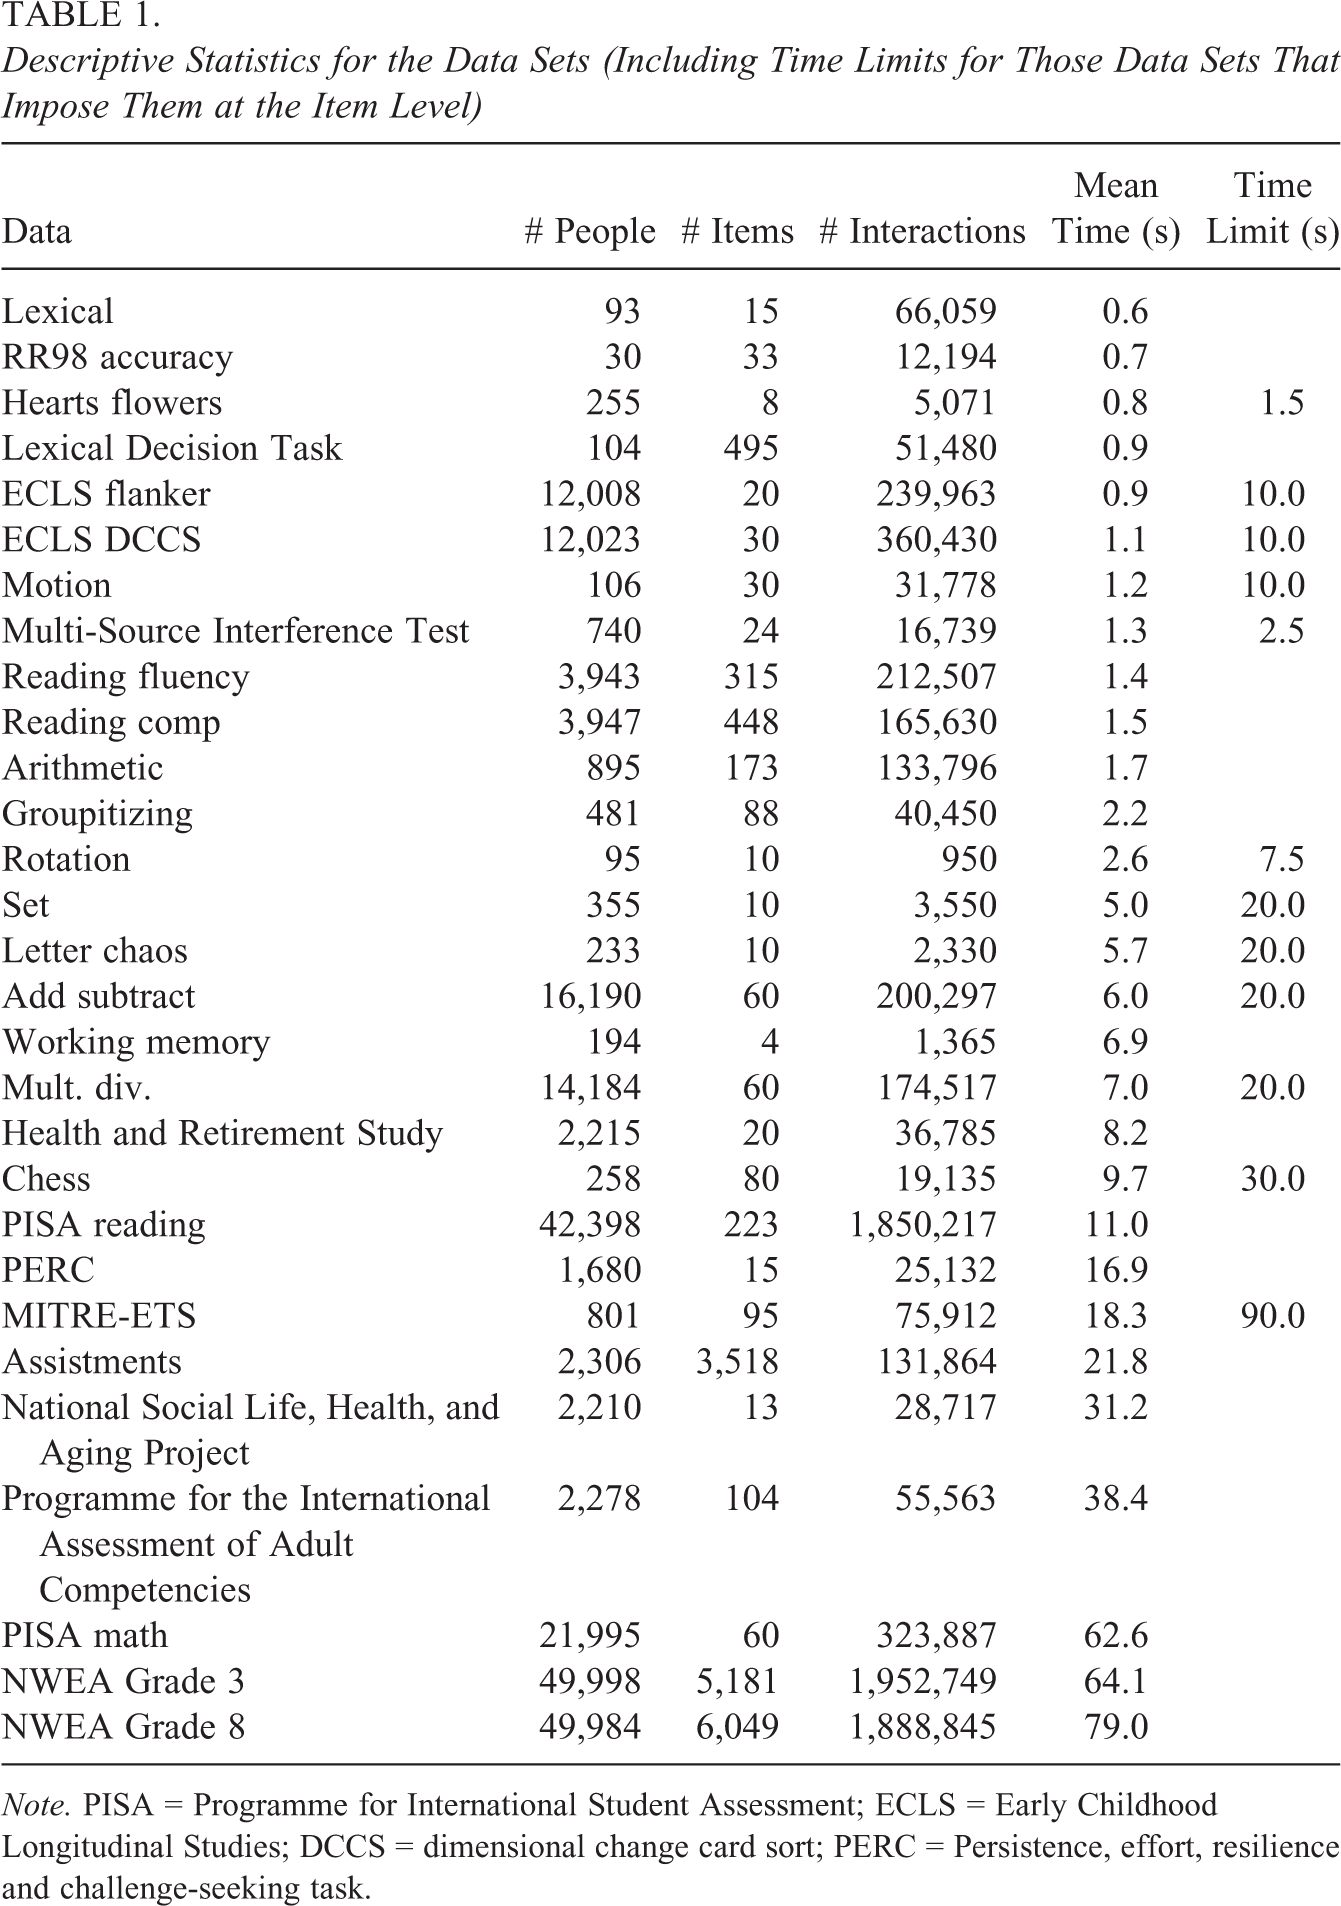
Note. PISA = Programme for International Student Assessment; ECLS = Early Childhood Longitudinal Studies; DCCS = dimensional change card sort; PERC = Persistence, effort, resilience and challenge-seeking task.
Figure 2 describes RT in these data. Given the skew associated with time, we use logged time throughout. Tests vary substantially in terms of the amount of time required per interaction. Some tests have items that require less than 1 second on average, while others have items that require more than 1 minute. We order the data by mean RT in our presentation of results. There is also variation in the difficulty of the items, as proxied by average percentage correct, across the assessments. Some of the tests have items for which only half of the responses are correct while others have items for which responses are nearly always correct. We control for this variation via item response models.

Response time (RT). Note. Left: Boxplots of RT (logged) for each of the data sets. Right: Comparison of mean item-level accuracy (x-axis) and RT (y-axis) across the items. Horizontal lines show 1 second, 10 second, and 1 minute increments.
2.2. Analysis
There are several conceptual rationales for combining information on RT and accuracy (De Boeck & Jeon, 2019). RT can be used as collateral information to improve the prediction of accuracy, RT can be incorporated for the purpose of studying the underlying cognitive processes, or RT can be explicitly incorporated into scoring rules. The approach used here—in particular, combining probabilities from item response models with fixed effects—has features of the first two approaches. 3
We view our approach as one designed to flexibly model the impacts on the accuracy of within-person changes in time use. In particular, we argue that our approach is reasonable for elucidating key facts about the SAT that we study here but we would not consider it a plausible generative model; indeed, the breadth of data here may require qualitatively different types of generative models. In being an approach focused not on testing models that may have generated the data but instead on key empirical relationships, we view it as being in the tradition of Tukey and others advocating for such exploratory approaches (Fife & Rodgers, 2021; Tukey et al., 1977). Our confidence in our approach’s ability to capture key features of the SAT is based on extensive simulation studies in the context of several different models for the joint distribution of time and accuracy, see SI.
All analyses are conducted in R. We use mirt software (Chalmers et al., 2012) to estimate IRT models and the fixest package to estimate fixed effect models (Bergé et al., 2018). Code is available (https://github.com/ben-domingue/rt_meta).
2.2.1. Mapping speed–accuracy curves
Our first aim is to estimate within-person speed–accuracy curves (i.e., conditional accuracy functions, Maris & Van der Maas, 2012). To do this, we rely on a flexible approach to recovering these curves that allows us to identify a variety of different configurations of speed and accuracy. Alongside information about RT, we utilize the estimates of the probability of a correct response via the application of a specific item response model. We combine these estimates of accuracy with RT in a linear probability model-based approach to identify speed-accuracy curves. The flexibility comes at the cost of some slightly unconventional choices (i.e., the linear probability model), but we illustrate its robust performance under a variety of assumptions in simulation studies (see SI).
Let

where
We then use p
0 in our attempt to model associations between marginal within-person changes in time usage and accuracy. Denoting the time required for the production of person j’s response to item i as

where
We again emphasize that we are not asserting that Equation 2 is the true data generating process. It doesn’t, for example, allow for possible variation in item discrimination and is also in the form of a linear probability model. We view such an exploratory approach as appropriate given that it as a flexible yet robust method for uncovering the SAT that arises due to a variety of different mechanisms for jointly generating time and accuracy; its flexibility is key given the range of data we utilize here. This robustness is demonstrated in Section 2 of the SI, wherein we conduct a wide variety of simulation studies demonstrating the efficacy of our approach. It is, for example, able to detect the key features of the SAT even if the item’s p values are far from 0.5 on average, can detect a variety of shapes of the SAT, and functions appropriately when a variety of models are used to generate data. As with many approaches to studying accuracy or time usage, our approach assumes no change in a respondent’s overall ability or speed through the assessment (i.e.,
2.2.2. Heterogeneity in SAT curves
Note that Equation 2 assumes that changes in accuracy are independent of the difficulty of the interaction; a marginal increase in time on an item that is relatively hard for a person is assumed to be as useful as a marginal increase in time on an item that is easy for a person. We now relax this assumption. To explore heterogeneity as a function of p 0, we consider

where
2.2.3. Item- and person-level analyses
To study the associations of marginal increases in time with accuracy for individual items, we consider the following model separately for each item

where j indexes all individuals. The estimate of
To study person-level associations between speed and ability (i.e.,

where
2.2.4. Predictive accuracy
Finally, we ask about the relative gain in the prediction of accuracy that we get from RT. The goal here is to benchmark the potential value of RT as a predictor of accuracy; such findings will supplement those of the SAT-focused analyses in helping to offer insight about interplay between speed and accuracy. We focus on the predictive power of RT for an item response by comparing the accuracy of predictions in a 10% hold-out-sample of item responses using models trained in the remaining 90%.
6
For this exercise, we first standardize RT within each item. Predictive performance is based on a transformation of the likelihood meant to provide intuition about item-level responses; if

we consider
We consider six models for
3. Results
3.1. Mapping the SAT
We first construct baseline speed–accuracy curves using the approach described in Equation 2 (see Figure 3). Each panel in that figure has a similar form; they are also similar to the format of Figure 1. The x-axis captures time spent on the item. 9 The y-axis shows changes to the estimated accuracy net of p 0. The curves show the estimated changes in accuracy as a function of time; recall that the SAT would suggest that such lines be monotonically increasing as longer responses are associated with increases in accuracy.
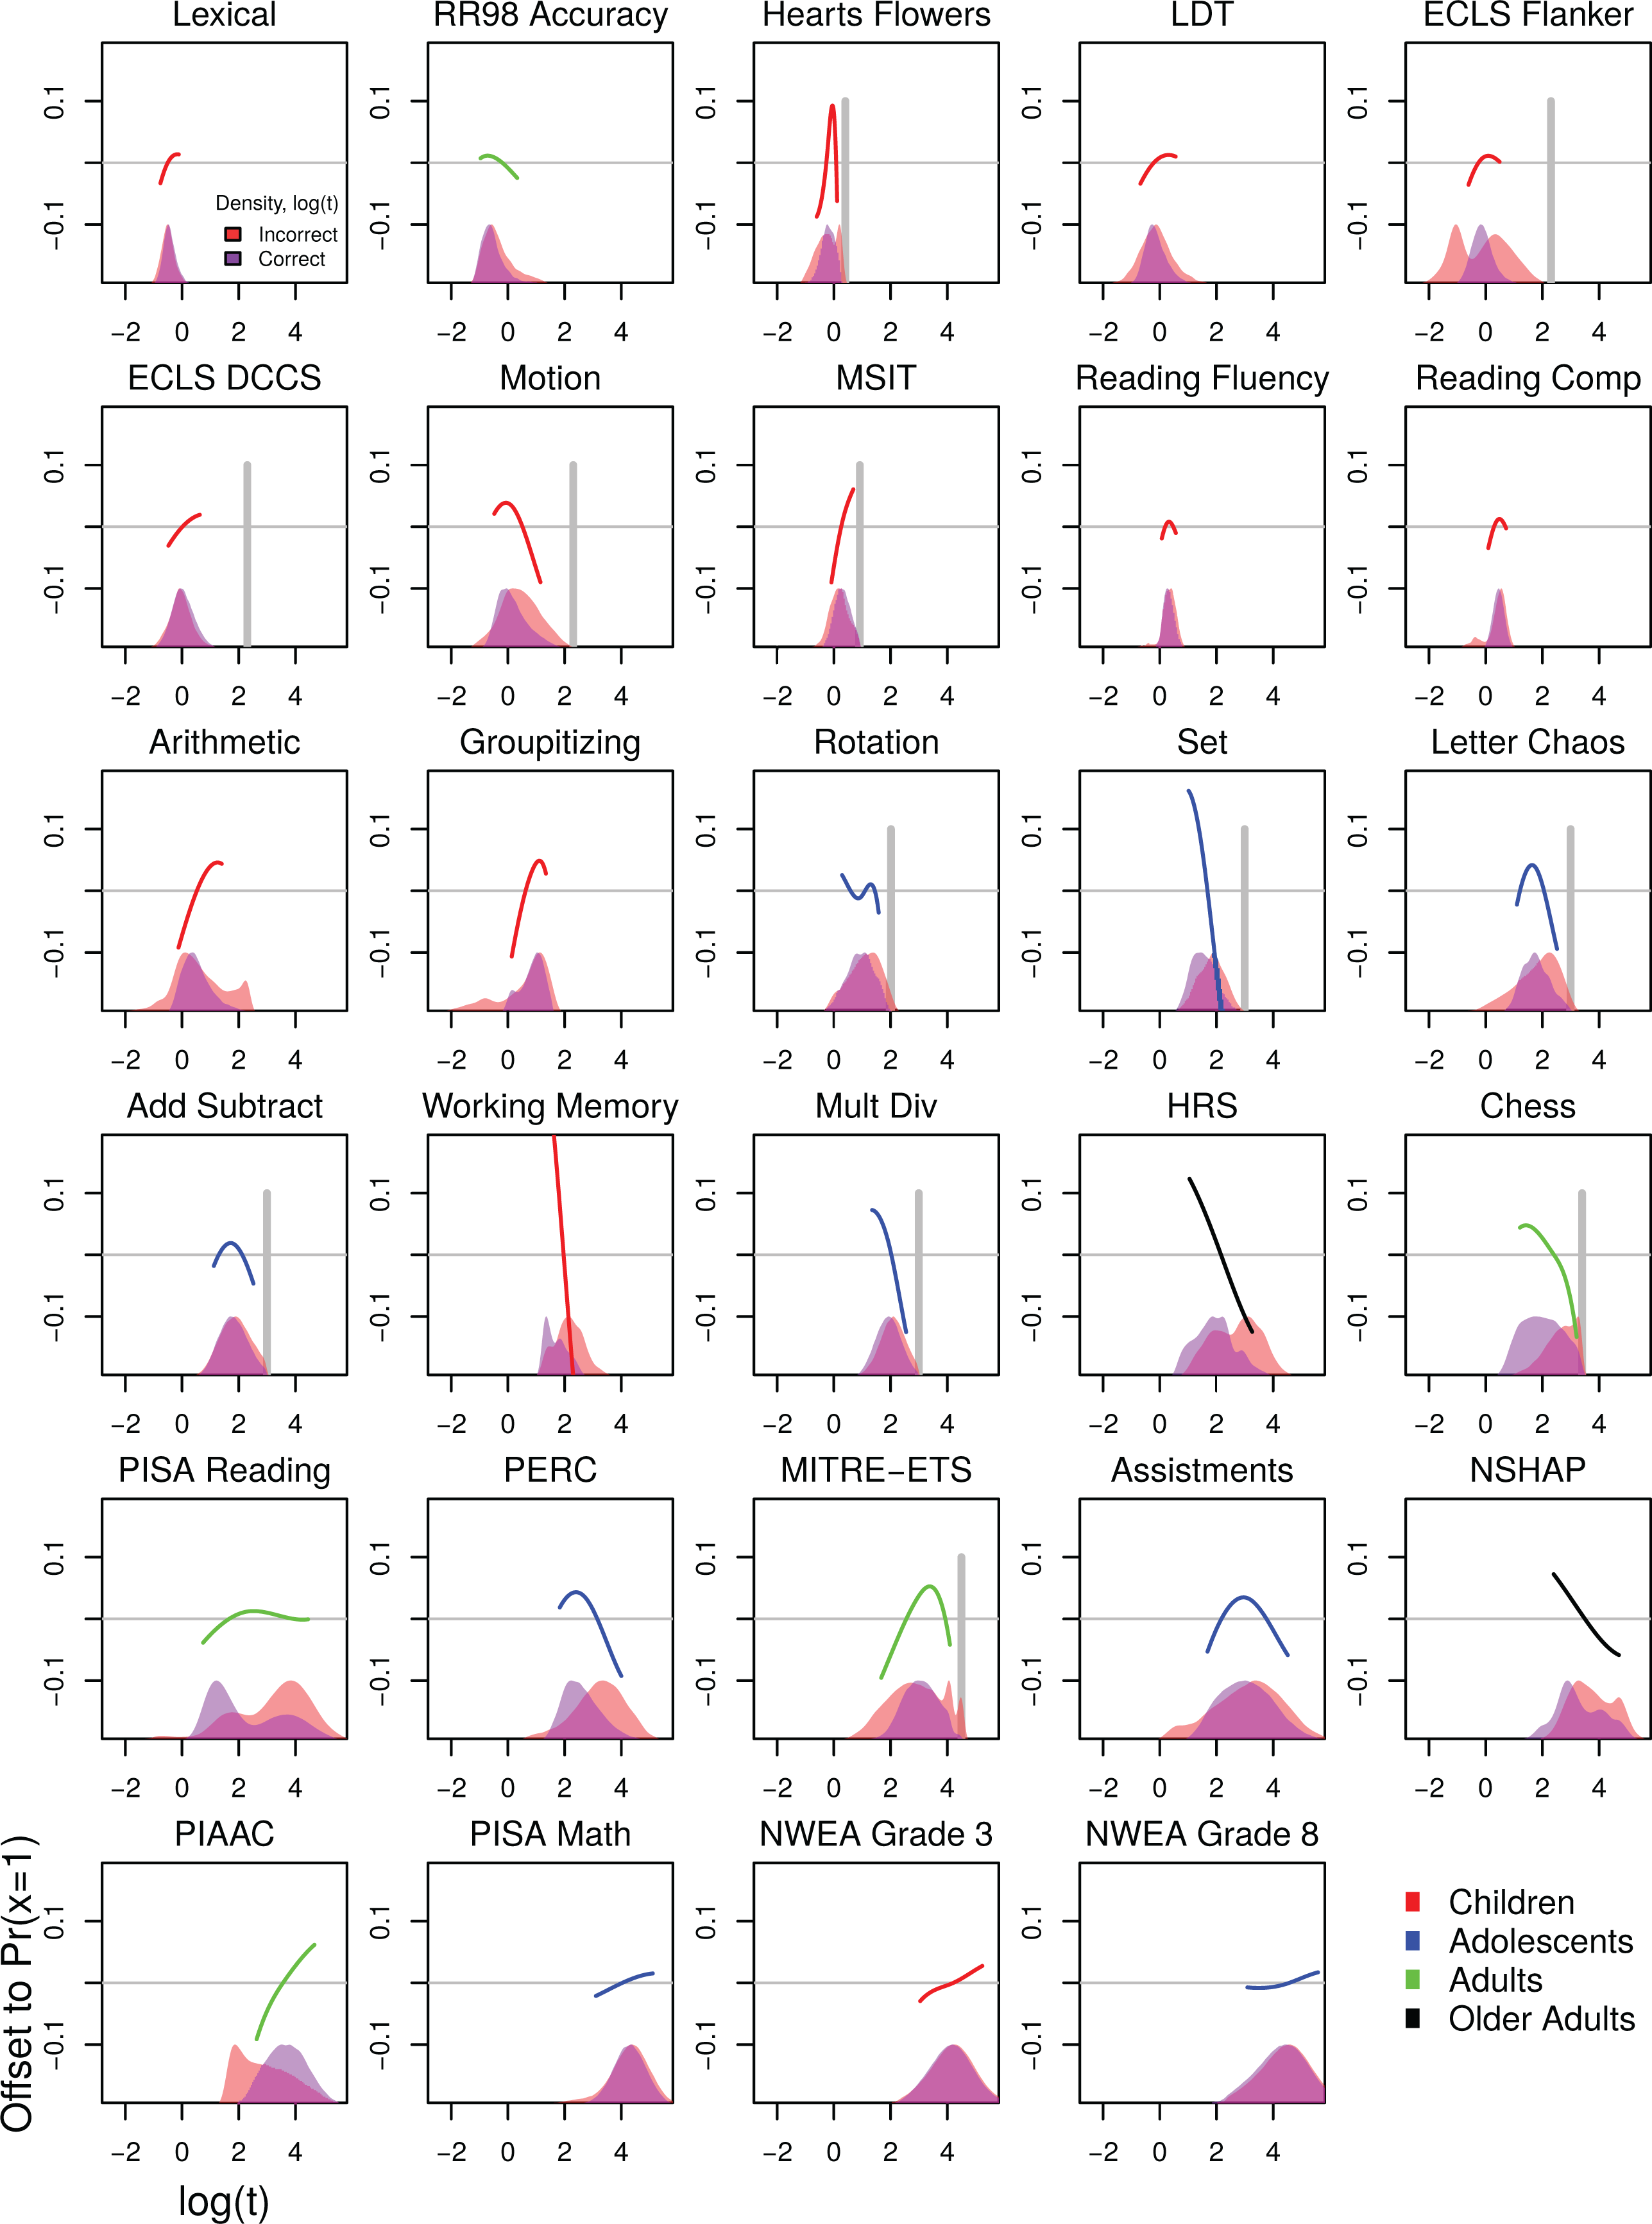
Estimated association between response time (RT) and changes to accuracy (net of p
0). For each test, the x-axis spans from the .1 to .9 quantiles of observed
We readily observe a large variety of behavior in terms of the within-person relationship between RT and accuracy. In some cases (e.g., Lexical, Arithmetic), longer RTs do generally translate into increased accuracy. However, this is not universally true. For example, longer time can be uniformly associated with a decline in accuracy (e.g., working memory, National Social Life, Health, and Aging Project [NSHAP]). In other cases (e.g., rotation, reading fluency), associations with accuracy for additional RT can be positive or negative. While these results suggest that a wide variety of relationships are possible, we emphasize two points of consistency here and further elaborate on some other potential explanatory mechanisms in the discussion.
Note the role of time limits. Consider the hearts flowers and rotation tasks. For those, we observe steep declines in accuracy as a function of time increases when RTs are near their maximum. In these cases, we hypothesize that respondents began to choose answers with less certainty when they neared the time limit for each task. Note that we also detect a relative increase in the density of incorrect responses prior to the time limit for these two data sets. We further illustrate the role of time limits along the lines described here using variation in time pressure in additional data from the hearts flowers task, see SI.
Within age, we generally observe variation in curve shape. However, if we focus on older respondents (the Health and Retirement Study [HRS] and NSHAP data), we observe strong negative slopes. In the context of these data, we hypothesize that the nature of the curve is due in part to both the age of the respondent and the type of task in these data. We further investigated this possibility using the Programme for the International Assessment of Adult Competencies (PIAAC) data, see SI; this analysis supports the supposition that the nature of the HRS and NSHAP tasks play some role (it does not seem to be simply the age of the respondent).
We considered several sensitivity analyses to complement the results in Figure 3. We consider p 0 values generated from an alternative item response model (i.e., the 2PL). We modeled responses using logistic regression rather than the linear probability model. We also considered results based on the first residualized RTs for person and item fixed effects. Results from analyses are described in Section 3 of the SI; our conclusion that a wide variety of relationships between speed and accuracy are possible in observational data is robust to these alternative specifications.
Figure 3 focuses on associations between RT and accuracy net of the underlying difficulty (i.e., p
0) of the interaction. We now ask whether there may be heterogeneous effects by constructing curves similar to the ones shown in Figure 3 but that vary by the difficulty of the interaction. Rather than focusing on the curve, we focus on the curve’s instantaneous slope (i.e.,
3.2. Heterogeneity as a Function of p 0
Conceptually, the analysis of heterogeneity as a function of p
0 is equivalent to asking whether the shape of the curve shown in Figure 1 is sensitive to the value of p
0 (i.e., the location of the horizontal gray line). Results based on the approach in Equation 3 are shown in Figure 4. In this figure (as in Figure 3), the x-axis shows RT for the test. The y-axis shows the p
0 of the interaction; a value of, for example, 0.7 means that an individual responding to a given item is projected by the Rasch model to have a 70% probability of getting the item correct. At a given point in each panel of the figure, the color represents
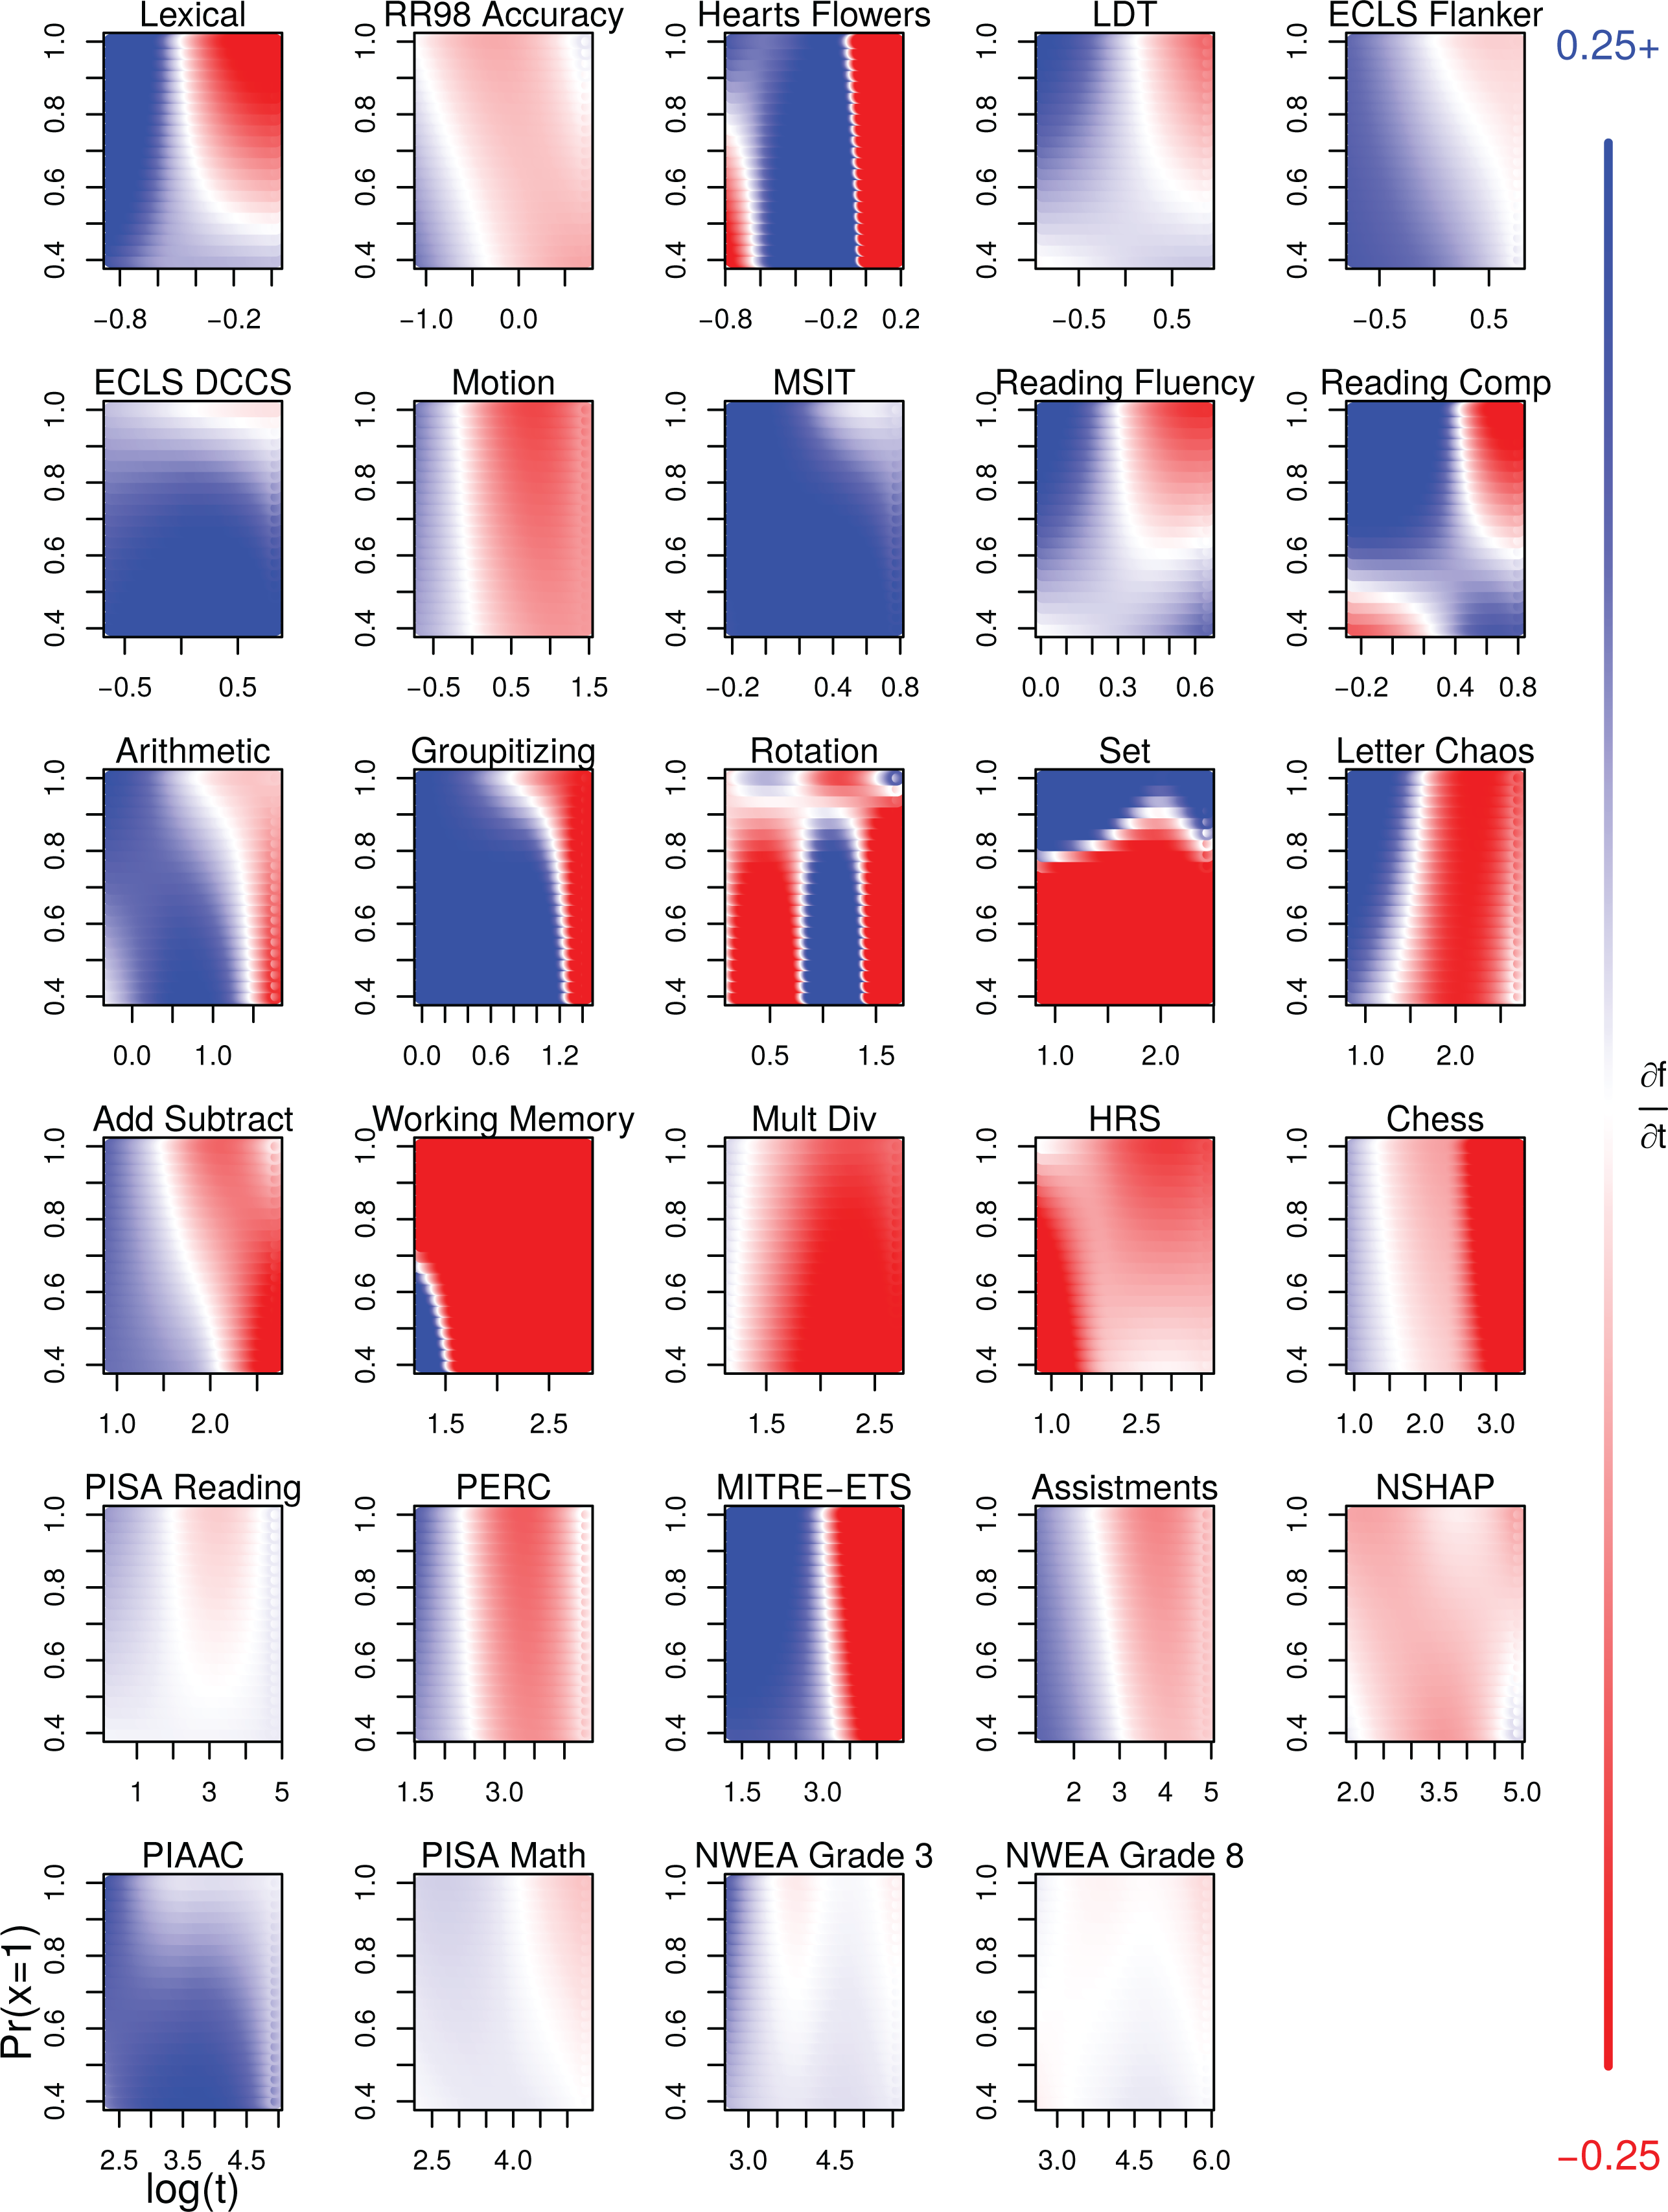
Estimated change in accuracy as a function of both response time (RT; x-axis) and p 0 (y-axis). Colors can be interpreted based on legend on right. Blue indicates points where a marginal increase in time spent by a respondent on an item is expected to increase accuracy; red indicates points where the opposite is true. A lack of color represents a point with no estimated association between marginal increase in RT and accuracy.
We start with the data sets consisting of rapid tasks. Results are fairly heterogeneous. One fairly universal finding (rotation and set being exceptions) is that, across values of p
0, shorter responses are those that are likely to benefit from some increase in accuracy if they are marginally longer (i.e., the left side of each panel tends to be blue); this is perhaps due to marginally longer responses being less due to rapid guessing. The boundary between blue and red also tends to slope from upper left to bottom right such that, for a constant RT, marginal increases are more likely to be in the blue as opposed to the red if they represent more challenging interactions. Consider the Add Subtract data set. If
With less rapid tasks, many of the same patterns appear. In particular, we observe larger blue regions on the left and boundaries between blue and red regions tend to be negatively sloped. However, there are also cases where the partial derivative is uniformly positive (e.g., PIAAC) or negative (e.g., HRS). All told, these analyses suggest that whether the SAT holds may vary both across the nature of the task but also as a function of the precise conditions within the set of tasks in a given data set.
3.3. Item-Level Heterogeneity
Using a modified approach (e.g., Equation 4), we focus on SAT curves for individual items. We focus on the marginal effect of time net of p
0. Results are shown in Table 2 focusing on only those items that have at least 100 responses. Given that each data set contained numerous items, we identified those items showing positive/negative marginal associations with time based on the estimates of
Item-Level Analysis for Those Items With > 100 Responses
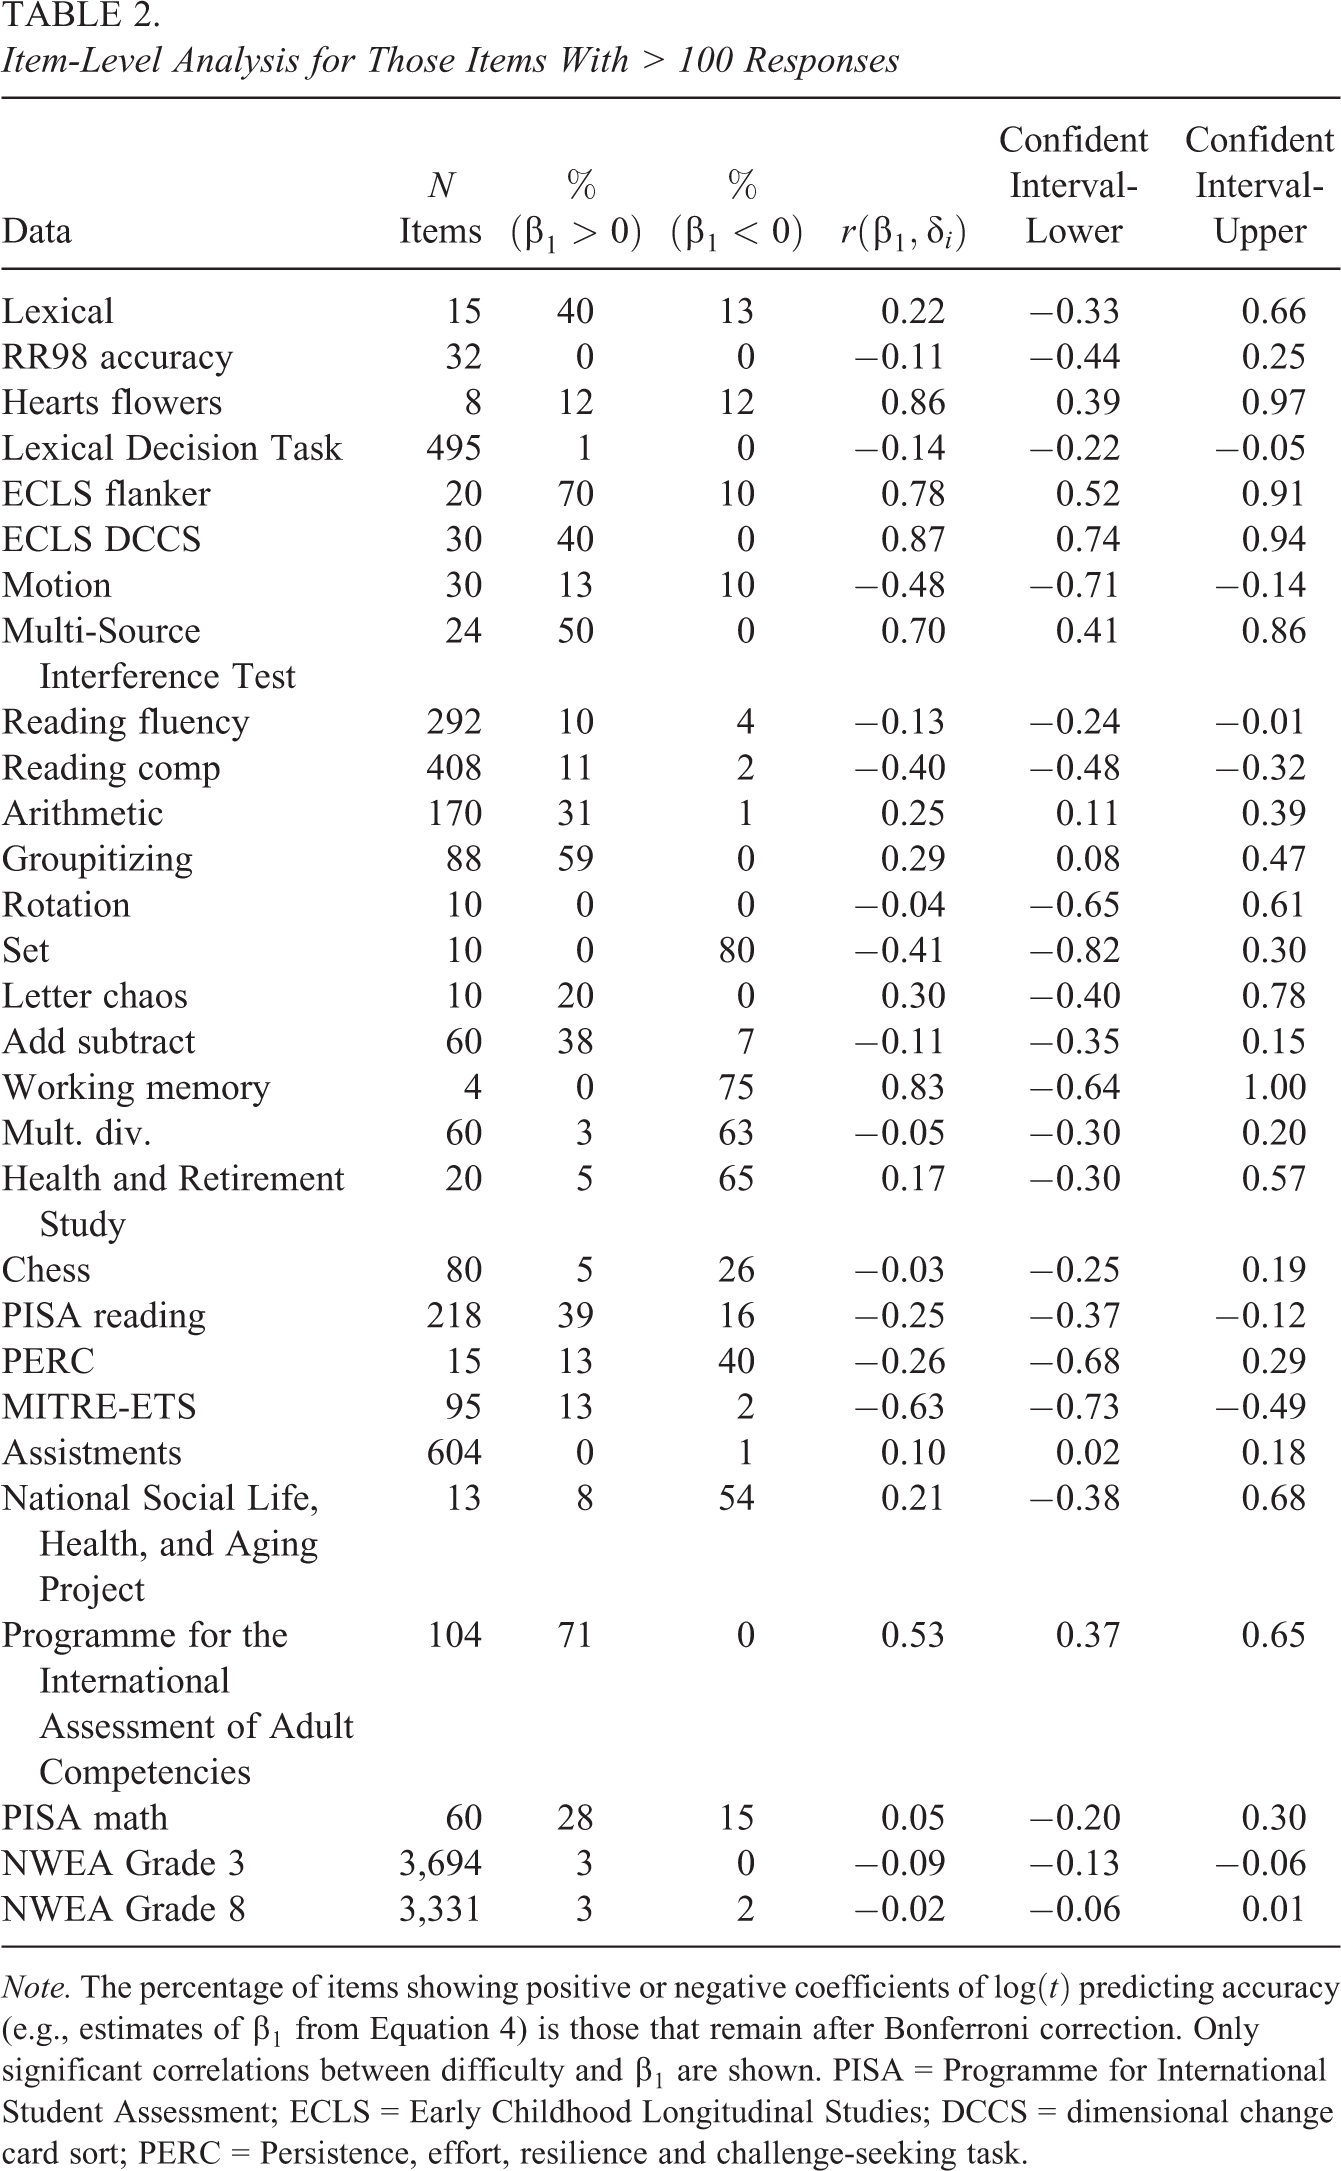
Note. The percentage of items showing positive or negative coefficients of
In general, associations tended to be positive or null. However, note that, for example, the chess data that had a relatively large proportion of items show a negative association and nearly all data had at least some items that showed negative associations; we speculate on the reasons for such negative associations in Section 4. We also investigated correlations between item difficulty and the marginal time/accuracy associations. Such associations varied widely across the data sets.
3.4. Person-Level Heterogeneity
We next analyze person-level speed via Equation 5. Results are shown in Table 3. We first consider correlations between the estimates of ability and speed. Correlations vary widely. In some cases, more able respondents are also faster (e.g., chess); in other cases, the opposite is true (e.g., the PIAAC and PISA).
Person-Level Associations Between Ability (
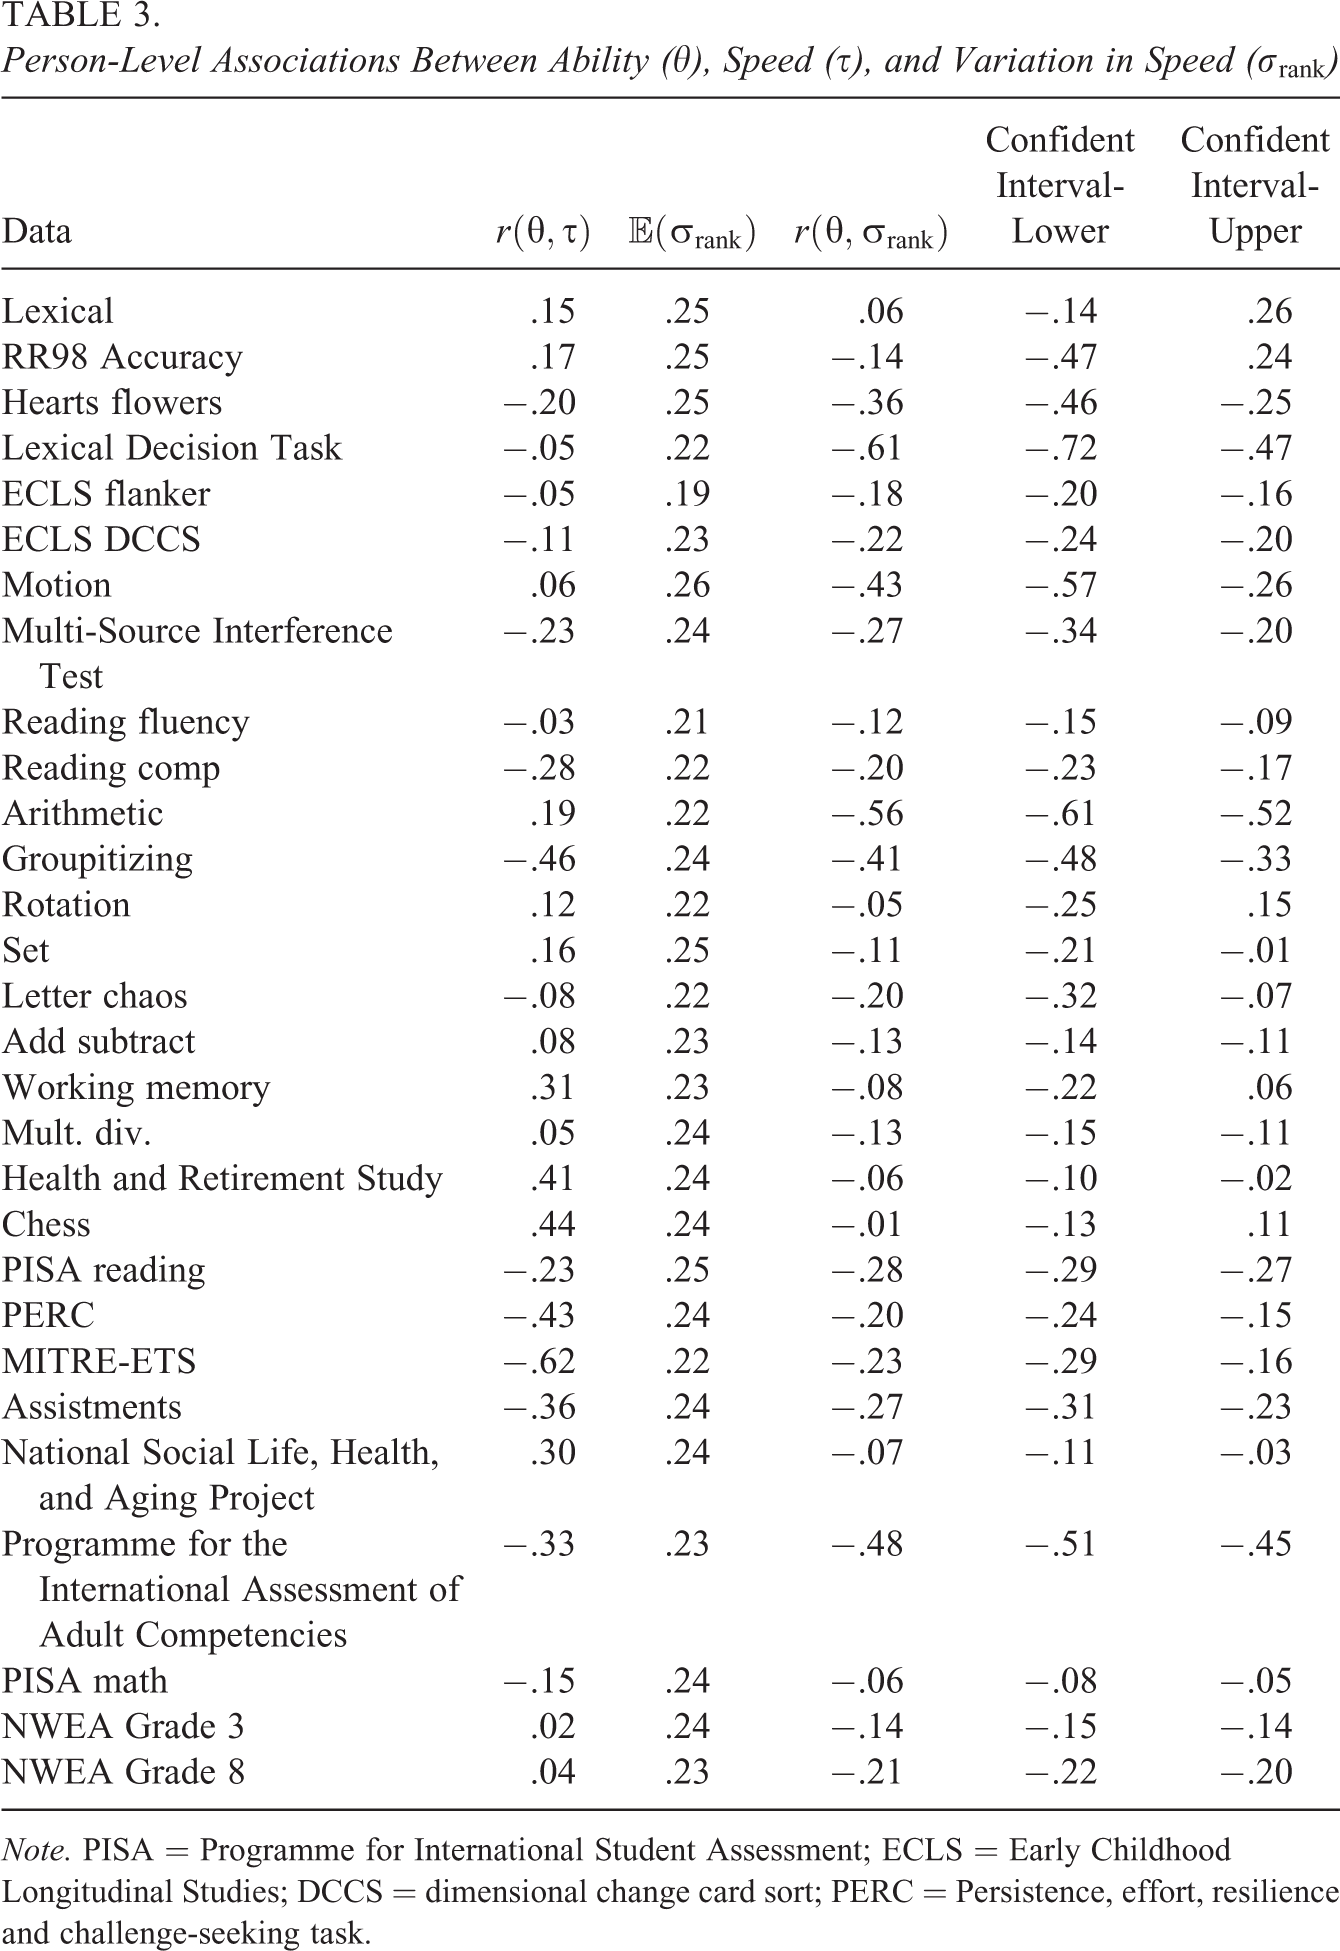
Note. PISA = Programme for International Student Assessment; ECLS = Early Childhood Longitudinal Studies; DCCS = dimensional change card sort; PERC = Persistence, effort, resilience and challenge-seeking task.
We next consider within-person variation in speed during the test. We observed variation in speed—as indexed by changes in a respondent’s rank ordering of RT across items—that was fairly consistent across all the data sets although the Early Childhood Longitudinal Studies (ECLS) flanker tasks showed the least amount of within-person variation. This quantity has an interesting pattern of association with ability. Across nearly all data sets (lexical being the exception), respondents with larger estimates of
3.5. Predictive Power of RT
Finally, we examine the predictive power of RT as compared to alternative predictors. Recall that all predictions of out-of-sample data are based on quantities computed in a training sample; fit is evaluated via

Comparison of out-of-sample predictions (via
With respect to the first comparison (C vs. D), we generally make better predictions based on accuracy rather than RT. There are exceptions (ECLS flanker, set, add subtract, working memory, and mult. div.); we emphasize that, especially for data containing more complex tasks that take longer than 10 second, we are better able to predict novel responses using accuracy rather than RT. With respect to the second comparison (D vs. E), differences were quite small. In only two cases were differences larger than 0.01; in both cases (groupitizing and MITRE-ETS), prediction was superior when using all RT information. With respect to the third comparison (F vs. C/D), we generally find that prediction using both RT and accuracy is generally inferior to models based on just a single predictor (RT or accuracy). Similarly, results from analyses in the SI suggest that using RT from an individual item response tends to degrade prediction as compared to predicting based on p 0 alone. In sum, these analyses—especially when combined with results from SI 3.4—suggest that RT may not be an especially useful predictor of accuracy in many cases. This could be due, in part, to the fact that additional time on an item may predict both positive and negative changes in accuracy (i.e., Figure 3).
4. Discussion
We use the standardized analysis of 29 RT data sets to study the interplay between speed and accuracy in nonexperimental settings. In nonexperimental settings, marginal increases in time do not necessarily lead to increased accuracy. In some cases, we observed patterns consistent with those predicted by the SAT but, in other cases, we do not. Accuracy occasionally declined with increased RT but more frequently showed an inconsistent relationship with increased RTs. In many cases, we observe a curvilinear relationship as anticipated by previous work (Chen et al., 2018). Further, there may be additional heterogeneity within a set of tasks when we stratify by the underlying difficulty (i.e., p 0) of the interaction. We also note that we saw few cases where the within-person independence of speed and accuracy (as indicated by a flat line in Figure 3) required by some models (e.g., van der Linden, 2007) held. While substantial experimental evidence (Heitz, 2014) indicates that artificial manipulation of time pressure has an effect on accuracy, our findings suggest that other factors may be at work in observational data and generally tend to reduce the role of the SAT as a sufficient first-order explanation for observed behavior.
When we observe results inconsistent with the SAT, what might explain such behavior? The tasks we consider are varied and may not allow for a single explanation but several psychological phenomena may be relevant. One possibility is that reductions in accuracy for long responses are associated with a decline in goal-oriented action (i.e., mind wandering; Smallwood and Schooler, 2015), but we note two challenges to articulation of precise theoretical mechanisms. The first is the wide range of tasks considered here. The second is that we have attempted to conduct analysis within item and person. For example, specific item features may induce attentional capture (Simons, 2000), thus leading to decreased accuracy for longer RTs for those items. However, our analysis is not focusing on between-item differences, thus reducing item- or person-specific features as potential explanatory factors.
Focusing on respondents, we observe inconsistent relationships between respondent speed and ability. While faster respondents are not necessarily more able, we do observe a consistent relationship between variation in respondent speed across items and their ability; respondents who receive lower estimates of ability tend to vary their speed more. Such variation in speed could be a phenotype worth further study. Previous work suggests that such variation tends to predict cognitive aging in older samples (Lövdén et al., 2007).
Indeed, one substantively interesting case wherein the SAT does not hold involves older respondents (i.e., the HRS and NSHAP). In these data, additional time predicts a decrease in accuracy. We suspect that this finding has to do with both the nature of cognition in older respondents and the tasks in question. With respect to the age of the respondents, they may be experiencing cognitive aging (Tucker-Drob, 2019), an age-related decline in cognitive functioning. For respondents experiencing cognitive aging, it is possible that a within-person reduction in response speed isn’t associated with deliberation and increased accuracy but, rather, confusion and decreased accuracy. Our findings can be read alongside others suggesting a change in the SAT (Heitz, 2014; Salthouse, 1979) as respondents age.
Turning to items, we identify those for which longer RT predicts increased accuracy—as anticipated by the SAT—as well as others for which the opposite is true. This inconsistency across items is one reason that RT is of limited predictive value. This limited predictive utility is also apparent in Figure 3 as curves showing association between time and accuracy are either relatively flat or otherwise not monotonic in many cases. Generally, RT is typically less useful than accuracy in predicting out-of-sample responses. That said, we would also advocate for extensive interrogation of, for example, the assumption that within-person variation in speed is unassociated with accuracy. Such an assumption is key to some models (van der Linden, 2007); our findings suggest that such a relationship may be complex and context-dependent but are largely inconsistent with the notion that such variation can be entirely ignored in attempts to better understand accuracy.
Our work connects with other recent studies of the SAT. Recent work suggests combining speed and accuracy into a single metric (Hughes et al., 2014; Liesefeld & Janczyk, 2019; Vandierendonck, 2017, 2018). Our findings suggest that there may be between-task heterogeneity that necessitates caution in development of such metrics. Our results also suggest, dovetailing with others, that accuracy is integral for understanding individual differences (i.e., RT alone may be insufficient; Draheim et al., 2019; Draheim et al., 2020). Our approach—emphasizing multiple data sets and nonparametric models—could also be incorporated into further tests of newly developed models (e.g., Kang et al., 2021). Future work could also examine the degree to which our approach could be used as a test of whether models that make restrictions on the SAT are appropriate; for example, identification of a fairly flat curve using the approach of Figure 3 could be a positive sign that the hierarchical model (van der Linden, 2007) could be used.
We also argue that our work documents a range of empirical phenomena that may exist in observational settings. These findings suggest that RT data are rich and may offer wide-ranging information about respondent behavior and the functioning of a measure. Future work should focus on an exploration of such riches. In a given data set, we’d advocate for substantial investigatory work prior to the application of models based on relatively strong assumptions, given that our results suggest many different potential behaviors, several of which may violate necessary assumptions.
We acknowledge limitations. Other features of data collection may be relevant. We have not addressed ordering effects (Debeer & Janssen, 2013; Domingue et al., 2021; Vida et al., 2021). There are presumably motivational differences across the data sets that we do not measure and cannot study. There is evidence to suggest that emotional states—e.g., worry (Hallion et al., 2020)—that may vary as a function of motivational differences and/or testing pressure may affect the SAT.
We also note assumptions required by our analytic approach. The Rasch model that we use is relatively restrictive and unlikely to capture all of the features of the relevant item response functions; this may induce bias in Figure 4 if estimates of p 0 are distorted. We did consider the 2PL in supplemental analyses, but future work could further investigate whether still other item response models may offer different perspectives on these issues. There are also cases where our ability to identify items (e.g., working memory) is relatively weak in the sense that we are classifying a relatively broad class of tasks as a single item. In other cases (e.g., assistments), the assumption of a static ability may be inappropriate. We think that the potential insights from a common analysis applied to a broad variety of data sets offer great value, but findings should be interpreted in light of these limitations.
The heterogeneity of our findings suggests that there are many occasions wherein additional RT is not necessarily associated with an increase in accuracy. We argue that this suggests a need to be vary about the assumption that the SAT is a viable first-order descriptor of behavior in data wherein time pressure is not being explicitly manipulated, especially for challenging cognitive tasks. It may indeed be useful in describing behavior in some settings, but this assumption requires empirical verification. In observational settings, people vary their speed for a variety of reasons that diverge from the reasons that people vary their speed in the context of experimental SAT studies. When one manipulates time pressure with appropriate cognitive tasks, one observes the SAT. However, in broader settings, people are making decisions that affect speed and accuracy for lots of reasons, not all of which lead to results anticipated by the SAT.
Footnotes
Acknowledgments
The authors acknowledge the support of the iLEAD Consortium’s investigators: Melina Uncapher, Adam Gazzaley, Joaquin Anguera, Silvia Bunge, Fumiko Hoeft, Bruce McCandliss, Jyoti Mishra, and Miriam Rosenberg-Lee.
Declaration of Conflicting Interests
The author(s) declared no potential conflicts of interest with respect to the research, authorship, and/or publication of this article.
Funding
The author(s) disclosed receipt of the following financial support for the research and/or authorship of this article: This work was supported in part by the Institute of Education Sciences (R305B140009) and a gift from an anonymous donor. The Health and Retirement Study is sponsored by the National Institute on Aging (grant number NIA U01AG009740) and is conducted by the University of Michigan.

Notes
References
Supplementary Material
Please find the following supplemental material available below.
For Open Access articles published under a Creative Commons License, all supplemental material carries the same license as the article it is associated with.
For non-Open Access articles published, all supplemental material carries a non-exclusive license, and permission requests for re-use of supplemental material or any part of supplemental material shall be sent directly to the copyright owner as specified in the copyright notice associated with the article.
