
Abstract
Meta-analytic models for dependent effect sizes have grown increasingly sophisticated over the last few decades, which has created challenges for a priori power calculations. We introduce power approximations for tests of average effect sizes based upon several common approaches for handling dependent effect sizes. In a Monte Carlo simulation, we show that the new power formulas can accurately approximate the true power of meta-analytic models for dependent effect sizes. Lastly, we investigate the Type I error rate and power for several common models, finding that tests using robust variance estimation provide better Type I error calibration than tests with model-based variance estimation. We consider implications for practice with respect to selecting a working model and an inferential approach.
Meta-analyses in the social and behavioral sciences typically include studies that report on multiple outcomes measured on the same sample. Recent research in meta-analysis (Pustejovsky & Tipton, 2021; van den Noortgate et al., 2013) provides models that better reflect the complex error structure of such effect size data, recognizing the dependence among effect sizes within studies and accounting for the multilevel nature of the data. As these models come into wider use, it is important to understand their performance, given the complex structure of many meta-analysis data sets. One critical aspect of performance is the statistical power of the model to detect a nonnull average effect size.
Power analysis in meta-analysis can provide insight about the potential utility of a planned systematic review. Conducting an a priori power analysis helps researchers determine whether the existing evidence base is large enough to detect an effect size of substantive importance. Similarly, funders often request power analyses as part of grant proposals to establish whether a literature is mature enough to support a proposed research synthesis project. An a priori power analysis can also guide decisions about potential meta-analytic models. Meta-analysts are employing more complex models that reflect the multilevel and correlated nature of effect size data, and these model have greater data requirements than traditional models for independent effect sizes. As illustrated later in this article, the estimates of statistical power to detect a nonnull average effect size may differ depending on both the nature of effect size data and the model used to approximate the distribution of effect sizes.
Available methods for calculating a priori power of the statistical tests used in meta-analysis are limited to models for independent effect sizes, that is, where each study contributes one independent effect size estimate to the meta-analysis (Hedges & Pigott, 2001, 2004; Jackson & Turner, 2017; Valentine et al., 2010). However, the assumption of independent effect sizes tends to hold only for narrowly focused and smaller scale meta-analyses (Ahn et al., 2012; Tipton et al., 2019). As researchers adopt meta-analysis models that reflect the multivariate and multilevel nature of effect size data, information is needed about the power of these newer models, given the distinct assumptions and data structures on which they are based. In this article, we develop new power approximations and examine the power of the test of the mean effect size under different strategies for modeling-dependent effect sizes nested within studies. Below, we review current models for dependent effect sizes nested within studies and then discuss the aims of this research.
Models for Dependent Effect Sizes
Research syntheses in the social and behavioral sciences often include multiple effect sizes from a single primary study, leading to dependent effect sizes. Dependency can occur for a variety of reasons, for example, by studies measuring multiple relevant outcomes (e.g., math and science scores, respectively) on the same sample of individuals or by studies reporting effect sizes across multiple independent samples (e.g., results for primary and secondary school students, respectively). In the past, researchers often handled effect size dependency through ad hoc modifications of the data. For instance, researchers might calculate a synthetic effect size for each study, averaging across different outcomes and/or time points (Tipton et al., 2019) or choose a single effect size from each study for analysis. These strategies then allowed the use of univariate meta-analysis methods.
Multivariate effect size models that reflect effect size dependencies were first introduced by Hedges and Olkin (1985) and further developed by Raudenbush et al. (1988). These methods did not see widespread use in meta-analysis because they required knowing the correlation matrix among effect size estimates—information not usually available from primary studies. A key advance in the modeling of effect size dependencies occurred when Hedges et al. (2010) introduced the use of robust variance estimation (RVE), a technique that allows for the estimation of meta-analysis models even when the exact correlation matrix among effect sizes is unknown. More recent research (Tipton, 2015; Tipton & Pustejovsky, 2015) extended this approach, providing small-sample corrections for standard errors and hypothesis tests.
A key difference between RVE and previous approaches is that inferences under earlier multivariate models were model-based, meaning that they required the distributional assumptions of the model to be correctly specified for hypothesis tests and confidence intervals to work properly. In contrast, RVE makes use of a working model for dependence among the effect sizes, which is an approximation to the dependence structure that need not be entirely correct. Initially, Hedges and colleagues (2010) introduced two working models, called the correlated effects (CE) model and the hierarchical effects (HE) model, to approximate different aspects of dependence. They showed that even when the working model is misspecified, it can still provide reasonably precise estimates of the mean effect size or meta-regression coefficients. Furthermore—and in contrast to model-based methods—RVE methods produce properly calibrated hypothesis tests and confidence intervals, even if the working model is misspecified.
A limitation of the CE and HE working models is that each describes only a single type of dependence, yet in practice, it is common to encounter data with multiple forms of dependence. A recently proposed strategy—coined by Pustejovsky and Tipton (2021) as the correlated–hierarchical effects (CHE) working model—recognizes both the correlated nature of effect size estimates and the multilevel structure of effect sizes nested within studies. Compared to the previously proposed CE and HE working models, the CHE working model provides researchers with the option of more closely approximating the actual structure of meta-analytic data while also guarding against misspecification using RVE techniques.
An alternative strategy, suggested by Van den Noortgate and colleagues (2013), is to use a multilevel meta-analysis (MLMA) model along with conventional, model-based inference methods. Van den Noortgate and colleagues (2013, 2014) demonstrated that model-based inferences from the MLMA work well in the presence of dependent effect sizes, even though some aspects of the model may be misspecified. They argued that the MLMA is therefore robust and, just as with the RVE approach, can be applied without knowledge of the dependence structure of the data. More recently, Moeyaert and colleagues (2017) conducted head-to-head comparisons of RVE (with a CE working model) and MLMA. Their findings indicate that both methods perform similarly when the data include a large number of studies, but that RVE provided more accurate uncertainty assessments when the number of studies was limited. Further, Fernandez-Castilla and colleagues (2020) suggested that MLMA could be treated as a working model and combined with RVE to gain robustness against model misspecification.
Aims
In this article, we investigate the power of current methods for handling dependent effect sizes in meta-analysis. We pursue three aims (1) to develop approximations for the power of hypothesis tests based upon models that reflect the multivariate and multilevel nature of effect size data, (2) to validate these approximations using simulations, and (3) to provide guidance to researchers applying these methods with respect to Type I error and power of different working models and tests. To illustrate the approximations and to provide context for the simulation conditions, we use a recent meta-analysis conducted by Dietrichson et al. (2017, henceforth DBFJ17) that investigated interventions for increasing the academic achievement (i.e., mathematics and reading performance) of students with low socioeconomic status.
We develop new approximations for the power of several different hypothesis tests in meta-analysis of dependent effect sizes. For developing prospective power calculations, it is necessary to posit a true data-generating process. We take as a starting point the CHE model because it nests many other simpler specifications of interest. Under the CHE, we provide power approximations for (1) a model-based test based on a correctly specified working model (CHE-model), (2) a robust test based on a correctly specified model (CHE-RVE), (3) a robust test based on a simpler CE (CE-RVE) working model, which may not be correctly specified, (4) a model-based test based on a potentially misspecified MLMA model (MLMA-model), and (5) a robust test that uses the MLMA as a working model (MLMA-RVE). We then provide examples of how to use these approximations to determine power for testing an overall average effect. Next, we test and validate the performance of the new power approximations via Monte Carlo simulation by comparing the true simulated and approximated power across various model conditions. Before describing the new power approximations, we review extant methods for statistical power in univariate meta-analysis.
Power Approximation for Univariate Meta-Analysis
Current methods for a priori power calculations are limited to models that include a single, independent effect size estimate from each study. Consider such a meta-analysis, based on data from J studies, where the primary aim is to test the null hypothesis that the overall average effect size

where

where

where
The usual way of approximating a priori power under a univariate model is first to determine the minimum effect size of practical significance and second to estimate the variance of the weighted overall mean effect size based on (a) the average sampling variance of an effect size estimate in a “typical” study, (b) the true between-study variance,
In meta-analyses of standardized mean difference (SMD) effect sizes comparing two groups, the effect size estimate’s sampling variance is closely related to the overall sample size (Valentine et al., 2010). Assuming the groups are of equal size
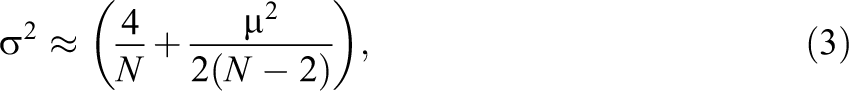
where N is the average effective sample size. Thus, if we know the average effective sample size of studies in a given area, we can approximate the average sampling variance. To arrive at a value for the between-study variance
Suppose we aim to estimate the power of the test for
These power approximations do not apply directly in meta-analyses involving dependent effect sizes. However, one could try applying them by calculating power assuming that there is just one effect size estimate per study—as would be the case if the meta-analyst calculated a single, synthetic effect size per study. Following this approach, we would anticipate power of 0.278 to detect an average effect of
Power Approximations for Meta-Analysis With Dependent Effect Sizes
We now describe approximations for the power of tests for an overall average effect in a meta-analysis of dependent effect sizes. We assume that the data-generating process conforms to the CHE model as described by Pustejovsky and Tipton (2021). Under this data-generating process, we consider several different testing procedures, including both model-based tests and robust tests based on three distinct working models. Unlike the univariate approximations described in the previous section, we allow for sampling variances and other features to differ from study to study, so that we can examine the implications of assuming that study features are homogeneous.
Consider a collection of J studies to be included in a meta-analysis, where each study contributes kj
effect size estimates, for

where
Following the CHE model, we assume that the effect size parameters represent a sample from an underlying population of effects that has a hierarchical structure, according to

where the study-level error term uj
has mean zero and variance
Estimation of CHE
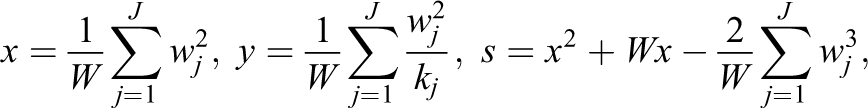
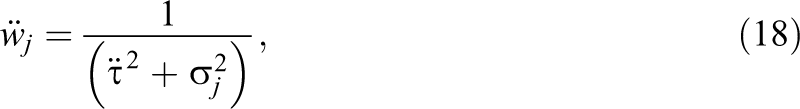
If one treats the CHE model as correctly specified, then estimation of the overall average effect size
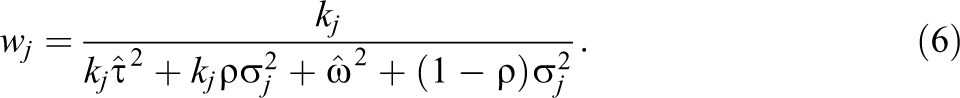
The overall weighted average is then

where

The approximation here arises because W is calculated using estimated variance components rather than known parameter values. Note that the weights given in Equation 6 are inverse-variance and therefore minimize the variance of the weighted average in Equation 7.
Model-Based Hypothesis Test
One way to test the null hypothesis
where

and unit variance. However, such large-sample approximations do not necessarily provide an adequate guide for sample sizes encountered in practice (i.e., fewer than 40 primary studies) because of the uncertainty in the variance component estimates used to calculate
In practice, researchers might use a Student-t distribution with
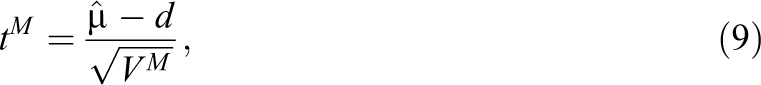
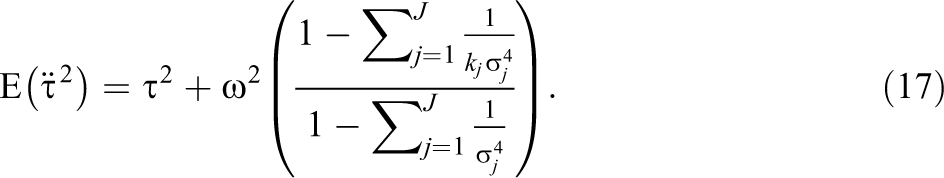
We propose to approximate the power of the model-based Wald test by assuming that tM
follows a noncentral Student-t distribution with noncentrality parameter

Under the CHE model, the Satterthwaite df are given by
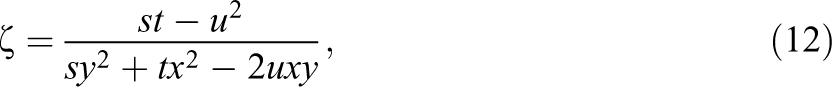
where
(Supplementary Material Section S2.1 provides a derivation). If all studies include the same number of effect sizes (
We note that the Satterthwaite approximation is not commonly applied in practice, nor is it readily available in software. In principle, one could use the power approximation with other df, such as by substituting the critical value
In order to implement this power approximation prospectively, one will need to calculate weights for each of the J included studies. We propose to make such calculations using assumed values for the variance component estimates
Robust Hypothesis Test
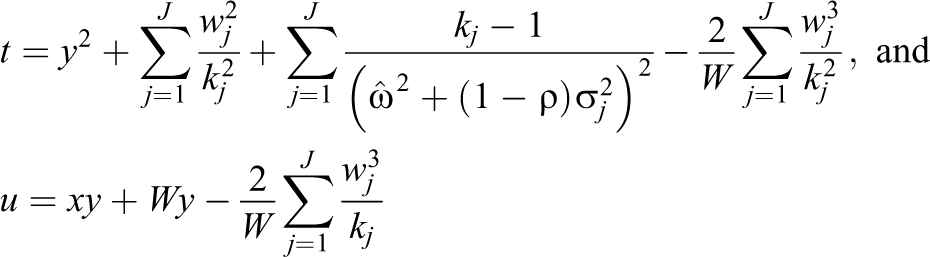
Even when using Satterthwaite df, the model-based test will have close-to-correct Type I error only when the assumptions of the CHE working model hold. Given the typical lack of information about the sampling correlations between effect size estimates, meta-analysts may prefer to use tests based on RVE methods, which maintain close-to-correct size even if the CHE model is misspecified. With the CHE working model, a robust estimator for the variance of
This formula incorporates a small-sample correction (the CR2 correction), as proposed by Tipton (2015). Specifically, the denominator in the summand of Equation 13 is a small-sample adjustment that makes VR
equivalent to the CR2 estimator. VR
is an exactly unbiased estimator of
A robust Wald test statistic based on VR is

Again, consider the scenario in which the CHE model is correctly specified and the number of independent studies is large. If the null hypothesis holds, then tR
follows a standard normal distribution. If the null hypothesis does not hold, then tR
approximately follows a normal distribution with mean
Tipton (2015) proposed approximating the distribution of tR
under the null hypothesis by a Student-t distribution with

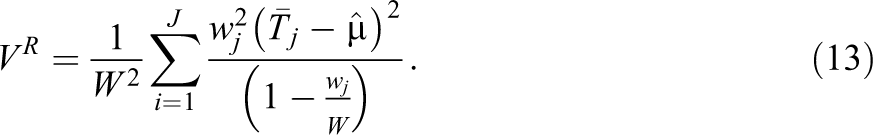
If the working model is correctly specified (and treating the variance components as known), then the df for the robust test are given by
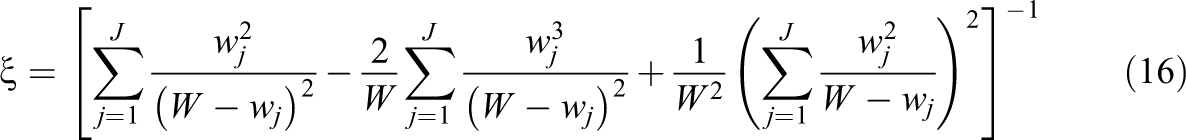
(see Supplementary Material Section S2.2 for a derivation). In a completely balanced sample, the df simplify to
RVE With CE Working Model
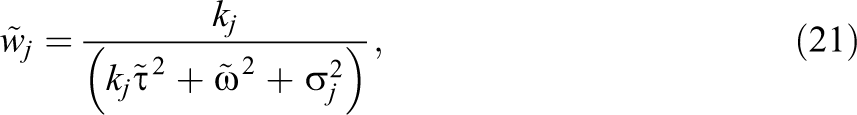
The original implementation of RVE introduced working models that were simplifications of the CHE model, as well as using weights that were not exactly inverse-variance under those simplified working models. The default working model, called the CE model, has only a single, between-study variance component, estimated using a method-of-moments formula. Let
For purposes of power calculations, we will approximate the estimator
The weights used with the CE model are given by
with overall average effect size estimator

which will generally be larger than
This approximation for the power of the robust test with the CE working model entails two simplifications. First, the robust variance estimator itself is not exactly unbiased because the working model is not correctly specified (although the estimator is still asymptotically consistent as the number of studies increases). Second, the Satterthwaite df approximation are derived under the assumption that the working model is correctly specified, which is not the case here. As a result, the approximation might not provide the correct Type I error rate. Ignoring both of these complications for the time being, we propose to approximate the power of the robust test based on the CE model using the same Student-t approximation as above, but with noncentrality parameter
and df
Multi-Level Meta-Analysis
Van den Noortgate et al. (2013, 2014) proposed handling dependent effect sizes via an MLMA model, which includes both between-study and within-study random effects but ignores the possible correlation of effect size estimates drawn from the same sample. This model is a special case of the CHE, under the assumption that the correlation between sampling errors is
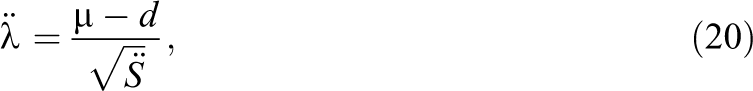
A challenge in analyzing the power of the MLMA model is that the variance component estimates may be systematically biased when the true sampling correlation is nonzero. For purposes of power calculations, we approximate the variance component estimators using the values that minimize the Kullback–Liebler divergence between the MLMA and the true data-generating model (White, 1982). Let
The weights used with the MLMA model are then given by
with overall average effect size estimator

For the MLMA, the model-based variance estimator is
The MLMA model is commonly applied with model-based variance estimation and

where
Fernandez-Castilla et al. (2020) suggested combining MLMA with RVE. We approximate the power of the robust test based on the MLMA model by following the same approach as with the CE model. We denote the Satterthwaite df based on the MLMA working model as
Using the Power Approximations: A Computational Example
To put each of these power approximations into practice, we need to determine the noncentrality parameters and the df of each of the tests. These quantities are a function of (a) the number of included studies, J; (b) the parameters of the data-generating model,
Consider an ongoing review in which the investigators have identified
Hypothetical Studies in a Meta-Analysis
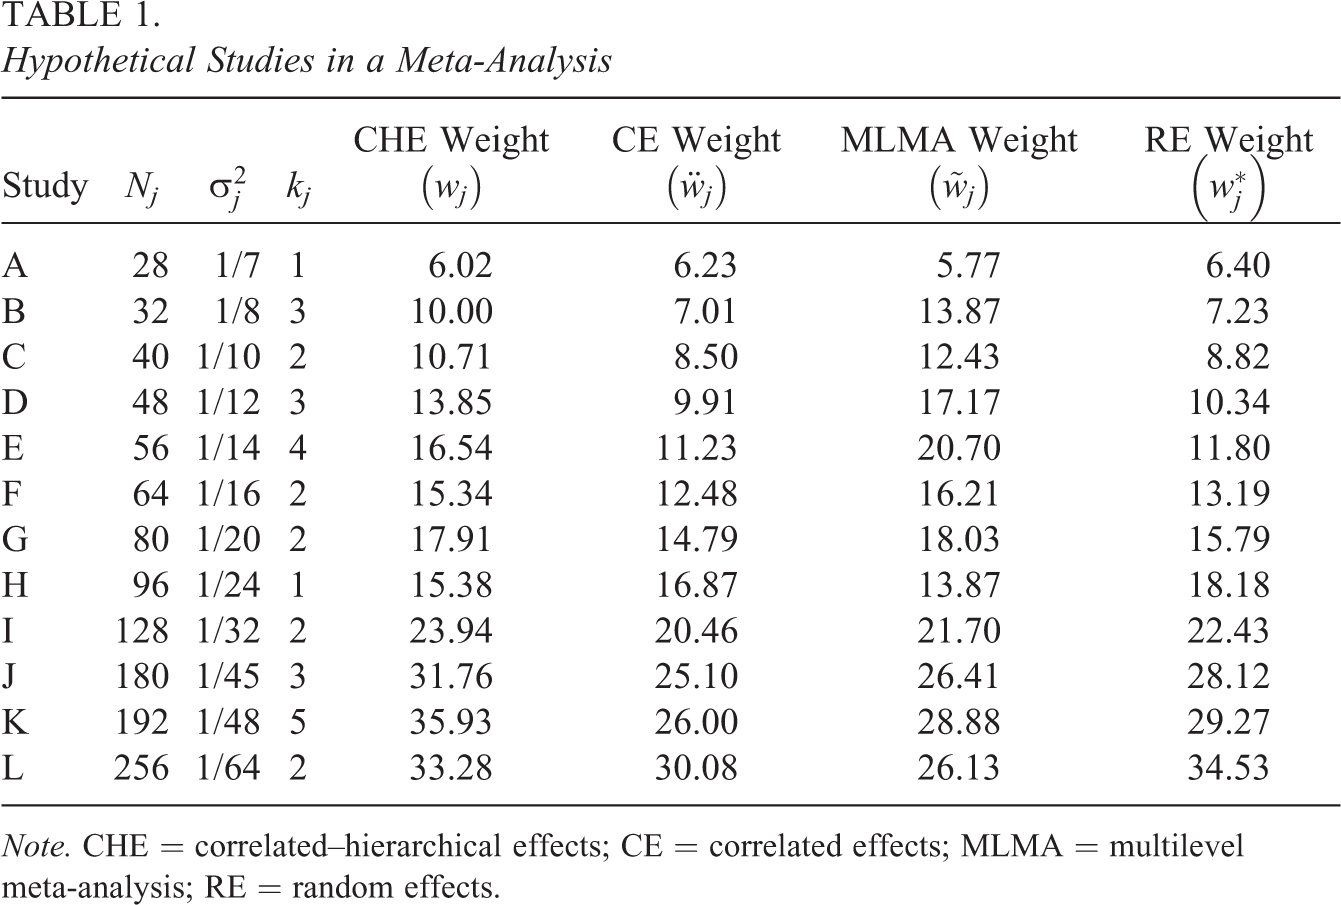
Note. CHE = correlated–hierarchical effects; CE = correlated effects; MLMA = multilevel meta-analysis; RE = random effects.
Given the assumed values of the variance components, we can calculate weights under the CHE, CE, and MLMA models, as well as under the univariate RE model (i.e., ignoring that studies include multiple, dependent effect size estimates). These weights are reported in the last four columns of Table 1. Given the CHE weights, we calculate
Table 2 reports the variance estimates, df, and power based on each of these working models and approximations. In this particular example, the model-based CHE test, the robust CHE test, the robust CE test, the model-based MLMA test, and the robust MLMA test all have quite similar power. Using the effective sample sizes listed in Table 1, the univariate approximation described in the previous section gives power of 25.9%, slightly lower than the power of the more complex approximations.
Power Calculations Based on Hypothetical Study Characteristics

Note. CHE = correlated–hierarchical effects; CE = correlated effects; MLMA = multilevel meta-analysis.
Using the Power Approximations in Practice
Often researchers will need to make prospective power calculations before completing the search and screening process of a systematic review. In this situation, the number of included studies and properties of those studies will not yet be known, and so the researcher will have to make assumptions about the distribution of sampling variances and number of effect sizes per study. Assuming complete balance will generally yield optimistic power calculations. Alternative approaches would be to simulate
We now demonstrate the power calculations as they might be used in practice by developing power estimates based on the characteristics of primary studies included in the DBFJ17 meta-analysis. For purposes of illustration, we used the subsample of 77 studies (including 317 unique effect sizes) comprised of all studies with effective sample sizes of no more than 500 and no more than 20 effect sizes per study. Many of the included studies were cluster-randomized trials, for which sampling variances were computed using cluster-adjustment formulas from Hedges (2007). In the analytic sample of 77 studies, effective sample sizes ranged from 19 to 485, with a median of 87, a mean of 140, and a standard deviation of 125. The average sampling variance was
We calculate power to detect an average effect of
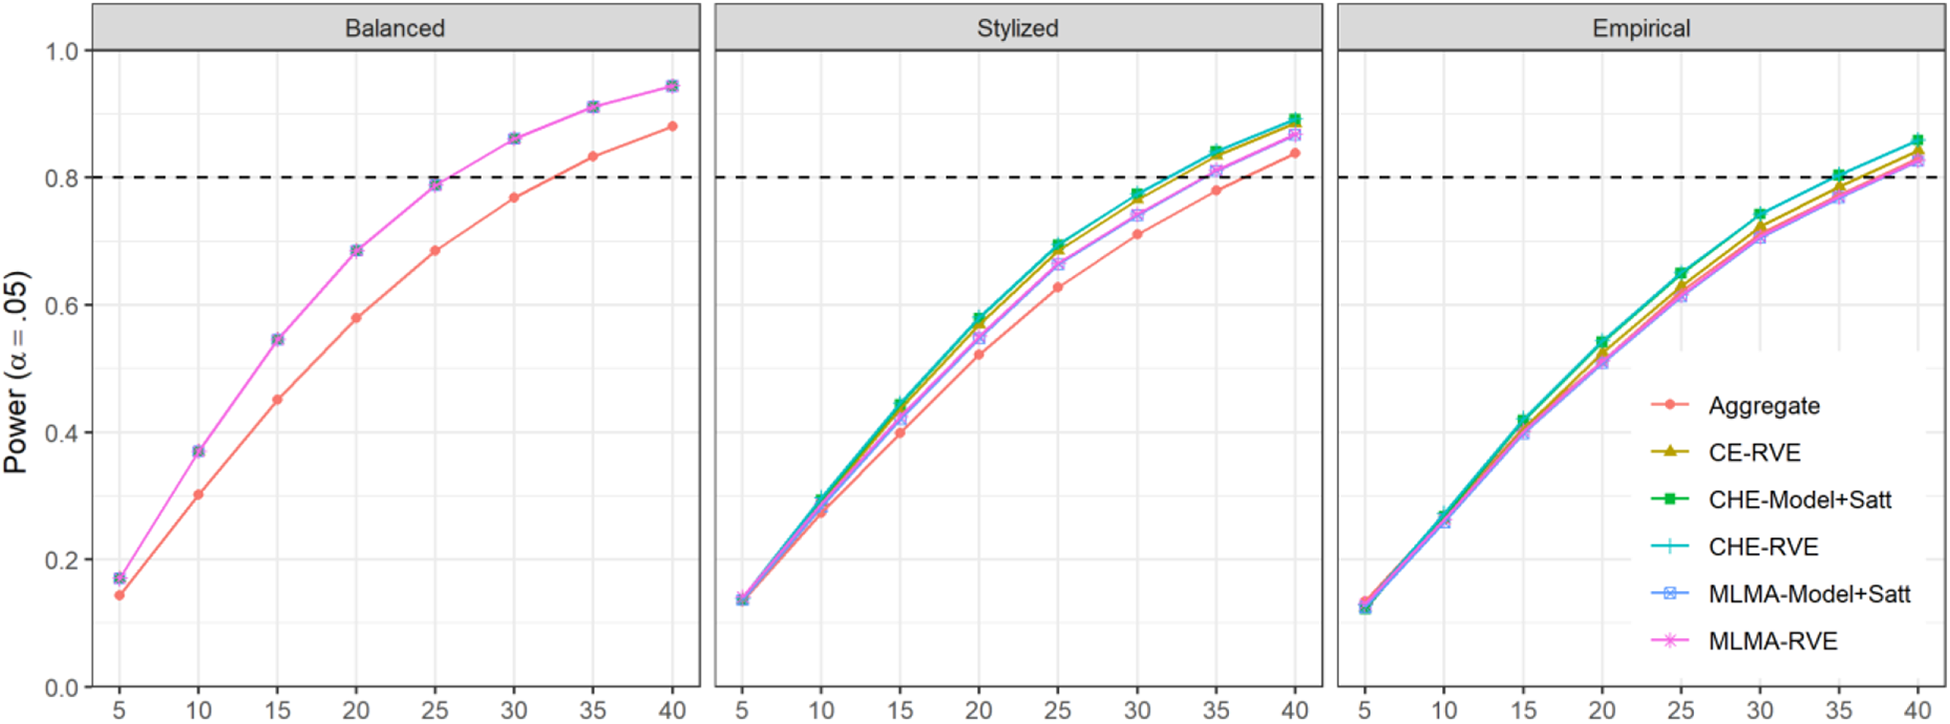
Power for finding
Across all three panels, the power of the aggregate-level approximation is notably lower because it does not account for the availability of multiple effect sizes per study. In each of the panels, the power of the model-based and robust tests under the correctly specified CHE working model are very similar. Because the CE working model uses weights that are not entirely efficient when the study characteristics are not balanced, the CE-RVE test has slightly lower power than the tests based on the CHE, but the difference is only noticeable when kj
and
Comparing across panels, the power levels of each test are substantially higher when based on balanced study characteristics than when based on the stylized distributions or empirical distributions. For instance, with
Simulation Study
We used Monte Carlo simulation to validate the new power approximations and investigate the performance of different working models and inferential approaches for testing overall average effects. We designed the simulations to address three specific aims. First, we examine the accuracy of the proposed power approximations by comparing predicted power levels to simulation-based estimates of power, which fully capture the uncertainties of estimating the working models from limited data. In these analyses, we are interested both in the overall accuracy of the approximations and the extent to which the assumed distribution of
Data Generation Process
The simulations focused on a data-generating process in which the true error structure followed the CHE working model from Equations 4 and 5 because this model nests the simpler CE model and MLMA model. The data generating procedures followed the same process as the simulations reported by Pustejovsky and Tipton (2021), except that we used the DBFJ17 data to inform the distribution of study characteristics. We imposed the same restrictions as in the example described in the previous section, after which the analytic sample was comprised of 77 studies, with an average effective sample size of 140 and an average of 4.1 effect sizes per study.
We simulated SMD effect size estimates because this is one of the most common metrics encountered in meta-analyses in education (Ahn et al., 2012; Tipton et al., 2019). We generated effect size estimates by first simulating study-specific characteristics and effect size parameters. We simulated effective sample sizes Nj
and the number of effect sizes kj
by sampling from the study characteristics of DBFJ17. We then simulated effect size parameters based on Equation 5, given the values of the overall average effect size
Estimators
For each simulated data set, we applied eight different tests that varied in terms of the working model, the variance estimator, and the method for calculating df. Specifically, we calculated all five tests for which we have developed power approximations, including the CHE working model with model-based variance and with RVE, the CE working model with RVE, and the MLMA model with model-based variance and with RVE. For the robust tests, we used the CR2 variance estimator (Equation 13) and Satterthwaite df with each of the working models because this combination of small-sample adjustments has been recommended for use in practice (Tipton, 2015). We also used the Satterthwaite df for the model-based variance estimators. However, because this strategy is novel and not typically applied in practice, we also examined tests based on the CHE working model and the MLMA working model with model-based variance and the more conventional choice of
Experimental Design
We examined the performance of the tests using a full factorial design with 768 unique conditions. Meta-analyses in the social and behavioral sciences include a wide range of studies; a recent review of meta-analyses published in Psychological Bulletin between 1990 and 2017 found that the number of included studies ranged from 12 to 1,753 with a median of 75; about 19% of meta-analyses included 40 or fewer primary studies and 39% included 60 or fewer (Polanin et al. 2020). We therefore varied the number of independent studies from J = 10 to 60 (see Table 3). These represent a small to moderate number of studies compared to sample sizes encountered in meta-analyses in education (Tipton et al., 2019). We used a maximum of 60 studies because power tended to reach ceiling levels beyond this range.
Design Factors for the Simulation Study

As shown in Table 3, we set the true average effect size to values of
Performance Assessment
The main performance criterion of interest was the rejection rate of each test, which we estimated by calculating the proportion of replications in which a test returned a p-value less than a specific
Assumptions About Study Characteristics
For each condition in the design and each hypothesis test, we compared the simulated rejection rates to the approximate power rates under three different sets of assumptions regarding the distribution of study characteristics. First, we estimated power based on the empirical distribution of sampling variances and number of effects per study in the DBFJ17 data. These features varied across studies, leading a degree of imbalance similar to what researchers might encounter in other systematic reviews of educational intervention studies. This approach also matched the actual distribution of study characteristics used in the data-generating process. Second, we estimated power under stylized distributional assumptions, as described in the example presented in the previous section. These assumptions matched the means of the study characteristics in the DBFJ17 data, as well as the variance of the
Replication Materials
R code for replicating the simulations and numerical results from all simulation conditions are available on the Open Science Framework at https://osf.io/yhkq4/.
Results
We describe the results of the simulation study pertaining to each of the three aims. Finding 1a: Power approximations are accurate when based on empirical study characteristics.
Our first aim was to validate the proposed power approximations for meta-analysis models of dependent effect sizes. Figure 2A and B plots the power difference between the approximated and the simulated (true) power on the vertical axis versus the approximate power estimate on the horizontal axis. The figures is faceted by the type of working model and the methods of sampling kj
and
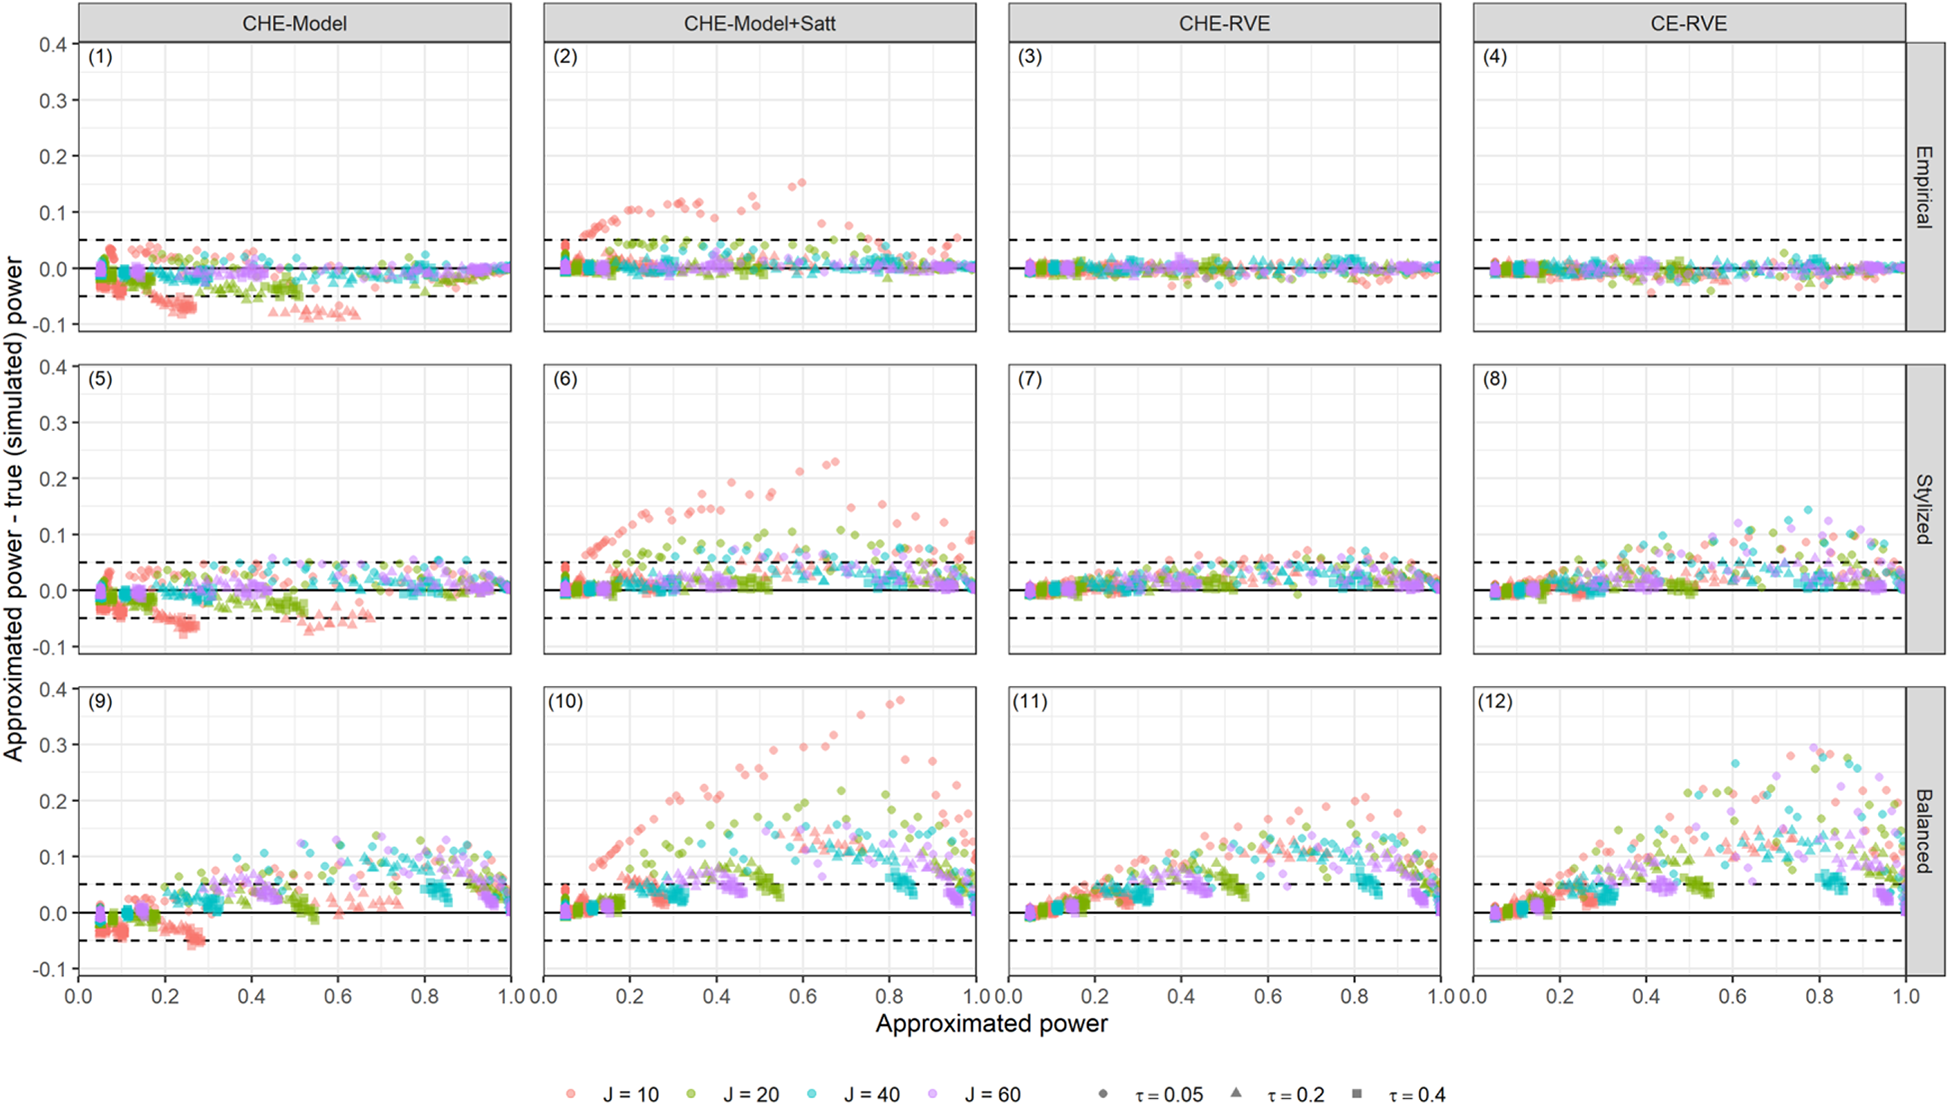
Power difference between approximated and true (simulated) power versus approximated power for the C(H)E working models, across different methods of sampling kj and Nj. Solid lines indicate no discrepancy between approximated and simulated power. Dashed lines indicate five percentage points over- or underestimation of true power.
Finding 1b: Power approximations based on stylized distributions rarely overestimate the true power by more than five percentage points.
As depicted in the second row of Figure 2A and B, power approximations based on stylized distributions of kj
and Nj
only slightly overestimate true power, typically to within five percentage points. For the power approximations for CHE-RVE and MLMA-RVE models, the approximated and true power rarely diverge by more than five percentage points, and discrepancies only occur when Finding 1c: Power approximations assuming completely balanced study characteristics tend to substantially overstate true power.
The bottom rows of Figure 2A and B further indicate that the power approximations generally overstate the true power of all models by 5–20 percentage points when the approximations are based on the assumption of complete balance. This pattern is especially pronounced for the CE-RVE and the CHE and MLMA models with Satterthwaite df. In cases with few studies, these approximations sometimes overestimate true power by more than 30 percentage points (see Plot 10 in Figure 2A and Plot 8 in Figure 2B). These results suggest that power approximations premised upon the assumption of complete balanced study characteristics generally perform poorly across all models. Finding 1d: Simple power approximations do not accurately predict true power levels.
Researchers might also wonder about how the original, simpler power approximations for univariate meta-analysis (Hedges & Pigott, 2001) perform for anticipating power in meta-analyses involving dependent effect sizes. Figure S2 in the Supplementary Material illustrates the performance of the univariate approximation formula to predict the true power both for the RE model estimated using synthetic effect sizes and the more complex models using RVE. From these supplementary investigations, the original power approximation performs inadequately as a means for estimating the true power of all models handling dependency, including the RE model. Across conditions, the univariate approximations often over- or underestimate the true simulated power by 20 percentage points or more. The patterns are most extreme when the original approximations are based on a low amount of heterogeneity and become smaller as a function of Finding 2: Robust variance estimation guards against Type I error with all working models.
Figure 3 and Supplementary Figure S3 display the distribution of simulated Type I error rates for the eight different tests under consideration. Tests using

Power difference between approximated and true (simulated) power versus approximated power for the multilevel meta-analysis working models, across different methods of sampling kj and Nj. Solid lines indicate no discrepancy between approximated and simulated power. Dashed lines indicate five percentage points over- or underestimation of true power.
Tests based on model-based variance estimation and Satterthwaite df (CHE-Model+Satt and MLMA-Model+Satt) appear conservative, sometimes yielding Type I error rates substantially below nominal when the number of studies is
Ideally, a hypothesis testing procedure should not only control the Type I error rate but should also come as close to the nominal level as possible. In this regard, it can be seen that all tests based on RVE with small-sample adjusted standard errors and Satterthwaite df are close to or equal to the nominal rejection rate. Using small sample adjustments is particularly relevant for MLMA models because these methods usually use model-based tests with large-sample approximations, which can be inaccurate when the total number of studies is small. Indeed, results in Figure 3 demonstrate that the conventional MLMA test with Finding 3: Only small power differences between RVE models.
Figure 4 displays the power of the CE-RVE and MLMA-RVE models relative to the power of CHE-RVE, across varying numbers of studies, sizes of the within-study, between-outcome correlations, and average effect sizes; Supplementary Figure S4 depicts the same relationships by the amount of within-study heterogeneity. Points below 1 indicate a loss of power relative to the CHE-RVE model. Under the conditions examined, one would expect that tests based on the CHE will achieve the highest possible power because they use a working model that is consistent with the true data-generating process. In contrast, the CE-RVE tests are based on a misspecified working model and also use weights that are not fully efficient. In light of this, it is interesting that the CE-RVE tests do not lose substantial power relative to CHE-RVE. Under most conditions, the relative power of CE-RVE tests was 80% or higher and often closer to 95%. Similarly, the MLMA model is only correctly specified when

Type I error rate for

Relative power between the simulated power for the CHE-RVE model and the CE-RVE and MLMA-RVE models across the different values of between outcomes within-study correlation, ρ total number of studies, J, and average effect sizes, μ, respectively. Values less than 1 indicate loss of power relative to CHE-RVE. Note. RVE = robust variance estimation; MLMA = multilevel meta-analysis; CHE = correlated–hierarchical effects; CE = correlated effects.
Discussion and Conclusion
Methods for handling dependent effect sizes have grown increasingly complex, which has created challenges for conducting power calculations for meta-analysis of dependent effects. In this study, we developed new approximation formulas for several Wald-type tests based on the CHE, CE, and MLMA models, and we evaluated the performance of the approximations via Monte Carlo simulations assuming a CHE data-generating process. The new approximation formulas can closely match the true model power when the relevant primary study characteristics, including sampling variance,
We acknowledge that it will not always possible for systematic reviewers to have access to reliable or relevant pilot data that can inform their power analysis. Therefore, we also tested the performance of power approximations when these are based either on a stylized distribution of kj
and
From our simulation study, we also investigated Type I error rates and, for the models that adequately controlled the nominal Type I error rate, relative power. The simulation results provide further evidence that meta-analysts should routinely guard against model misspecification by using RVE. Consistent with findings from Fernández-Castilla et al. (2020), we find that combining the MLMA model with RVE adequately controls Type I error. If using model-based inference, meta-analysts should use the more conservative test based on Satterthwaite df, particularly when the total number of studies is small or moderate (i.e., 10–40). Our results support the previous recommendations from Tipton (2015) to routinely use both the CR2 small-sample adjustment and the Satterthwaite df. Compared to model-based variance approaches with
For tests of overall average effect sizes, using RVE has little cost in terms of power. In addition, the power differences between the CE, CHE, and MLMA models are minor when applying RVE. That said, and in line with Pustejovsky and Tipton (2021), we recommend using working models, such as the CHE, that capture the main features of the data structures that meta-analysts are likely to encounter in practice. Predicated upon our results, we generally recommend using the new power approximation for the models using RVE because this approximation seems to perform most reliably across all techniques for obtaining kj
and
Lastly, we find that the original univariate power approximation (Hedges & Pigott, 2001) performs insufficiently for purposes of estimating power of both the univariate model using synthetic effect sizes or the more complex family of models using RVE. Therefore, we recommend no longer using the simpler, univariate formulas to approximate power for models handling dependent effect sizes. Future research is needed to investigate how these univariate power formulas perform when the true data-generation process follows a univariate RE structure.
The work in this article does have some clear limitations. Although we find that the approximations perform well when based on pilot data that approximates the real distribution of study features, it may be that available pilot data are not representative of the target population of studies (for instance, by imposing too much or too little imbalance in the data), which could distort the accuracy of the proposed approximations. Furthermore, our simulation results are limited by the selected data-generating model and parameters. The most prominent limitation here is that we have concentrated on the situation in which the CHE working model is consistent with the true data-generation process—a best-case scenario that implies that the CHE working model will have higher power than the CE or MLMA models. In future work, it might be useful to elaborate upon the power approximations by allowing for some degree of misspecification of the working model, such as by assuming a correlation of
This study is limited in scope in that the simulations focused on the common case of SMDs effect sizes. The power formulas can readily be applied to some other effect size metrics such as Fisher’s z-transformed correlation coefficient, but application to metrics such as log odds ratios or risk ratios requires making further assumptions. Future research needs to develop guidance about how to implement the power calculations under a range of scenarios encountered by working meta-analysts.
In this article, we have only focused on power of tests for the overall average effect size, which clearly limits the application of the proposed methods. For testing the overall average effect size, we found that the choice of working model (CHE or CE or MLMA) leads to only minor differences in power. However, this finding may not generalize to more complex models involving moderator variables. Rather, Pustejovsky and Tipton (2021) found that using CHE can lead to substantially more precise estimates than using CE for meta-regression models with predictor variables that vary within study. Thus, the choice of working model may be more consequential for models that involve potential moderator variables.
Developing power calculations for more intricate models such as meta-regressions with one or multiple predictors requires making assumptions about the distribution of covariates across studies and effect sizes, which may be challenging to specify a priori. However, if reviewers have access to detailed and relevant pilot data, power analysis for meta-regression can be conducted via Monte Carlo simulation. Although not trivial, future research could focus on making power simulation for meta-regression models more accessible to the applied meta-analyst.
We intend the results of this research to increase understanding of the performance of a range of meta-analysis models currently used in practice. The power approximations provided can guide researchers in obtaining a priori power estimates required for grant proposals and can inform choices about working models in a meta-analysis. Consistent with other methodologists’ recommendations regarding retrospective power analysis (Lakens, 2022; Zumbo & Hubley, 1998), we discourage use of these approximations to assess the post hoc power of a meta-analysis based on an observed effect size.
Supplemental Material
Supplemental Material, sj-docx-1-jeb-10.3102_10769986221127379 - Power Approximations for Overall Average Effects in Meta-Analysis With Dependent Effect Sizes
Supplemental Material, sj-docx-1-jeb-10.3102_10769986221127379 for Power Approximations for Overall Average Effects in Meta-Analysis With Dependent Effect Sizes by Mikkel Helding Vembye, James Eric Pustejovsky and Therese Deocampo Pigott in Journal of Educational and Behavioral Statistics
Footnotes
Declaration of Conflicting Interests
The author(s) declared no potential conflicts of interest with respect to the research, authorship, and/or publication of this article.
Funding
The author(s) received no financial support for the research, authorship, and/or publication of this article.
References
Supplementary Material
Please find the following supplemental material available below.
For Open Access articles published under a Creative Commons License, all supplemental material carries the same license as the article it is associated with.
For non-Open Access articles published, all supplemental material carries a non-exclusive license, and permission requests for re-use of supplemental material or any part of supplemental material shall be sent directly to the copyright owner as specified in the copyright notice associated with the article.