
Abstract
The multiple-choice (MC) item format has been widely used in educational assessments across diverse content domains. MC items purportedly allow for collecting richer diagnostic information. The effectiveness and economy of administering MC items may have further contributed to their popularity not just in educational assessment. The MC item format has also been adapted to the cognitive diagnosis (CD) framework. Early approaches simply dichotomized the responses and analyzed them with a CD model for binary responses. Obviously, this strategy cannot exploit the additional diagnostic information provided by MC items. De la Torre’s MC Deterministic Inputs, Noisy “And” Gate (MC-DINA) model was the first for the explicit analysis of items having MC response format. However, as a drawback, the attribute vectors of the distractors are restricted to be nested within the key and each other. The method presented in this article for the CD of DINA items having MC response format does not require such constraints. Another contribution of the proposed method concerns its implementation using a nonparametric classification algorithm, which predestines it for use especially in small-sample settings like classrooms, where CD is most needed for monitoring instruction and student learning. In contrast, default parametric CD estimation routines that rely on EM- or MCMC-based algorithms cannot guarantee stable and reliable estimates—despite their effectiveness and efficiency when samples are large—due to computational feasibility issues caused by insufficient sample sizes. Results of simulation studies and a real-world application are also reported.
Keywords
Despite mixed reviews of its specific merits (Wood, 2003), the multiple-choice (MC) item format has been widely used in educational assessments across diverse content domains. A typical MC item consists of the stem presenting the narrative and context that motivate the particular question the examinee is required to answer and a set of response options, which constitutes the “MC component” of the item. The correct answer, called the “key,” is embedded among several alternatives, the “distractors,” that differ in their degree of “(in)correctness.” Compared with “traditional” items having a dichotomous response format, MC items purportedly allow for collecting potentially richer diagnostic information. In addition, different from essays and other constructed-response tasks that are praised for their richer diagnostic information, MC items require examinees to spend less time on recording their answers and are less susceptible to subjective scoring. More succinctly, the effectiveness and economy in administering MC items may account for their popularity not just in educational assessment.
The MC item format was also adapted to the cognitive diagnosis (CD) framework. CD seeks to provide a detailed evaluation of a student’s mastery of the instructional content in terms of skills learned and skills needing study. Early, less sophisticated approaches to analyzing MC items within the CD framework simply dichotomized the responses in scoring the key as 1, the distractors as 0, and applied one of the CD models available for binary responses. The disadvantage of such a strategy is obvious: The diagnostic potential of the MC response format is not exploited, and the additional information that can be gleaned from the distractors is ignored. The first CD model for analyzing MC items in explicitly considering the distractors was de la Torre’s (2009) MC Deterministic Inputs, Noisy “And” Gate (MC-DINA) model. Other CD models—henceforth, diagnostic classification models (DCMs)—for analyzing MC items were proposed by Ozaki (2015) and DiBello et al. (2015). The focus of de la Torre (2009) and Ozaki (2015) is on exploring how distractors can be used to improve examinee classification, whereas the generalized DCMs for MC option-based scoring (GDCM-MC) by DiBello et al. (2015) seek to develop a system for identifying students’ misconceptions of the specific tasks posed by test items.
The DCMs developed by de la Torre (2009), Ozaki (2015), and DiBello et al. (2015) all rely on EM- or MCMC-based algorithms for the estimation of the model parameters. These approaches are effective and efficient if large samples are available. However, for small-sample settings like classrooms, where these DCMs are presumably needed most, parametric estimation methods in general often encounter computational feasibility issues and cannot guarantee stable and reliable estimates (e.g., Paulsen, 2019). In response to these difficulties, nonparametric methods for the diagnostic classification of examinees have been developed (Chang et al., 2019; Chiu & Chang, 2021; Chiu & Köhn, 2019; Chiu et al., 2018).
In this article, a nonparametric diagnostic classification algorithm for MC items called MC-nonparametric classification (MC-NPC) method is presented that has been developed for the explicit use with small samples. The next section briefly reviews essential CD concepts. Technical details of the MC-NPC algorithm are described in the third section, followed by a report on the results of simulation studies for evaluating the performance of the proposed MC-NPC algorithm including a comparison with de la Torre’s EM-based MC-DINA algorithm (implemented in the
Review: Key Technical Concepts of CD
Assume competence—or ability—in an instructional content area is characterized by a set of skills. The explicit purpose of CD is the assessment of mastery of these skills to provide immediate feedback to students on their strengths and weaknesses in terms of skills learned and skills needing study. CD-based tests consist of items that require a correct response mastery of different skills. From the item responses, students’ skill mastery can be inferred. In CD idiom, skills, specific knowledge, and aptitudes—any (cognitive) competence that is required to perform tasks—are collectively referred to as “attributes.” In formal terms, ability in a given knowledge domain is characterized as a composite of K attributes that an examinee may have mastered or failed, which is documented in a 0–1 profile having K entries denoted as
Like examinees, so are the items of cognitively diagnostic tests characterized by individual profiles that determine which specific attributes are required for a correct response. The item-attribute profiles are K-dimensional binary vectors
The J item attribute profiles of a cognitively diagnostic assessment form the rows of its
The DINA and MC-DINA Models
DINA model
De la Torre’s (2009) MC-DINA model is an extension of the DINA model (Haertel, 1989; Junker & Sijtsma, 2001; Macready & Dayton, 1977). The item response function (IRF) of the DINA model is

where
De la Torre’s MC-DINA model (2009)
Before the advent of de la Torre’s (2009) MC-DINA model, according to common practice, the polytomous responses of MC-items were dichotomized, so that a student who had picked the key received a score of one, whereas the choice of a distractor was scored as zero. Such a recoding scheme neglects the potential value of the diagnostic information from the distractors (e.g., partial knowledge as indicated by mastery of only a subset of the required attributes; students’ misconceptions of the task required by an item; see Haertel & Wiley, 1993; Nitko, 2001; Sadler, 1998). Thus, the motivation for the MC-DINA model (de la Torre, 2009) was to exploit the unused diagnostic information from the distractors to improve the classification of examinees—but how? Recall that each DINA item results in a bipartition of the latent attribute space. In contrast, an MC item partitions the latent attribute space into as many proficiency classes as the number of coded response options plus one, thereby supposedly increasing the accuracy of examinee classification. The review of de la Torre’s (2009) MC-DINA model follows in notation and terminology as closely as possible his original presentation in Applied Psychological Measurement.
The polytomous response to an MC item is denoted by the random variable
The relation between the different response options is governed by the following rules: The key always has the largest number of attributes; the attribute vectors of the coded response options must be nested within the q-vector of the key. As a further constraint, the attribute vectors of coded response options must be hierarchically nested within each other; said differently, they establish what Leighton et al. (2004) called a “linear hierarchy.” Hence, all response options form an ordinal scale with the key at the top, followed by the coded distractors, and the noncoded options last.
The ideal response of examinee i to MC item j is defined as

(the notation
Then, the probability that examinee i having ideal response

As illustration of these concepts, consider the following example presented in de la Torre (2009, p. 166) that concerns a test problem molded after Tatsuoka’s (1990; see also C. Tatsuoka, 2002) famous fraction-substraction items:

The attributes are defined as
In conclusion, as an important detail, one should notice that despite the MC response format, the MC-DINA model is still a conjunctive model—that is, the choice of any response category is assumed to be guided by the match of attributes required for a particular response option and those mastered by an examinee. More to the point, in case of the MC-DINA model, the more attributes an examinee has mastered, the more likely she is to move up the hierarchy of response options as they match her attribute profile. Thus, the MC response format should not be confused with the concept of incremental probability of a correct answer as the result of mastering more items as it underlies general DCMs.
The NPC Method
The algorithm of the NPC method (Chiu & Douglas, 2013) is adapted to form the basis of the MC-NPC method proposed in this article. The key idea underlying the NPC method is to estimate an examinee’s proficiency class, the attribute vector

Depending on the specific data structure variations like the weighted Hamming distance may be more suitable (for further details, consult Chiu & Douglas, 2013). The estimated attribute profile of examinee i is identified by minimizing the distance

Given
The MC-NPC Method
The development of the MC-NPC method was inspired by de la Torre’s (2009) MC-DINA model. Several features, however, distinguish the MC-NPC method and warrant a few remarks before presenting its technical details. First, different from MC-DINA, the q-vectors of the coded distractors do not need to be nested within each other and the q-vector of the key, but with these constraints removed, the linear ordering of the coded response options is lost. Consequently, for the MC-NPC method, the scale level of the response options is changed to nominal, which in turn calls for modifications of the ideal response as originally defined in Equation 1 for the MC-DINA model. Second, de la Torre (2009) does not provide the IRF of the MC-DINA model; however, the IRF underlying the MC-NPC method must be defined; otherwise, a comprehensive evaluation of its merits—theoretical and practical—is not possible.
The MC Setting Modified for the MC-NPC Method
To facilitate the implementation of these conceptual modifications and clarify the notation, in the MC-NPC method, the original MC-DINA response option index,

The second rule concerns the case, where 
Example—Determining the Levels l of the Five Response Options of Item j
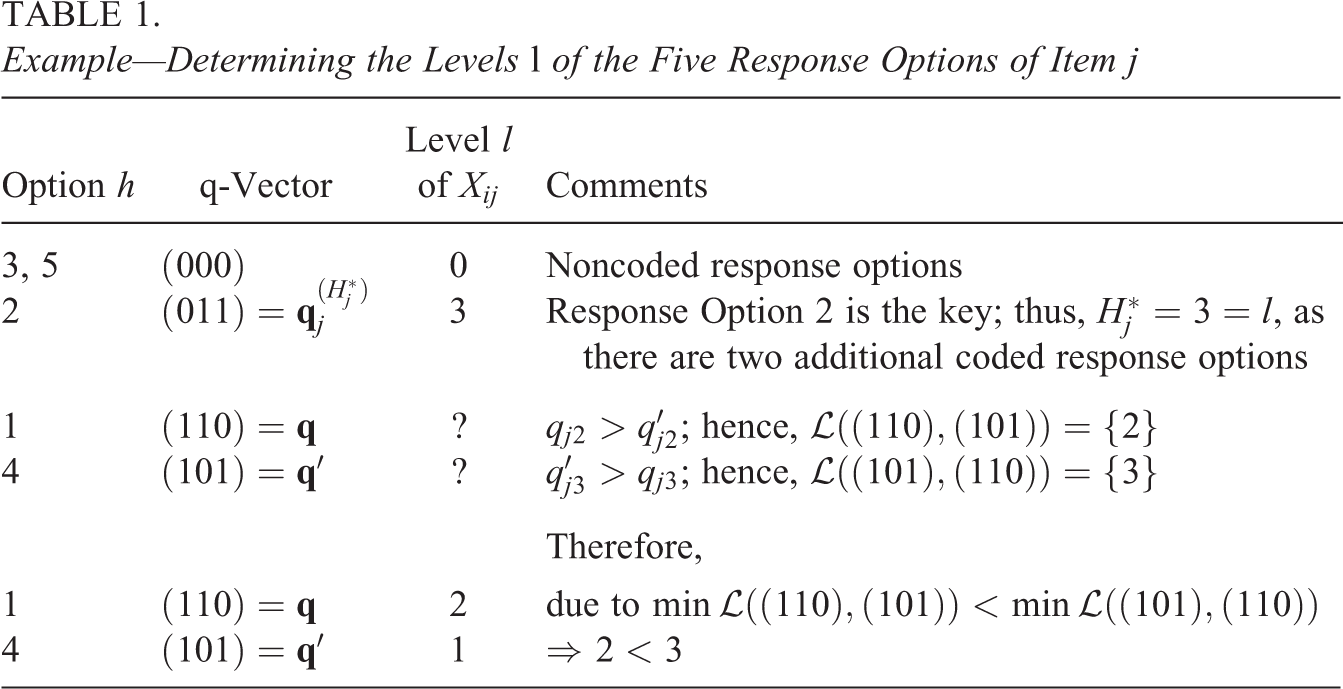
After the indices l of the item response options have been determined, the ideal response

Notice that Equation 3 is equivalent to Equation 1 when all the coded options are nested within each other. Here is an illustration how to use Equation 3. Suppose examinee i has attribute profile

Given the different instances of

Notice that in case of the DINA model, the two perturbations, slipping sj
and guessing gj
, are constrained to be less than 0.5 (otherwise, an individual mastering none of the attributes would have a probability greater than 0.5 to provide the correct answer). Of course, if there are more than two perturbation terms, then the desirable property is that
Example: Item Perturbation Parameters
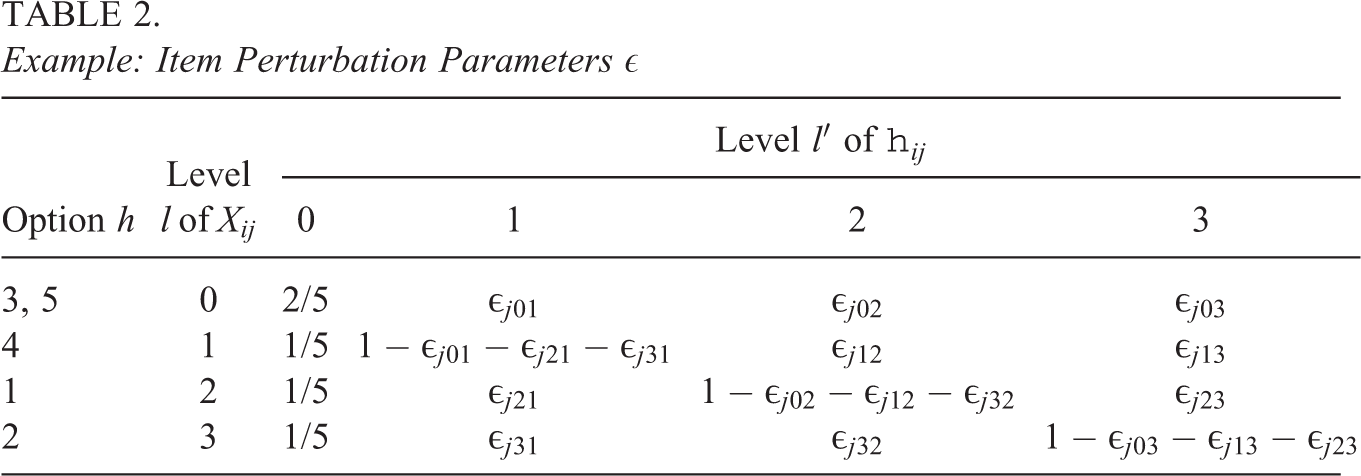
Recall Response Options 3 and 5 are noncoded; hence, their q-vectors receive indices


Inconsistencies of the MC Setting and Their Remedy
Recall that for the MC-DINA model as presented here, the response options
As a remedy to this issue, the distances used by the NPC method are adjusted to reduce the risk of potential misclassifications in case the ideal response

which can be written as

in distinguishing explicitly between

that reduces the impact of those instances possibly pointing at an incorrect
Recall that the potential misclassification by the NPC method is related to the critical incident
Example: Item Perturbation Parameters

Notice that now
Next, consider

After wj
has been identified, the attribute profile of examinee i is estimated by minimizing the distance


Theoretical Legitimization of the MC-NPC Method
The legitimacy of the nonparametric MC-NPC method as a tool for the analysis of MC-DINA data is established in demonstrating that minimizing the distance between the observed and the ideal response in Equation 5 used by the MC-NPC method is equivalent to maximizing the likelihood of the MC-DINA model. Recall the MC-DINA IRF in Equation 4 (repeated here for convenience):

For the MC-DINA model, the likelihood of examinee i is

where

To emphasize the connection between the likelihood in Equation 7 and the distance used by the MC-NPC method defined in Equation 5, four cases are distinguished. (Recall that
Case 1:
For this case, the likelihood


Hence,
Case 2:
For this case, the likelihood

Because

Now, based on Equation 6, the penalty wj
equals

Thus, if
Case 3:
For this case, the likelihood

Because
Case 4:
In this case, the likelihood

Given the assumption that an examinee whose

which is minimized when
Based on the above cases, the likelihood of examinee i can be expressed as

where

Based on Equation 15, when
In conclusion, the above justification supports the legitimacy of using the MC-NPC method to analyze the MC-DINA data.
Simulation Studies
Two simulation studies implementing different experimental conditions were conducted to evaluate the performance of the proposed MC-NPC method. Key research questions were as follows: i Can the purported advantage of the MC over the binary response format in improving the accuracy of examinee classification in CD be confirmed? ii Do parametric estimation methods underperform in comparison with nonparametric methods when sample sizes are small?
The technical details of the two studies and their results are reported in the subsequent sections.
Study I: Replication of de la Torre’s (2009) Simulation
Study I is essentially a replication of de la Torre’s (2009) original simulation study, where he compared the performance of the DINA with that of his new MC-DINA model. In the present study, MC-NPC and NPC were used as additional methods for investigating the performance of the various methods also when sample sizes were small.
Design
De la Torre (2009) used only a sample size of
As a technical detail, one should notice that the version of the MC-DINA model used in de la Torre (2009) was a simpler version of the more general one that was presented in the earlier section “The DINA and MC-DINA Models.” Specifically, in de la Torre’s (2009) version, the perturbations

In reiterating, this simpler version from de la Torre’s (2009) paper was used in Study I.
Like de la Torre (2009), the examinee attribute profiles were drawn from a discrete uniform distribution with equal probabilities. In addition, for this study, examinee attribute profiles were generated based on the multivariate normal threshold model (Chiu et al., 2009), with variances equal to 1 and covariances sampled from Unif(0.3, 0.5). The probability of an examinee in group
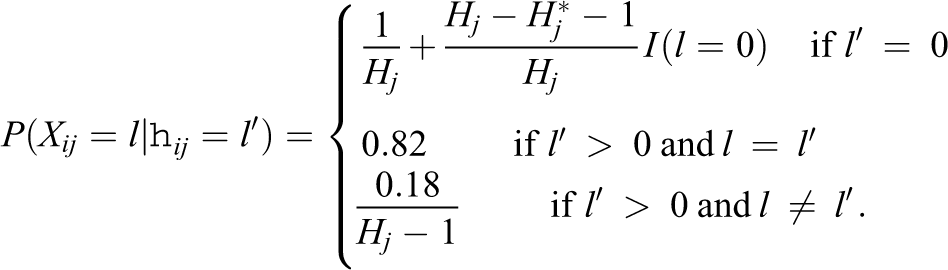
The implication of this particular setting is that examinees who do not master any of the attributes required for a coded response option are not attracted to any response option. Hence, these examinees are assumed to choose a response randomly. In contrast, examinees who master the attributes required by at least one of the coded response options have a probability of 0.82 to pick this particular option; but they may also chose among the remaining options randomly.
The DINA and the MC-DINA model were fitted using the functions
Evaluation criteria
The performance of the methods used in Study I was assessed in terms of the patternwise agreement rate (PAR), which is essentially the percentage of correct examinee classifications defined as

The mean PAR of each set of 100 replications was computed. Notice that the MC-NPC, NPC, and DINA methods did not encounter any convergence issues; thus, the mean PAR is based on all 100 replications. However, for small samples, the MC-DINA algorithm in the
Results
Replication of de la Torre’s (2009) Simulation Study: Mean PAR Obtained for the MC-NPC, MC-DINA, NPC, and DINA Methods

Note. “C” identifies the number of replications with successful convergence. The column MC-NPC* contains the mean PAR of the C replications only. PAR = patternwise agreement rate; MC = multiple-choice; DINA = Deterministic Inputs, Noisy “And” Gate; NPC = nonparametric classification.
Notice that for small samples (i.e.,
Study II: Assessment With Random Q-Matrices
Recall that in Study I, de la Torre’s (2009) Q-matrix was constrained such that the q-vectors of the coded response options formed a linear hierarchy. In contrast, Study II used randomly generated Q-matrices with the nestedness constraint removed.
Design
The experimental factors and evaluation criteria used in Study I were also used in Study II. However, the design of Study II was supplemented by several features that considerably increased the complexity of the data generating process. The number of response options for the MC item, Hj
, was set to 4 or 5. As already mentioned, the Q-matrices were constructed using a random multistep procedure. First, the q-vectors of the keys were randomly generated, so that the Q-matrix formed by the attribute profiles of the keys conformed to the completeness condition for the DINA model (Chiu et al., 2009). Next, for each item key, the number of coded distractors needed was determined in randomly choosing from the set
Table 5 provides an example of a Q-matrix as it was used to generate data with
A Sample Q-Matrix Used in the Simulated Data (

The probability that an examinee in group

The uniform distribution
Results
Table 6 reports the mean PAR from the four methods when each item has four options. Recall that when samples are small, the MC-DINA method may not converge in all 100 replicated data sets. Hence, like in Study I, two mean PAR were computed for the MC-NPC method: The first was computed across the 100 replications and used to evaluate the performance of the MC-NPC method in comparison with NPC and DINA methods. The second mean PAR was computed only across those replications, where MC-DINA converged (marked by “C”) and used to evaluate the performance of the two methods.
Mean PARs From the MC-NPC, MC-DINA, NPC, and DINA Methods When

Note. “C” identifies the number of replications with successful convergence. The column MC-NPC* contains the mean PAR of the C replications only. PAR = patternwise agreement rate; MC = multiple-choice; DINA = Deterministic Inputs, Noisy “And” Gate; NPC = nonparametric classification.
The comparison between the first three columns with 100 replications shows that the MC-NPC method outperforms the NPC and the DINA methods across all conditions, which suggests that careful coding of the distractors substantially improves examinee classification in comparison with dichotomous responses. Observe that the differences in PAR increase when moving from condition
The last two columns of Table 6 report the mean PAR computed for MC-NPC and MC-DINA across the C replications only. The results (labeled as MC-NPC*) confirm that the MC-NPC method is more effective than MC-DINA when samples are small. In reiterating, as observed earlier, the MC-DINA method was plagued by convergence issues that reduced its efficiency considerably. The results further show that the MC-DINA convergence issues were amplified when moving from the
Mean PARs From the MC-NPC, MC-DINA, NPC, and DINA Methods When

Note. “C” identifies the number of replications with successful convergence. The column MC-NPC* contains the mean PAR of the C replications only. PAR = patternwise agreement rate; MC = multiple-choice; DINA = Deterministic Inputs, Noisy “And” Gate; NPC = nonparametric classification.
Real Data Analysis
Data
Responses from 132 fourth graders in Taiwan to 30 MC items on fraction operations were analyzed. Each item had four response options. The items required at most five attributes; their description is provided in Table 8.
The Required Attributes of the Fraction Operations Assessment

The test included 15 single-attribute items; hence, completeness of the Q-matrix was guaranteed. It is presented in Table 9. For each item, a bundle of rows contains the q-vectors of the coded response options. The first row is the key, and the remaining rows are the coded distractors.
Q-matrix of the Fraction Assessment

Figure 1 displays an example item: Response option C is the key requiring Attributes 3 and 5. Options A and D are two coded distractors; the former requires Attribute 3, the latter Attribute 5. The 132 examinees belonged to six classes with 27, 24, 23, 23, 21, and 14 students. From the total of

An item in the fraction assessment.
Evaluating a new method with real-world data presents a challenge in so far as the true proficiency class of examinees, different from synthetic data, is never known. Any evaluation can only be based on relative standards. To develop such a relative standard, examinees’ attribute profiles were estimated twice: first, at the class level using all four methods, MC-NPC, MC-DINA, NPC, and DINA. In a second step, the class-level data were merged into a single sample and reanalyzed with the MC-NPC and the MC-DINA method to assess their performance with a large sample. The large sample estimates—expected to result in more accurate examinee classification—were used as a benchmark for evaluating examinee classification using MC-NPC, MC-DINA, NPC, and DINA with small samples as they are common at the classroom level.
As a technical note, the MC-DINA method implemented in the
Items Removed in Class-Level Analysis

Note. MC = multiple-choice; DINA = Deterministic Inputs, Noisy “And” Gate.
Results
PAR Between the Total Examinees Analyzed by the Polytomous Methods and the Class Analyzed by Each Method

Note. MC = multiple-choice; DINA = Deterministic Inputs, Noisy “And” Gate; NPC = nonparametric classification.
The major findings can be summarized as follows. First, sample size did not seem to affect the performance of the MC-NPC method significantly: It performed consistently well when compared to the nonparametric as well as the parametric methods (recall, e.g., the PAR of the MC-NPC-ALL vs. MC-NPC when used in the six classes: All PAR were either 1 or at least 0.9). Second, in contrast, MC-DINA displayed much greater sensitivity to changes in sample size (see the earlier explanation concerning the sixth row of Table 11). Third, surprisingly, the two methods for binary responses, NPC and DINA, produced higher PAR than the MC-DINA method for almost all of the six classes. Finally, a brief comment concerning the last column of Table 11: It contains the PAR comparing the merged with the stacked classification as they were obtained separately for each of the six classes. Hence, the PAR reported in the last column can be viewed as a weighted mean PAR of the six classes.
Consistency or agreement of classification was also evaluated from a different point of view: Does mastery of individual attributes agree with an examinee’s estimated attribute profile; that is, her proficiency class? Specifically, for each student, attribute subscores were computed and compared with her estimated attribute profile. Attribute subscores of a given attribute are the percentage of items that require said attribute and that an examinee has answered correctly. In light of the conjunctive framework used by all four methods investigated here, extreme attribute subscores, say above 0.8 and below 0.1, are more informative than midrange scores because the latter are typically distorted by the conjunctive framework: An examinee may have mastered a particular item, but failed to master all the attributes required for a specific item and did not answer the item correctly; hence, her mastery of that particular item is not included in the count. High and low attribute subscores are then compared with an examinee’s estimated attribute profile: High and low attribute subscores should correspond to 1 and 0 entries, respectively, in the estimated attribute profile. Discrepancies in either direction—a 1 where there should be a zero or vice versa—indicate an inconsistency between actual test performance and estimated proficiency. The students in Class 5 are used as examples here; their attribute profiles were estimated by the MC-NPC and MC-DINA method. Table 12 presents a few striking examples of grave discrepancies between attribute subscores and estimated proficiency class.
Distinct Estimated Attribute Profiles of Class Five With the MC-NPC Method and the MC-DINA Algorithm
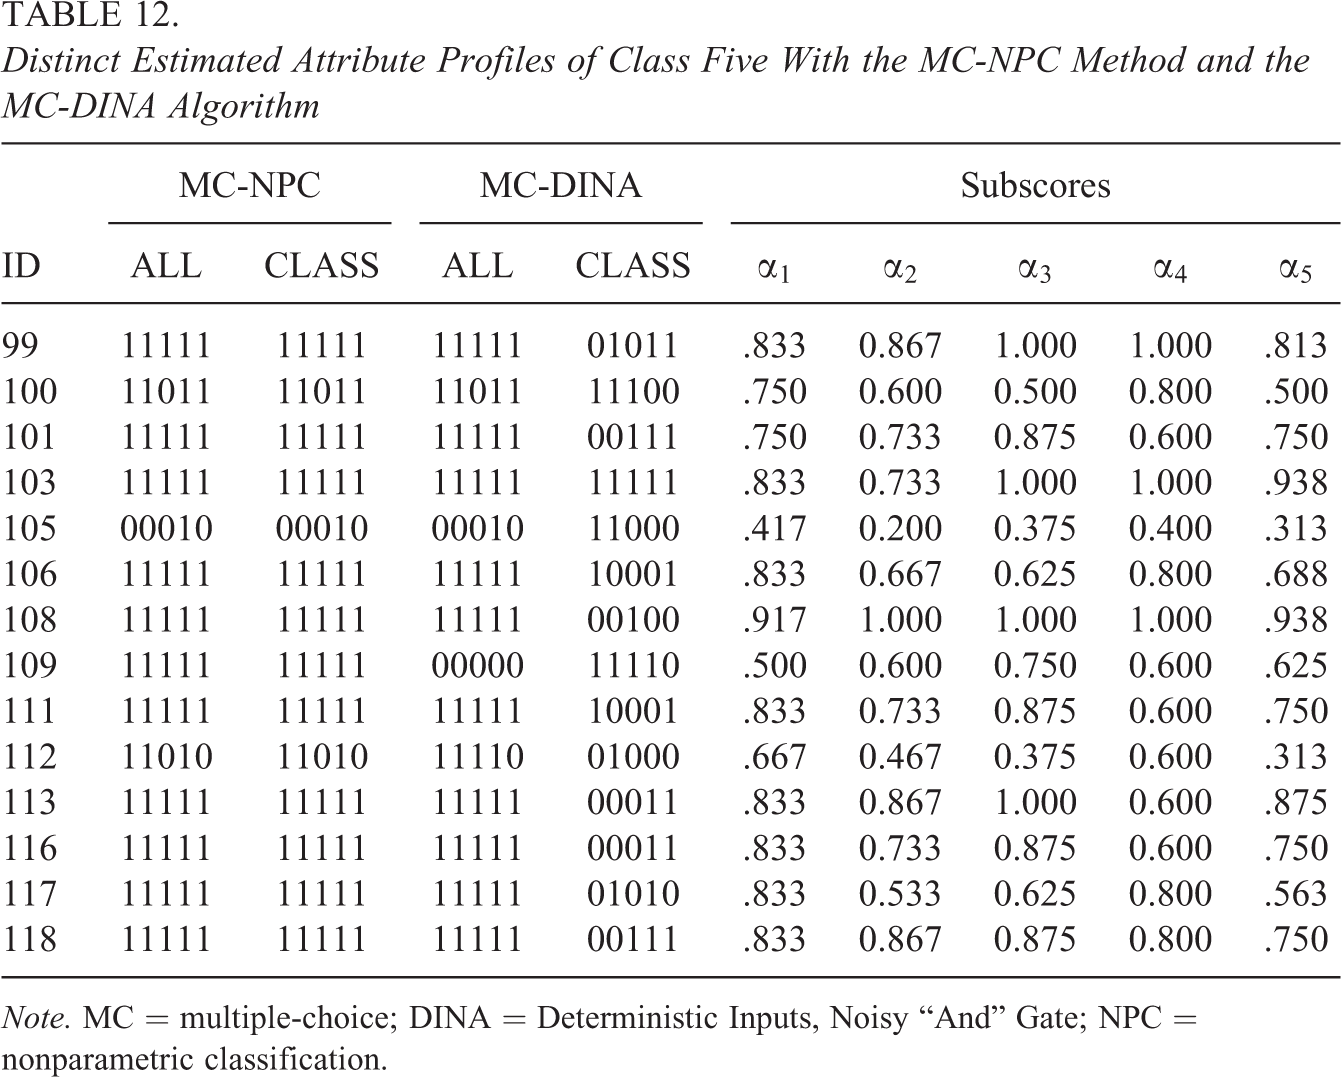
Note. MC = multiple-choice; DINA = Deterministic Inputs, Noisy “And” Gate; NPC = nonparametric classification.
Consider, for example, Examinee 108. All proportions of correct responses to items associated with the five attributes were
Discussion
A MC item consists of a list of response options comprising the key, the correct answer, and several distractors (i.e., incorrect responses). If designed carefully, additional diagnostic information can be gleaned from the responses to the distractors that improves the classification of examinees (de la Torre, 2009). The design of distractors according to de la Torre’s (2009) MC-DINA model is guided by the assumption that distractors lack one of more attributes that are required for a correct response to the key. Said differently, the q-vectors of the distractors are restricted to be nested in that of the key. The implementation of de la Torre’s (2009) MC-DINA model in the
In this article, the MC-NPC method is proposed as a nonparameteric alternative to de la Torre’s (2009) MC-DINA model for use with small samples. Like its companion, the NPC method for dichotmous item responses, the MC-NPC method uses as loss function based on penalized Hamming distances (Chiu & Douglas, 2013). However, the loss function had to be redesigned to meet the specific challenges to accommodate the MC format of observed and ideal item responses. Three major findings from the simulation studies must be mentioned. First, the MC-NPC method can improve the examinee classification rate in comparison with the DINA model and the NPC method applied to dichotomized data. The results further suggest that MC-NPC outperforms MC-DINA in case of small samples. A specific drawback of MC-DINA is its susceptibility to fail convergence when samples are small. In contrast, the MC-NPC method does not rely on fitting a parametric model and is thus, immune to any convergence issues, which makes it the method of choice for monitoring teaching and learning in small educational programs. In fact, the real-world application concerned the CD of assessment data collected in six classes of an elementary school. The key findings are (1) sample size did not seem to affect the performance of the MC-NPC method significantly, (2) MC-DINA appeared to be more sensitive to changes in sample size, and (3) for almost all of the six classes, NPC and DINA, the two methods for binary responses, produced higher PAR than the MC-DINA method. The MC-NPC method, however, should be used with caution for large samples, as it may be less effective compared to the parameter-based MC-DINA method, as the results of Simulation Study I suggest. As another limitation, the MC-NPC method does not provide item parameter estimates, as it does not rely on fitting the data with a parameterized statistical model.
As a general take home message from the simulation studies, using a valid Q-matrix is mandatory. Great efforts should be made to secure completeness of the Q-matrix to guarantee identifiability of the model (e.g., Gu & Xu, 2018) before any data are collected or analyzed. Thus, the development of a solid validation method for the q-vectors of the keys and the distractors should be prioritized. Within this context, recall that for the simulation studies, a Q-matrix of the keys was generated that satisfied Lemma 1 in Chiu et al. (2009). Said lemma states that a Q-matrix is complete for the DINA model if and only if it contains a
Ideal Response Patterns With

Obviously, every attribute profile has its own, distinct ideal response pattern. Therefore, the two items are sufficient to identify all possible attribute profiles. Thus, the Q-matrix formed by the q-vectors of coded response options of Items 1 and 2 is complete. In this example, the Q-matrix of the keys and coded distractors still includes all possible
In conclusion, and closely related, one should also notice that additional (but not necessarily comprehensive) simulation studies (not reported here due to space limitations) suggest that MC-NPC in comparison with MC-DINA is surprisingly “insensitive” to the misspecification of Q-matrix entries—a remarkable finding that certainly deserves further systematic exploration.
Footnotes
Declaration of Conflicting Interests
The author(s) declared no potential conflicts of interest with respect to the research, authorship, and/or publication of this article.
Funding
The author(s) received no financial support for the research, authorship, and/or publication of this article.