
Abstract
Any time examinees have had access to items and/or answers prior to taking a test, the fairness of the test and validity of test score interpretations are threatened. Therefore, there is a high demand for procedures to detect both compromised items (CI) and examinees with preknowledge (EWP). In this article, we develop a procedure that uses item scores and distractors to simultaneously detect CI and EWP. The false positive rate and true positive rate are evaluated for both items and examinees using detailed simulations. A real data example is also provided using data from an information technology certification exam.
1. Introduction
Any time examinees have had access to items and/or answers prior to taking a test, the fairness of the test and validity of test score interpretations are threatened. Therefore, there is a high demand for procedures to detect both compromised items (CI) and examinees with preknowledge (EWP). Although many researchers have considered each of these problems individually (e.g., Sinharay, 2017; Wang & Liu, 2020), a far more common yet challenging problem is one where the CI and EWP must be detected simultaneously. This type of situation could occur, for example, if a testing program has no information regarding the CI or EWP prior to starting the analysis.
In recent years, several methods have been proposed for simultaneously detecting CI and EWP. Many of these methods rely on information from item scores (e.g., Belov, 2017; O’Leary & Smith, 2017), item response times (e.g., Boughton et al., 2017), or both item scores and response times (e.g., Chen et al., 2022). However, because item scores are dichotomous, they are limited in the information they are able to provide. Item response times are continuous and therefore provide a much richer source of information, but unfortunately, response times are not always available.
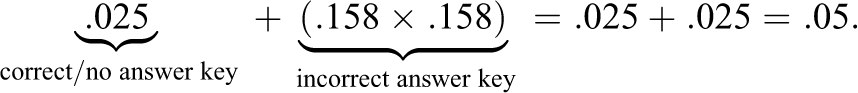
An additional source of information that is often overlooked is distractor selection. Item distractors are polytomous, freely available in all multiple-choice data, and can be used to detect preknowledge of an incorrect answer key. Until recently, many researchers have focused only on detecting preknowledge of a correct answer key and/or no answer key. However, several examples of preknowledge of an incorrect answer key appear in operational settings (e.g., Eckerly, 2021; Liu & Becker, 2022), suggesting a need for detection methods that are also sensitive to this type of preknowledge.
The purpose of this article is to develop a method that uses item scores and distractors to simultaneously detect CI and EWP. Unlike many existing methods, the proposed method is sensitive to preknowledge of no answer key, preknowledge of a correct answer key, and preknowledge of an incorrect answer key. The remainder of this article is organized as follows. In Section 2, a description is provided of the model that is used for the item scores and distractors. In Section 3, we introduce the framework for simultaneously detecting CI and EWP. In Section 4, detailed simulations are conducted to investigate the performance of the proposed approach. The false positive rate and true positive rate are evaluated for both items and examinees. In Section 5, a real data example is provided using data from an information technology certification exam. Finally, in Section 6, we conclude with a brief discussion along with potential directions for future research.
2. Modeling Item Scores and Distractors
To model the item scores and distractors, we apply the two-dimensional nested logit model (henceforth referred to as the NLM). Under the NLM, the probability of a correct response is modeled using a dichotomous model, while distractor selection is modeled using the nominal response model (Bock, 1972) conditional on an incorrect response. The NLM has been shown to provide a reasonable fit to several operational data sets (Bolt et al., 2012) and has successfully been applied in related contexts to detect additional types of aberrant behavior (Gorney & Wollack, 2023).
Consider a multiple-choice test comprised of n items, where item
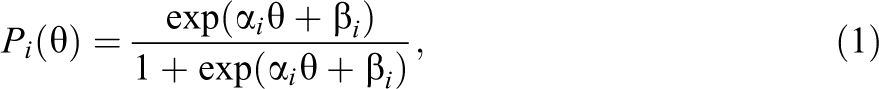
where

The probability of selecting distractor j conditional on an incorrect response is given by
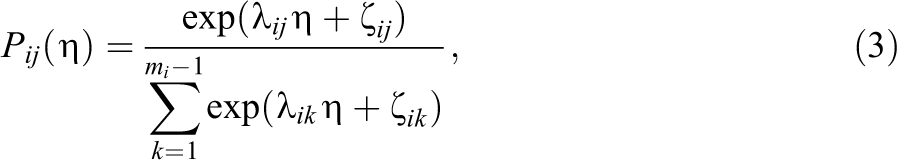
where
To estimate the NLM, we used the
3. Method
In order to simultaneously detect CI and EWP, we propose a flexible framework that consists of two phases. Figure 1 provides a graphical representation of the framework. Within each phase, steps are repeated until some convergence criterion is met. The purpose of Phase 1 (light gray) is to identify an initial set of items that are suspected of being compromised. This phase may be skipped if practitioners already know or have a reasonable idea as to which items have been compromised. Phase 2 (dark gray) then identifies the final set of items that are suspected of being compromised, as well as the set of examinees who are suspected of having preknowledge. At any time, the procedure may be terminated if too many or too few items are flagged. This is because the sets of flagged and non-flagged items must be of reasonable sizes (e.g., at least 4 items) to compare examinee performance across item sets. If fewer than 4 items are flagged, then no solution is returned, meaning that no items or examinees are flagged. If more than
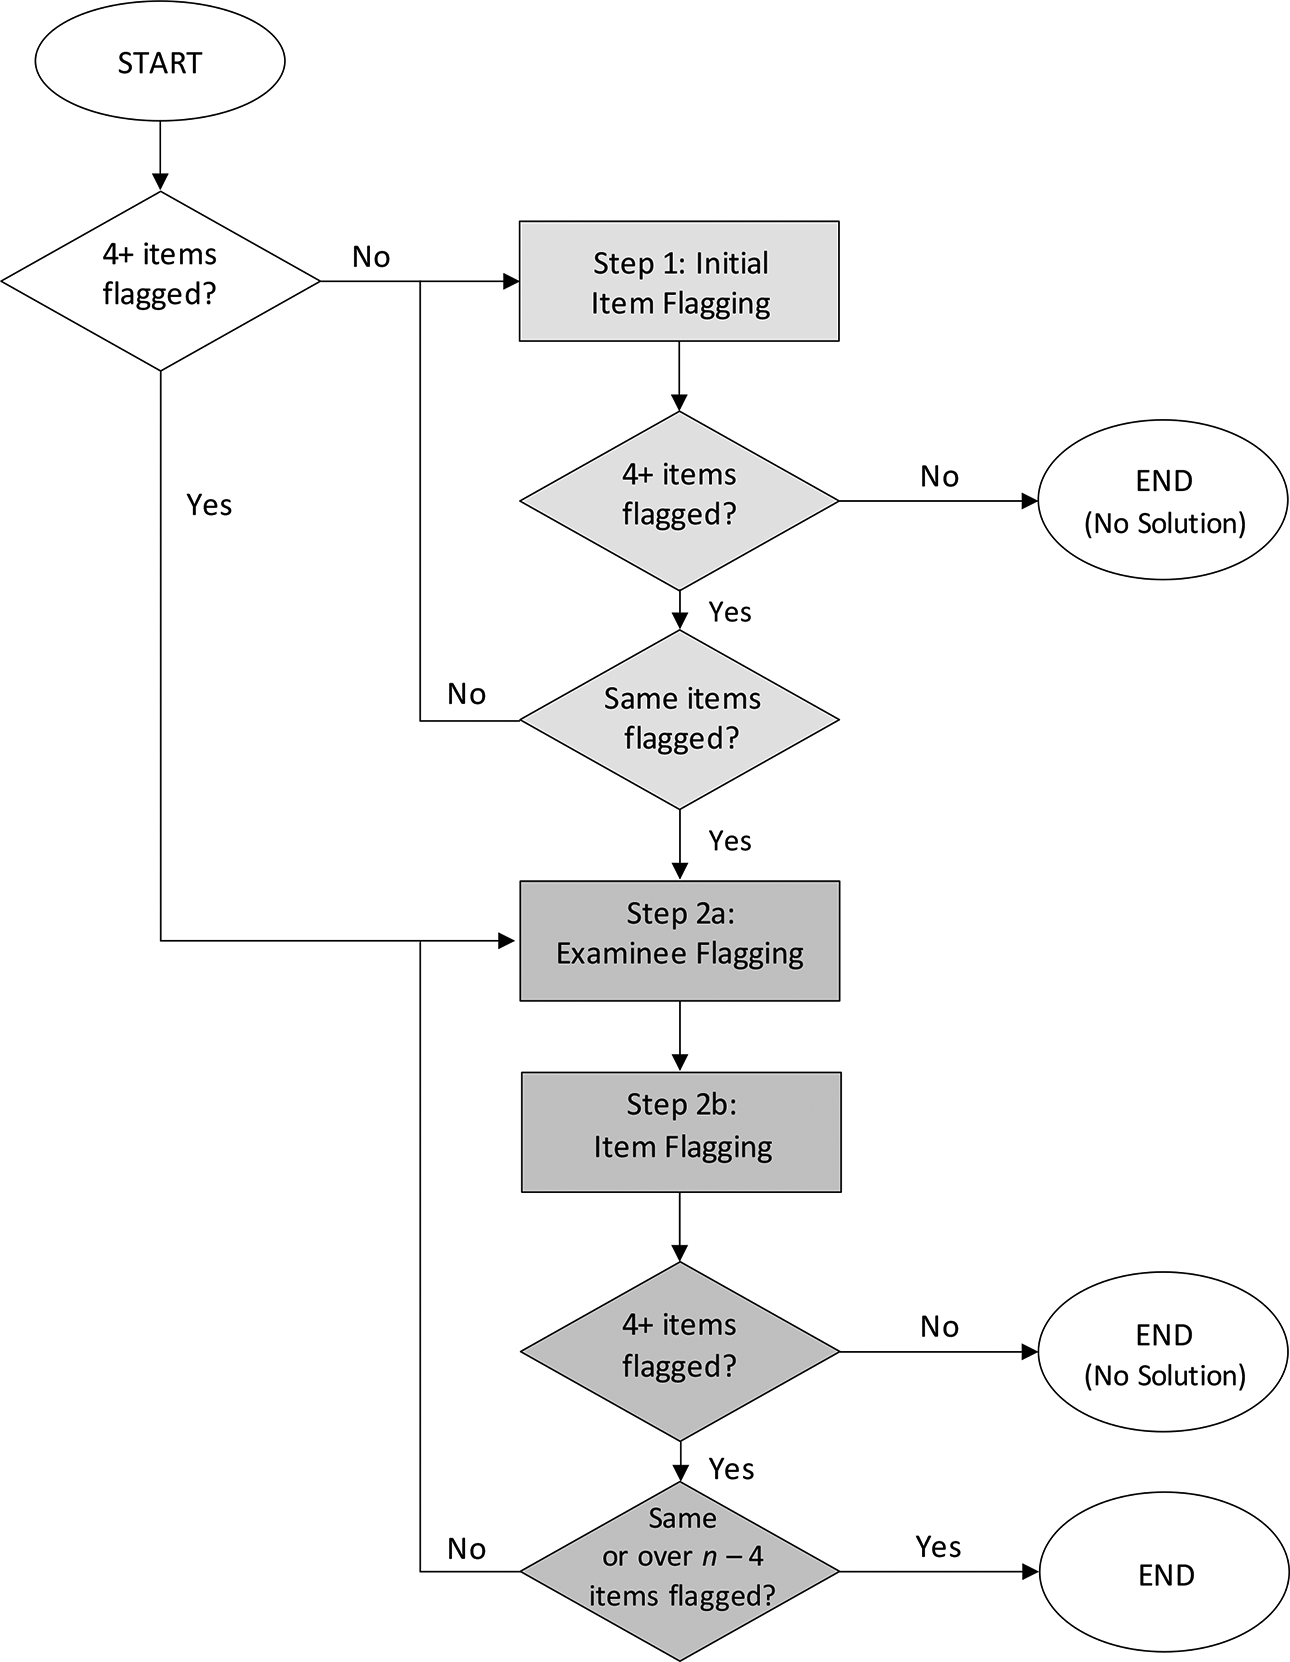
Framework to detect compromised items and examinees with preknowledge. Note. Same items = same set of items flagged within a phase.
The framework has a flexible “plug-and-play” approach, where different statistical methods can be plugged into each of the steps depending on the needs of the testing program. In what follows, we describe two similar, yet distinct, collections of methods that can be used with the suggested framework. Our newly proposed approach is presented next, followed by the closely related existing approach of O’Leary and Smith (2017). Both approaches involve the assumption that the item parameters are known. Future studies might try using different collections of methods and compare them to the approaches that are presented here.
3.1. Proposed Approach (ISLAND)
Our proposed approach uses the following statistics: Item-fit statistics, Signed Likelihood ratio test statistics, AND Differential item functioning (DIF) and differential distractor functioning statistics. Therefore, we refer to our approach as ISLAND from this point forward.
3.1.1. Step 1: Initial item flagging
To identify an initial set of items that are suspected of being compromised, we apply two item-fit statistics: a residual statistic for the dichotomous item scores and a
Let
and

where
In this article, we use a significance level of .05 for the initial item flagging. After splitting the significance level for a two-sided hypothesis test, items with
For convenience, these flagging rules are also provided in the left-hand column of Table 1.
Flagging Rules

Note.
3.1.2. Step 2a: Examinee flagging
To identify the set of examinees who are suspected of having preknowledge, we apply two signed likelihood ratio test statistics. The purpose of applying these statistics is to compare examinee performance across three subsets of items: compromised with a correct answer key and/or no answer key (

and

where, for example,
If some items are suspected of being compromised with a correct answer key and/or no answer key (
If

where

Large positive values of L indicate a greater likelihood of preknowledge, and examinees with
3.1.3. Step 2b: Item flagging
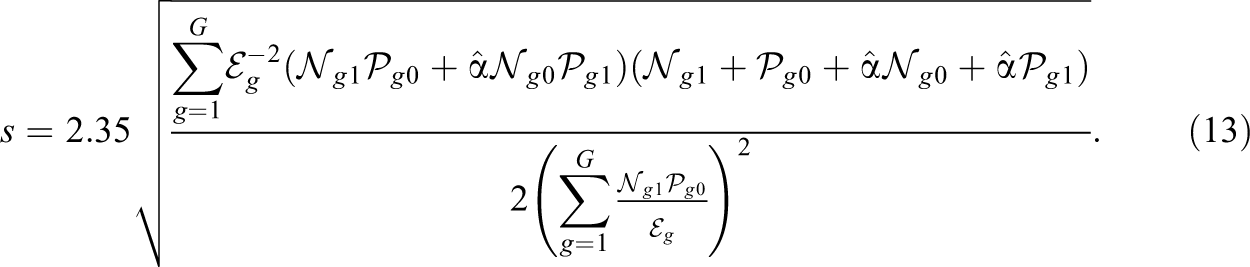
To identify the final set of items that are suspected of being compromised, differential item functioning (DIF) and differential distractor functioning (DDF) analyses are conducted using the Mantel–Haenszel procedure (Holland & Thayer, 1988; Mantel & Haenszel, 1959) and the Educational Testing Service (ETS) C rule (Paek & Holland, 2015)—both of which will be described in detail shortly. DIF/DDF statistics are used rather than the item-fit statistics of Step 1 because only the former are able to compare item performance across subgroups of examinees (EWP vs. non-EWP) and therefore test against the alternative hypothesis of interest. The Mantel–Haenszel procedure is selected because it can work with smaller sample sizes than alternative DIF/DDF procedures, such as the likelihood ratio test. Small sample sizes may be encountered if very few examinees are suspected of having preknowledge. Meanwhile, the ETS C rule is the most conservative of the three ETS flagging rules. Thus, items flagged under the ETS C rule are those for which we are most confident that differences exist across examinee subgroups.
The Mantel–Haenszel procedure is conducted after separating examinees into G strata, where strata are formed by conditioning on some matching variable. In this study, we set
Let

where

where large positive values of

where
Under the ETS C rule, items with
For the DDF analysis, let

where

where large positive values of

where the standard error is given by

Using a strategy similar to the ETS C rule (i.e., where both statistical significance and effect size are considered), items with
3.2. O’Leary and Smith (2017) Approach
O’Leary and Smith (2017) developed a method to simultaneously detect CI and EWP that is similar to ISLAND. However, the following differences between the two methods make it difficult to obtain a fair comparison: (a) the approach of O’Leary and Smith is not iterative, (b) it requires having some idea of which items are secure and which items are compromised before starting the analysis, and (c) it analyzes only item scores (and not item distractors) and is therefore designed to only detect preknowledge of a correct answer key and/or no answer key. In what follows, we modify the first two features of O’Leary and Smith to develop an approach that is compatible with the framework shown in Figure 1. The modified approach is also more similar to ISLAND, allowing for a fairer comparison between the two methods.
3.2.1. Step 1: Initial item flagging
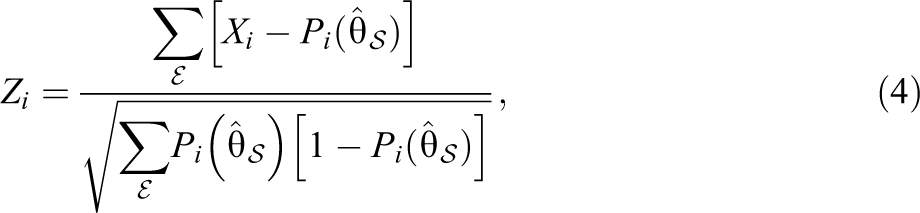
The original approach of O’Leary and Smith (2017) does not include a step for initial item flagging. Therefore, we use the Z statistic of Equation 4 for this purpose. After splitting the significance level of .05 for a two-sided hypothesis test, items with
3.2.2. Step 2a: Examinee flagging
To identify the set of examinees who are suspected of having preknowledge, O’Leary and Smith (2017) suggested using differential person functioning (DPF) as implemented in the computer program Winsteps (Linacre, 2022). The DPF test statistic is given by

with degrees of freedom
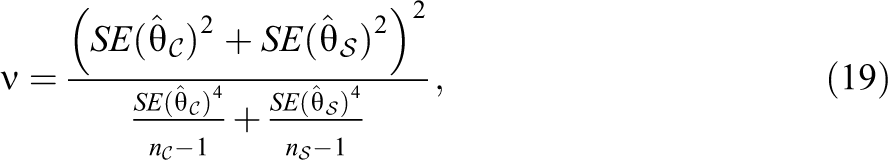
where
3.2.3. Step 2b: Item flagging
To identify the final set of items that are suspected of being compromised, O’Leary and Smith (2017) suggested using DIF as implemented in Winsteps (Linacre, 2022). However, this method for assessing DIF is only valid if the Rasch model is used for calibration. Therefore, to generalize their approach and make it more comparable to ISLAND, we use the MH method that is given by Equations 10
–13. Under the ETS C rule, items with
4. Simulation Studies
We conducted three simulation studies to investigate the performance of the proposed approach (ISLAND). To mimic our real data example, we simulated 2,000 examinees taking a test, where each item had one correct answer and three distractors for a total of four response categories. In all simulations, the item parameters were assumed known.
The false positive rate and true positive rate were computed for both items and examinees. The false positive rate is the proportion of secure items (or non-EWP) that were incorrectly flagged as CI (or EWP), while the true positive rate is the proportion of CI (or EWP) that were correctly flagged as such. It is important to note that because the method is iterative, the false positive rate and true positive rate do not reflect Type I error rate and power in the statistical sense—that is, based on hypothesis testing. However, although the false positive rates for examinees and items cannot strictly be “controlled” at particular significance levels, we do expect them to be close to the significance levels that are used in Steps 2a and 2b, respectively. Therefore, false positive rates that are closer to the intended significance levels and true positive rates that are larger should indicate better performance.
4.1. Study 1: Comparing Methods
4.1.1. Design
The purpose of Study 1 was to compare the performance of ISLAND to the modified approach of O’Leary and Smith (2017). We simulated a 40-item test, where 5% of the examinees had preknowledge of 20% of the items, and the disclosed key was 100% accurate. The extent to which these factors (test length, % EWP, % CI, key accuracy) affect the results is investigated in Studies 2 and 3. For this study, we specifically considered preknowledge of a correct answer key, because the approach of O’Leary and Smith was not designed to detect preknowledge of an incorrect answer key.
Conditions were created by manipulating three factors. The first factor was the detection method that was used (ISLAND or the approach of O’Leary and Smith, 2017). The second factor was the proportion of the disclosed key that was known before starting the analysis (none, quarter, half, or whole). For example, given that 8 (
4.1.2. Data generation
Item responses were generated using the NLM. The person parameters for examinee e were sampled such that

and the item parameters were sampled such that
After simulating the uncontaminated data, the contaminated data were obtained as follows. First, the CI and EWP were randomly selected so that the CI were similar in difficulty to the secure items, and the EWP were similar in ability to the non-EWP. Then, the responses of the EWP to the CI were changed to match the keyed response (i.e., the correct answer) with a probability of 0.9. Otherwise, the original response was retained.
4.1.3. Results
Flagging results for the items and examinees can be viewed in Tables 2 and 3, respectively. In both tables, rows correspond to the different detection methods and examinee significance levels, and columns correspond to the proportion of the disclosed key that was known before starting the analysis. Non-shaded cells indicate that Phase 1 was skipped, because the disclosed key was known for at least 4 items before starting the analysis (see Figure 1). Shaded cells indicate that Phase 1 was executed, because the disclosed key was known for fewer than 4 items before starting the analysis.
Item Flagging Rates for Study 1
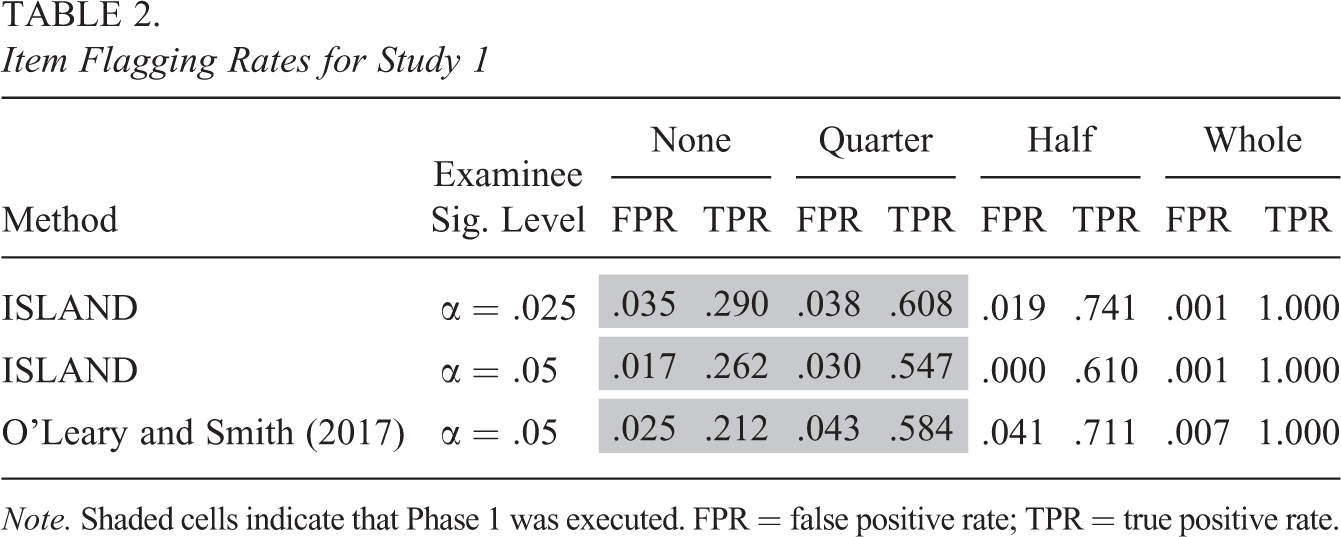
Note. Shaded cells indicate that Phase 1 was executed. FPR = false positive rate; TPR = true positive rate.
Examinee Flagging Rates for Study 1
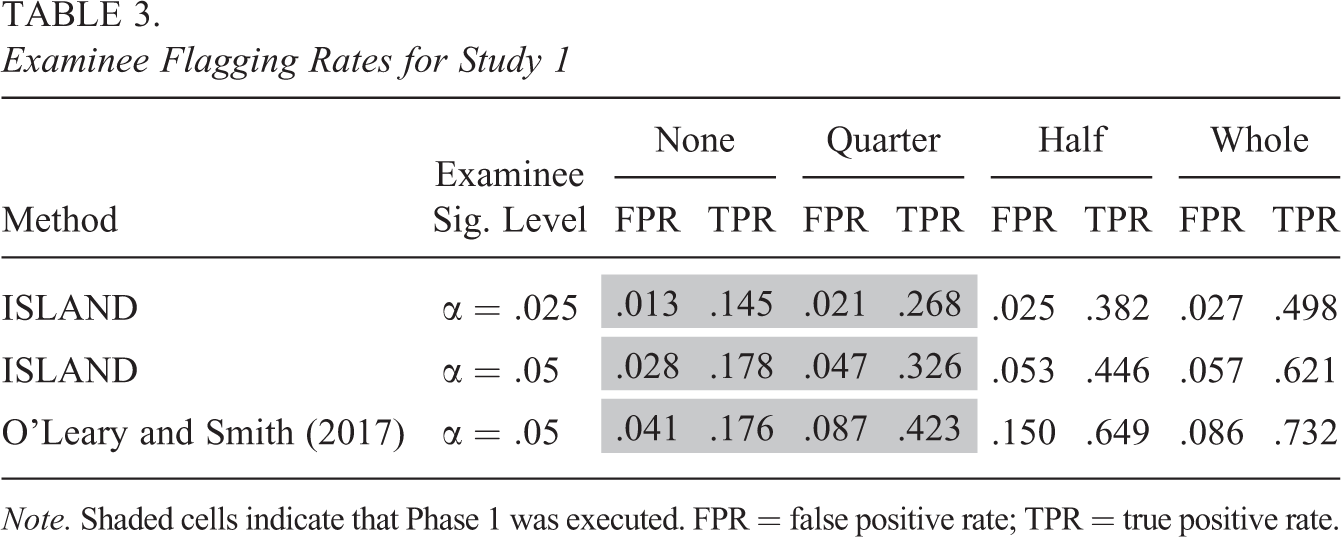
Note. Shaded cells indicate that Phase 1 was executed. FPR = false positive rate; TPR = true positive rate.
For the item flagging results, Table 2 reveals that in all conditions, false positive rates are consistently below the item significance level of .05. This result is expected because both ISLAND and the O’Leary and Smith (2017) approach use the conservative ETS C rule for item flagging. When the same examinee significance level is used for both methods (
For the examinee flagging results, Table 3 reveals that ISLAND typically produces false positive rates that are near or below the examinee significance level, whereas the O’Leary and Smith (2017) approach tends to produce false positive rates that are quite a bit larger. When the same examinee significance level is used for both methods (
In summary, ISLAND appears to offer some advantages over the approach of O’Leary and Smith (2017). Although both methods consistently produce false positive rates for the items that are below the item significance level, only ISLAND is able to produce false positive rates for the examinees that are near or below the examinee significance level. ISLAND also maintains these reasonable false positive rates for different examinee significance levels. Test security analyses are often conducted using extremely small examinee significance levels, so this may be viewed as an important benefit. In general, smaller false positive rates and larger true positive rates are found when a larger proportion of the disclosed key is known before starting the analysis and a smaller examinee significance level is used. Based on these results, all subsequent analyses are conducted using ISLAND at the smaller examinee significance level of
4.2. Study 2: Preknowledge Characteristics
4.2.1. Design
The purpose of Study 2 was to examine the performance of ISLAND in the presence of different types of simulated preknowledge. We again simulated a 40-item test, and conditions were created by manipulating four factors: Key accuracy: 50% or 100% % CI: 10, 20, or 40 % EWP: 5 or 20 Proportion of disclosed key known: none, quarter, half, or whole
The four factors were fully crossed, resulting in a total of 48 (
4.2.2. Data generation
The data generation procedure was identical to that of Study 1 except for two differences. First, under the null condition with test speededness, 5% of the examinees were simulated to be speeded on the last 20% of the items. Speededness was simulated as random guessing such that each response had an equal probability of being selected. The second difference occurred when the key was simulated to be 50% accurate. This level of accuracy was chosen based on our real data example. Under this condition, exactly half of the CI were disclosed with a correct answer key, while the other half were disclosed with an incorrect answer key. As in Study 1, when the disclosed key was correct, the responses of the EWP were changed to match the keyed response with a probability of 0.9. However, when the disclosed key was incorrect, the keyed response was randomly chosen among the distractors such that each had an equal probability of being selected, and the EWP responses were changed to match the keyed response with a probability equal to
4.2.3. Results
Flagging results for the items and examinees can be viewed in Tables 4 and 5, respectively. For the items, it can be seen that across all conditions, false positive rates are near or below the item significance level of .05. Therefore, ISLAND successfully limits the number of secure items that are incorrectly flagged as compromised. For the examinees, false positive rates are also near or below the examinee significance level of .025. In some instances, false positive rates are much smaller than .025, presumably because examinees were flagged by a likelihood ratio test statistic that uses critical values from an asymptotic null distribution. Therefore, conservative results are expected when any of the item sets are small, including, for example, cases where very few items have been compromised (10% CI = 4 compromised items).
Item Flagging Rates for Study 2

Note. Shaded cells indicate that Phase 1 was executed. FPR = false positive rate; TPR = true positive rate; CI = compromised items; EWP = examinees with preknowledge.
Examinee Flagging Rates for Study 2
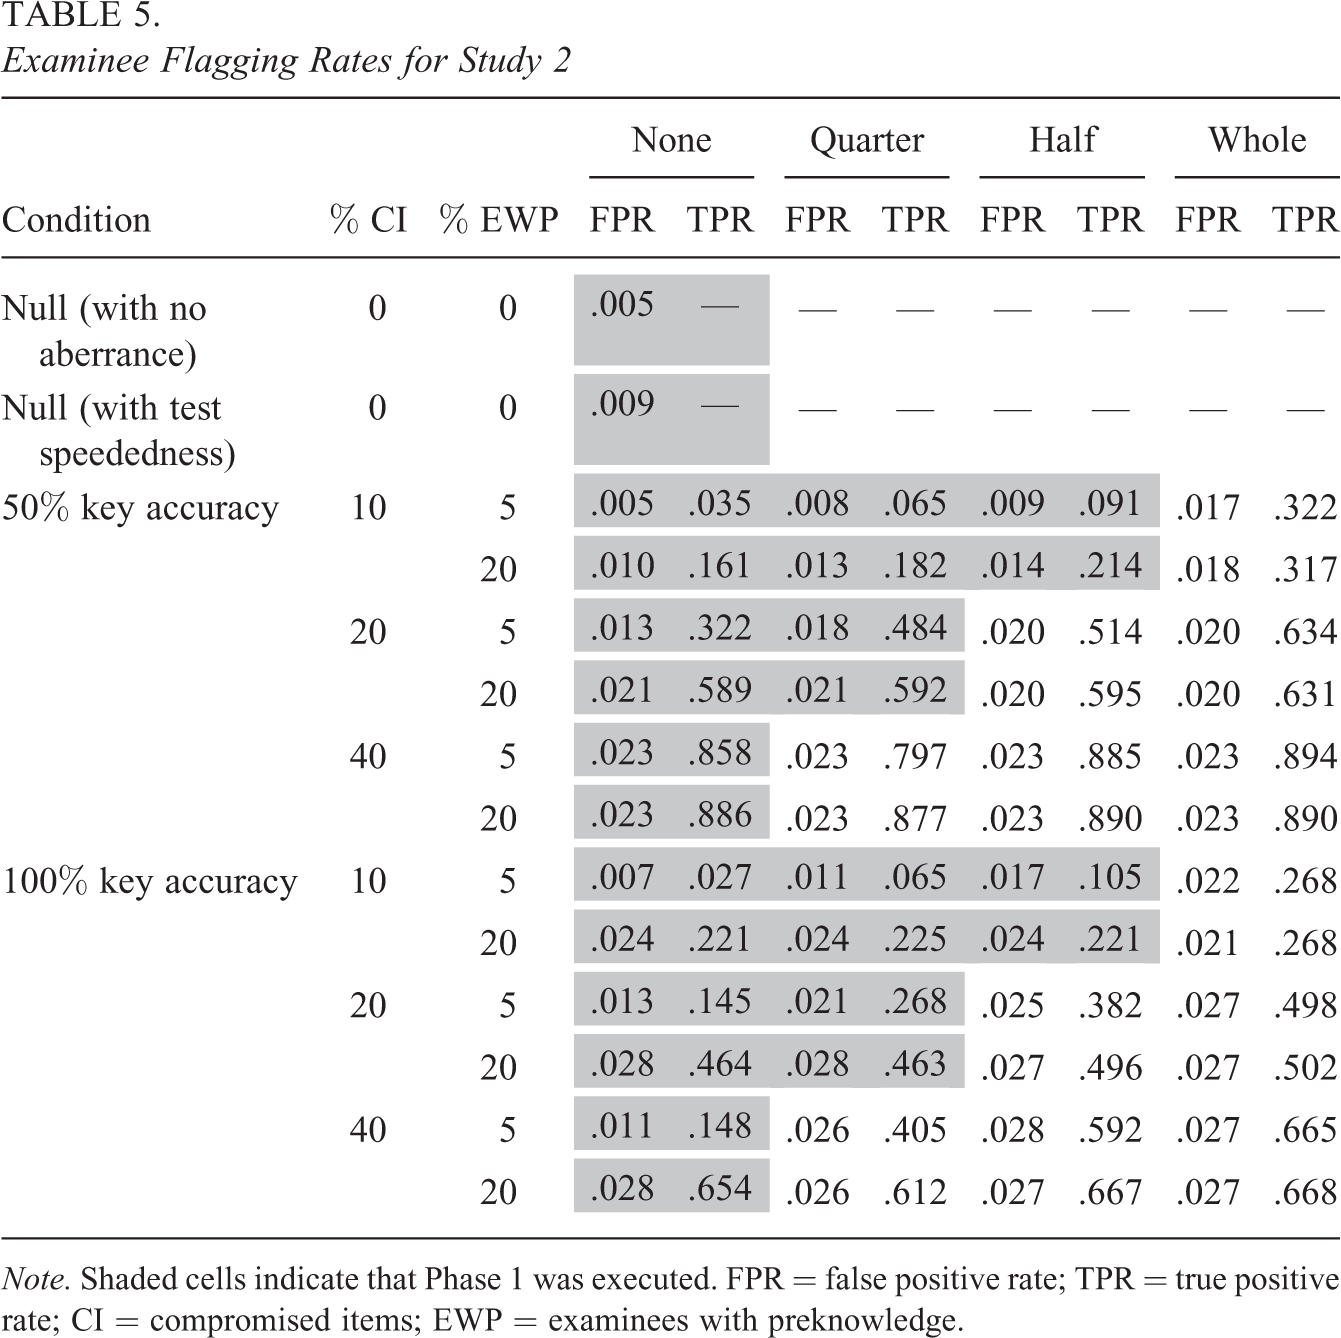
Note. Shaded cells indicate that Phase 1 was executed. FPR = false positive rate; TPR = true positive rate; CI = compromised items; EWP = examinees with preknowledge.
True positive rates for the items and examinees are generally larger when the key is 50% accurate than when it is 100% accurate. This result agrees with previous research on different types of preknowledge (e.g., Gorney & Wollack, 2023) and is not at all surprising when we consider that the test was simulated to be easy. Thus, it would be more unusual to see many incorrect responses than it would be to see many correct responses. True positive rates for the items and examinees also increase as % CI and % EWP increase. Previous research has shown similar results for preknowledge of a correct answer key (e.g., Sinharay, 2017; Wang & Liu, 2020), but it is interesting to see that this finding extends to situations, where the disclosed key is partially incorrect (50% accurate). Some limited simulations confirm that this pattern also holds when the disclosed key is entirely incorrect (0% accurate).
In summary, this study shows that ISLAND produces small and reasonable false positive rates in the presence of different types of simulated preknowledge. True positive rates are noticeably larger when key accuracy is lower, and % CI and % EWP are higher. Relative detection patterns are similar regardless of whether the disclosed key is 50% accurate or 100% accurate.
4.3. Study 3: Test and Examinee Characteristics
4.3.1. Design
The purpose of Study 3 was to examine the performance of ISLAND for different tests and populations. We again considered the case where 5% of the examinees had preknowledge of 20% of the items, and the disclosed key was 100% accurate. Conditions were created by manipulating four factors: Test easiness: easy or medium Test length: 40 or 80 items EWP ability: same as non-EWP or lower than non-EWP Proportion of disclosed key known: none, quarter, half, or whole
The four factors were fully crossed, resulting in a total of 32 (
4.3.2. Data generation
The data generation procedure was identical to that of Study 1 except for two differences. First, easy and medium tests were simulated such that
4.3.3. Results
Flagging rates for the items and examinees can be viewed in Tables 6 and 7, respectively. Overall, false positive rates are very similar to those of Studies 1 and 2. Specifically, false positive rates for the items are below the item significance level of .05, and false positive rates for the examinees are near or below the examinee significance level of .025. True positive rates for both items and examinees are larger for medium tests and when EWP ability is lower than that of the non-EWP. These results are not surprising given that the presence of many correct responses would seem especially unusual under such conditions. True positive rates are also larger for the 80-item tests than they are for the 40-item tests, presumably because longer tests produce more accurate ability parameter estimates, which in turn improves detection of EWP.
Item Flagging Rates for Study 3
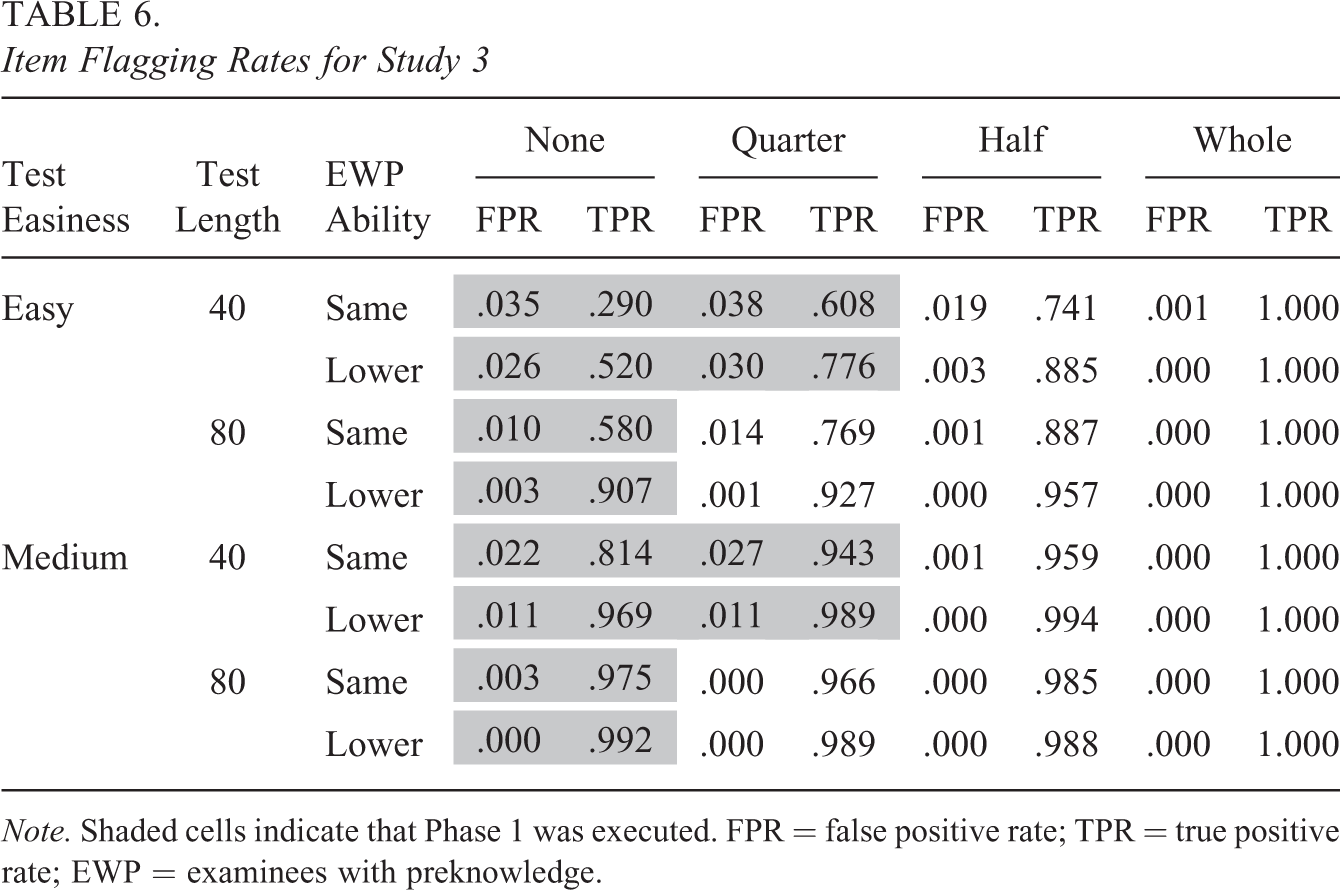
Note. Shaded cells indicate that Phase 1 was executed. FPR = false positive rate; TPR = true positive rate; EWP = examinees with preknowledge.
Examinee Flagging Rates for Study 3
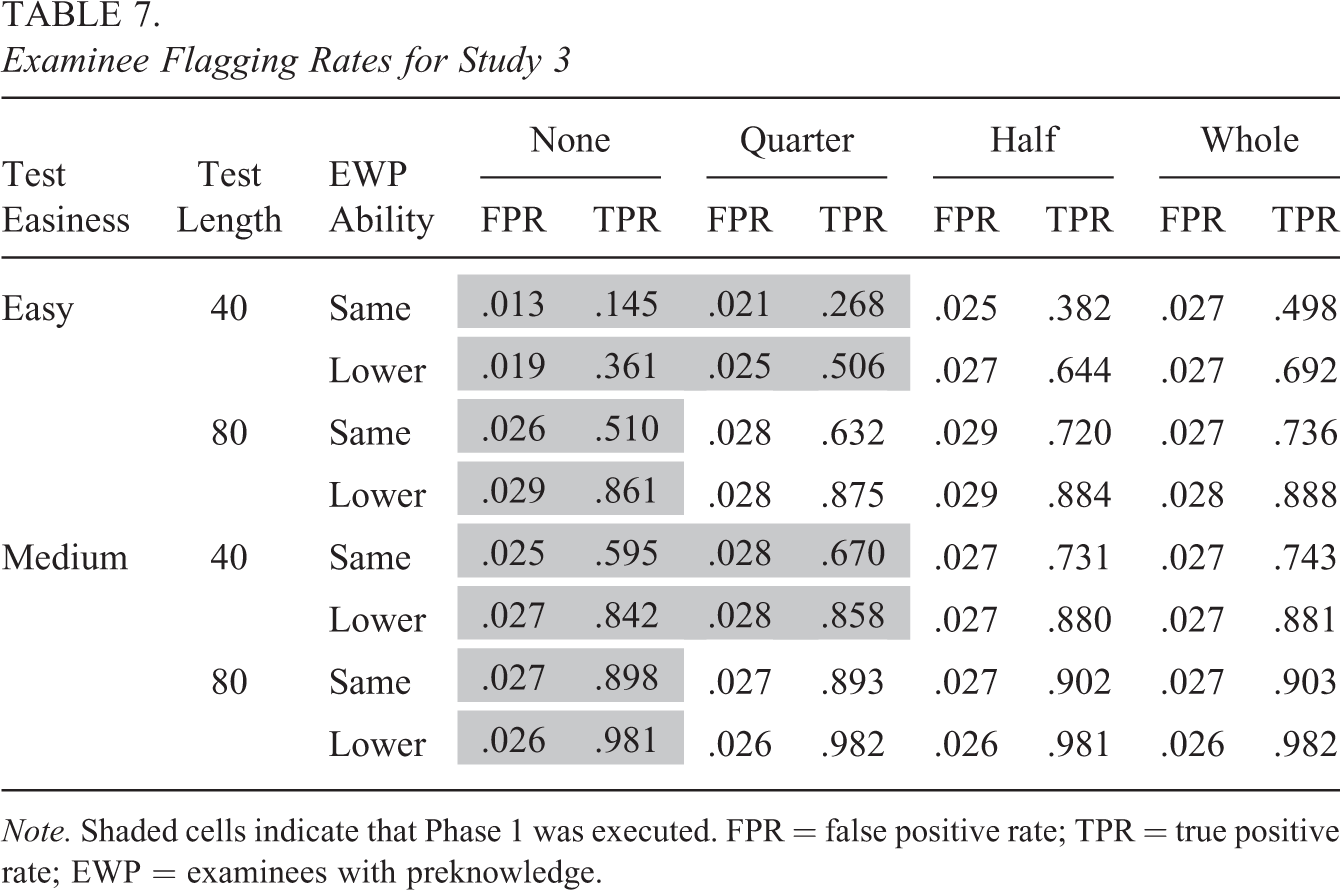
Note. Shaded cells indicate that Phase 1 was executed. FPR = false positive rate; TPR = true positive rate; EWP = examinees with preknowledge.
5. Real Data Example
The data in this example originated from a single form of an information technology certification exam and were also studied by Eckerly (2021) and Sinharay (2021). The sample comprises 1,992 examinees who took a 60-item test; however, only 39 of these items were administered in the multiple-choice format and are used in this analysis. All 39 items were published on a braindump site with answer keys. Specifically, 15 of these items (38%) were disclosed with a correct answer key, while the remaining 24 items (62%) were disclosed with an incorrect answer key.
The first 600 examinees who took the test were used for item calibration, and the resulting item parameter estimates were treated as known item parameters for all subsequent analyses. This subsample was selected for item calibration due to the sudden change in average test scores that occurred shortly after this point (Figure 2a), and because the testing program had reason to believe that many of the response patterns after this point had been contaminated by preknowledge. As in the simulation studies, the 2PLM was used to model item scores since it was found to provide a significantly better fit than the Rasch model. The nominal response model was used to model distractor selection. Furthermore, to make use of the full data set, missing responses were scored as incorrect and were treated as an additional response category. This treatment has been used in previous research on detecting aberrant behavior (e.g., Drasgow et al., 1985).

Moving average (size = 400) of (a) average test scores and (b) proportion of flagged examinees over time.
We ran ISLAND under the assumption that no information was known regarding the compromise status of the items. As in the simulation studies, we used an examinee significance level of .025. Results showed that the procedure terminated because so many items (36 of 39) were flagged by the DIF and DDF statistics. This is the result we would expect to see if there was, in fact, widespread compromise.
To investigate this claim more thoroughly, we reviewed which items and examinees had been flagged. We found that the procedure had flagged 86.7% the items that had been disclosed with a correct answer key, and 95.8% of the items that had been disclosed with an incorrect answer key. On the examinee side, the procedure flagged 2.5% of Examinees 1–600 and 27.7% of Examinees 601–1992 (Figure 2b). Given that the testing program had been fairly certain the first 600 examinees were clean and that we had used an examinee significance level of .025, these results strongly suggest that the responses of those who took the test earlier differed significantly from the responses of those who took the test later.
Finally, in order to study these differences more closely, we examined the results at both the examinee and item levels in the form of the proportion correct scores. Figure 3(a) reveals that nearly all flagged examinees performed better on the items that were known to be disclosed with a correct answer key than on the items that were known to be disclosed with an incorrect answer key. Similarly, Figure 3(b) shows that performance improved over time on the items that had been flagged as compromised with a correct answer key, whereas performance declined over time on the items that had been flagged as compromised with an incorrect answer key. Taken together, these findings suggest that the signal ISLAND had detected was indeed preknowledge of the published answer key.
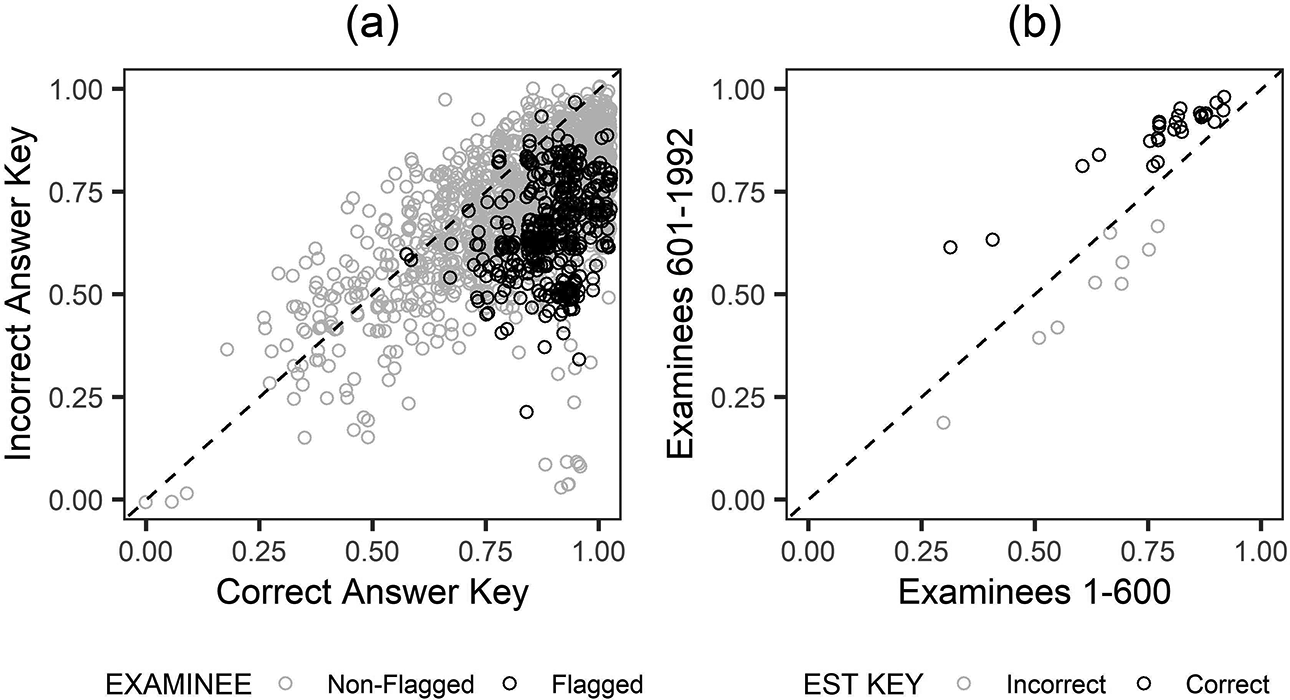
(a) Proportion correct scores on items disclosed with a correct answer key versus items disclosed with an incorrect answer key and (b) item p values for examinees 1–600 versus examinees 601–1992.
6. Discussion
Although many methods have been developed to simultaneously detect CI and EWP, the majority of these methods are limited in that they only utilize item scores and/or item response times. By doing so, such methods overlook an additional source of information that is freely available in all multiple-choice data: distractor selection. Among other benefits, item distractors offer the unique advantage of being able to detect preknowledge of an incorrect answer key. There is a surprising lack of research in this area, despite the fact that many examples of this type of preknowledge have been found in operational settings.
In this article, we developed a method that uses item scores and distractors to simultaneously detect CI and EWP. Unlike many existing methods, ISLAND is sensitive to preknowledge of no answer key, preknowledge of a correct answer key, and preknowledge of an incorrect answer key. Results showed that in contrast to an existing approach (O’Leary & Smith, 2017), ISLAND was able to produce small and reasonable false positive rates for both items and examinees across all conditions. Subsequent analyses revealed that true positive rates for the items and examinees were largest when key accuracy was lower, % CI and % EWP were higher, the test was longer and more difficult, EWP ability was lower than that of the non-EWP, and a greater proportion of the disclosed key was known before starting the analysis.
Following our simulations, we conducted an analysis of preknowledge behavior on a real data set with known compromise. We ran ISLAND under the assumption that no information was known regarding the compromise status of the items and found results that closely aligned with the information provided by the testing program. We believe that these results, combined with those of the simulation studies, suggest that ISLAND is an effective method for simultaneously detecting CI and EWP.
There are several limitations to this article, providing many opportunities for future research. First, due to the iterative nature of the method, false positive rates for the items and examinees could not strictly be “controlled” at particular significance levels. However, in our simulations, we found the false positive rates to be consistently near or below the significance levels that were used in Steps 2a and 2b, indicating that ISLAND effectively limited the number of non-EWP who were incorrectly flagged as EWP as well as the number of secure items that were incorrectly flagged as compromised. Second, we only compared ISLAND to the existing approach of O’Leary and Smith (2017). It would be useful to compare ISLAND to other score-based methods, such as the information theory and combinatorial optimization approach of Belov (2017), or response-based methods, such as the exact-matching near-matching approach of Haberman and Lee (2017). Third, it would be helpful to analyze additional real data sets, including those for which the disclosed key is 100% accurate. Fourth, in its current form, ISLAND is only designed to detect a single group of EWP who have preknowledge of the same set of CI. It would be useful to extend the approach to detect multiple groups of EWP who have preknowledge of different sets of CI. A simple way to do this would be to run ISLAND once, remove the examinees who are flagged, and then run ISLAND again to see whether any additional examinees and items are flagged. A more complex extension of the method could also be developed.
Finally, it is important to remember that ISLAND is but one collection of methods that can be plugged into the much larger framework of Figure 1. The framework is flexible in that it allows different statistical methods to be plugged into each of the steps; therefore, it would be interesting and useful for future studies to try using different collections of methods. For example, a valuable extension would be to include methods that incorporate response times. Previous research has found that EWP tend to respond more quickly to items for which they have preknowledge (e.g., Gorney & Wollack, 2022a), and presumably such information could be leveraged to further improve detection results (see, e.g., Sinharay & Johnson, 2020).
Footnotes
Authors’ Note
This work was completed while the first author was an Educational Testing Service Harold Gulliksen Psychometric Research Fellow.
Declaration of Conflicting Interests
The author(s) declared no potential conflicts of interest with respect to the research, authorship, and/or publication of this article.
Funding
The author(s) received no financial support for the research and/or authorship of this article.