
Abstract
Instance-level contrastive learning such as SimCLR has been successful as a powerful method for representation learning. However, SimCLR suffers from problems of sampling bias, feature bias and model collapse. A set-level based
Introduction
Representation learning is a key challenge in natural language processing (NLP). Self-supervised learning (SSL) achieves great empirical success across multiple domains, including computer vision [2,3,8], NLP [6,7,18], and speech recognition [17]. SSL learns meaningful structures from randomly initialized networks with large-scale unsupervised data, which can learn effective representations for downstream tasks.
A simple contrastive learning framework for visual representation learning is proposed in SimCLR [2], where augmented samples are constructed as contrastive-positive sample pairs. By the contrastive network, it tries to maximize agreement between differently augmented views of the same sample via a contrastive loss in the latent space.
Pre-training model used in text representation learning such as BERT [5], BERT-whitening [13], BERT-flow [10], etc. have achieved great success in different tasks. [7,12,18] combined pre-training model and contrastive learning are more effective than BERT and other pre-training models. Compared with the traditional pre-training model, applying contrastive learning on NLP can obtain better representation based on simple structure.
However, the instance specificity [1,19] leads to sampling bias in SimCLR, as illustrated in Fig. 1, where labels “0” is negative and labels “1” is positive in sentiment of the SST-2 dataset. Since the true labels are not available in pre-training, the contrastive-negative samples are randomly selected from dataset. It is possible that a sample (Sample-5 in Fig. 1) with positive sentiment is included in the contrastive-negative sample set (CNS). This phenomenon is referred to as sampling bias [4]. It may lead to significant performance drop in the classification task [4]. Meanwhile, instance-level learning only focuses on the target sample, the representation learning may lack the learning of category invariance, which we refer to as feature bias. Thus, increasing samples may be helpful for reducing the possibility of sampling bias and feature bias.
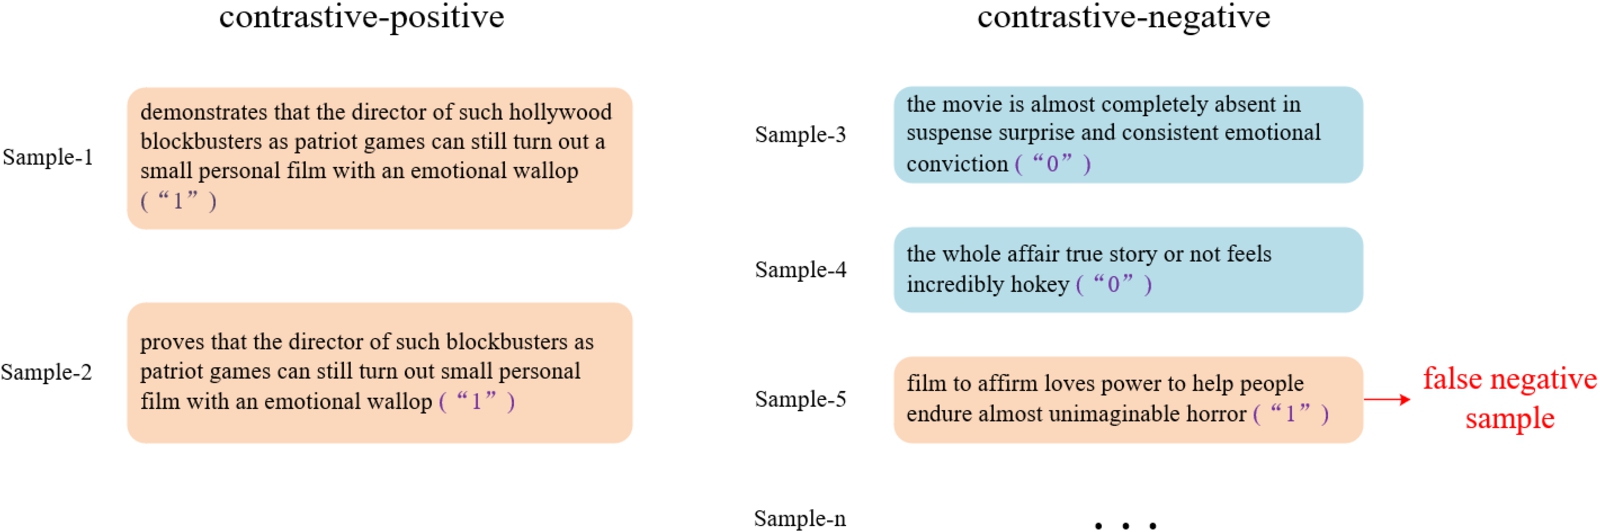
Sampling bias on SST-2.
Besides, SimCLR needs a large number of negative samples in training to avoid model collapse [2,9,14,20]. Once the number of negative samples in SimCLR is reduced, the model learning will collapse to a constant solution and few valid classification information can be learned. MOCO [9] avoids collapse by a momentum-based moving average of the query encoder, that the negative samples come from preceding several mini-batches. BYOL [8] does not use negative samples and iteratively bootstraps the outputs of a network to serve as targets for an enhancement. SimSiam [3] is a simpler structure based on BYOL which directly maximizes the similarity of one image’s two views, using neither negative pairs nor a momentum encoder. It can work surprisingly well and prevent collapsing.
For the problems of sampling bias and feature bias, a set-level based contrastive learning is proposed, which is shown in Fig. 2. SimCLR generates two augmented samples (Augmentations) based on the original samples (Starter). In this paper, more samples with the closest semantic distance are super-sampled as the Neighbors near the Augmentation. We use RoBERTa as the feature extractor, which has reasonable embeddings. It can be approximated that if there are samples of the same emotional category as Augmentation in the current batch, they will be selected as Neighbors. The Augmentations and Neighbors form a contrastive-positive sample set (CPS), which extend SimCLR from the instance-level sampling to the set-level sampling.

Set-level super-sampling.
Since the unbalance between Alignment and Uniformity will lead to model collapse, we propose a sample-correlation strategy to maintain the balance of the model. In the super-sampling method, CPS can improve Alignment with more contrastive-positive samples, but less samples in CNS decrease the model’s Uniformity. We try to balance the model’s Alignment and Uniformity by a samples-correlation strategy, which adjust correlation of CPS (positive correlation loss) or correlation of CNS (negative correlation loss).
A Sampling Enhanced Contrastive Learning (SECL) method based on SimCLR is proposed for the downstream classification task, which includes: (1) A CPS obtained by super-sampling, (2) Sampling correlation in the loss function. Overall, contributions can be summarized as follows:
The proposed super-sampling method selects additional samples (Neighbors) from CNS to form CPS. The Neighbors contribute to learn set-level sample features for the downstream classification task.
We propose a positive correlation loss, where the Augmentations’ correlation is computed and added to the Super-Sampling InfoNCE loss. The loss ensures a larger difference between Augmentations and samples in CNS.
The negative correlation loss is proposed to strengthen the negative correlation between contrastive-positive and contrastive-negative samples, which can also highlight the impact of the CPS. The network structure is simpler while similar precision and recall are achieved.
Experiments show SECL can improve the downstream classification precision by 1.31%, 0.72%, and 1.15% compared with SimCLR on SST-2, ARSC, and AGNews dataset.
SimCLR is a simple contrastive framework proposed by [2]. They constructed a representation learning system: First, a batch size N is generated from the original image. For each image in the batch, a random transformation function is applied to obtain a pair of randomly augmented images as contrastive-positive sample pair. Then, the representation vector of each augmented image is obtained by two identical encoders. A series of nonlinear layers are defined as projectors, that map representations to the space where contrastive loss is applied. Finally, the contrastive loss function is defined for a contrastive prediction task. This framework not only improves existing self-supervised learning methods, but also surpasses supervised learning methods on ImageNet.
The contrastive loss function InfoNCE in SimCLR can be expressed as follow:
The numerator of the function InfoNCE encourages high similarity of the contrastive-positive samples. The denominator part encourages the lowest similarity between any contrastive-negative samples. As the numerator only calculates the distance of different augmentation of the same image, there may be sampling bias, feature bias and other problems. Meanwhile, in order to keep enough individual features in the model, the denominator relies on a large number of negative samples, that leads to a risk of collapse while the negative samples are decreased.
Sampling bias
Unsupervised deep learning methods include clustering [21] and sample specific learning [1,19]. Clustering mainly focuses on the characteristics of classes, sample specific learning goes to the other extreme by considering every single sample as an independent class, such as SimCLR. However, the sample specific learning is likely to yield more ambiguous class structures and less discriminative features.
Figure 3(a) shows the bias problem. Samples
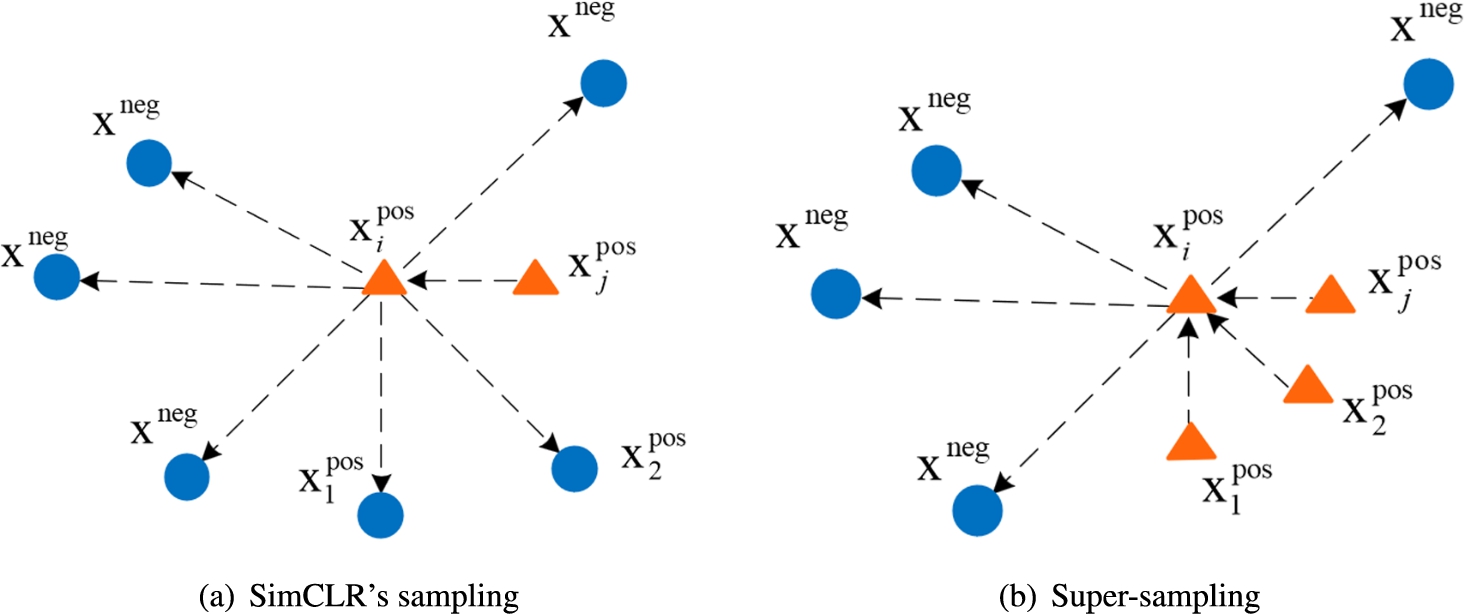
Comparison of sampling method. Triangles and squares represent contrastive-positive and contrastive-negative samples,
Compared with the contrastive-positive sampling of SimCLR, a super-sampling method is proposed to get the set-level samples features. As shown in Fig. 3(b), the optimizing samples are selected as Neighbors (for example:
Literature [15] proposed that good contrastive learning should have two attributes: Alignment and Uniformity. By contrastive-positive samples, Alignment enables similar samples to have similar features as much as possible. And Uniformity means retaining as much different information as possible in features. Violating the principle of Uniformity leads to a trivial solution where all samples collapse into a unique representation. We can use Eq. (2) and Eq. (3) to justify the inner working of each approach [6,15]:
SimCLR makes a balance between maximum similarity (Alignment) and minimum similarity (Uniformity) by generating a large number of contrastive-negative samples based on a large batch of samples.
In super-sampling method, more samples are treated as contrastive-positive ones, which may produce more collapse risk. Experiments (Table 4) show collapse occurs when the number of samples increases to 6 with batch size 16.
Equilibrium of Alignment and Uniformity can be guaranteed by learning the correlation between Neighbors and Augmentations. As shown in Fig. 4, compared with the correlation strategy that uses super-sampling in SimCLR, the strategy of positive correlation further narrows the distance between the Augmentations, that ensures a bigger difference between Augmentations and samples in CNS. The negative correlation strategy enlarges the distance between CPS and CNS, that enhances the expression of sample specificity in the model.
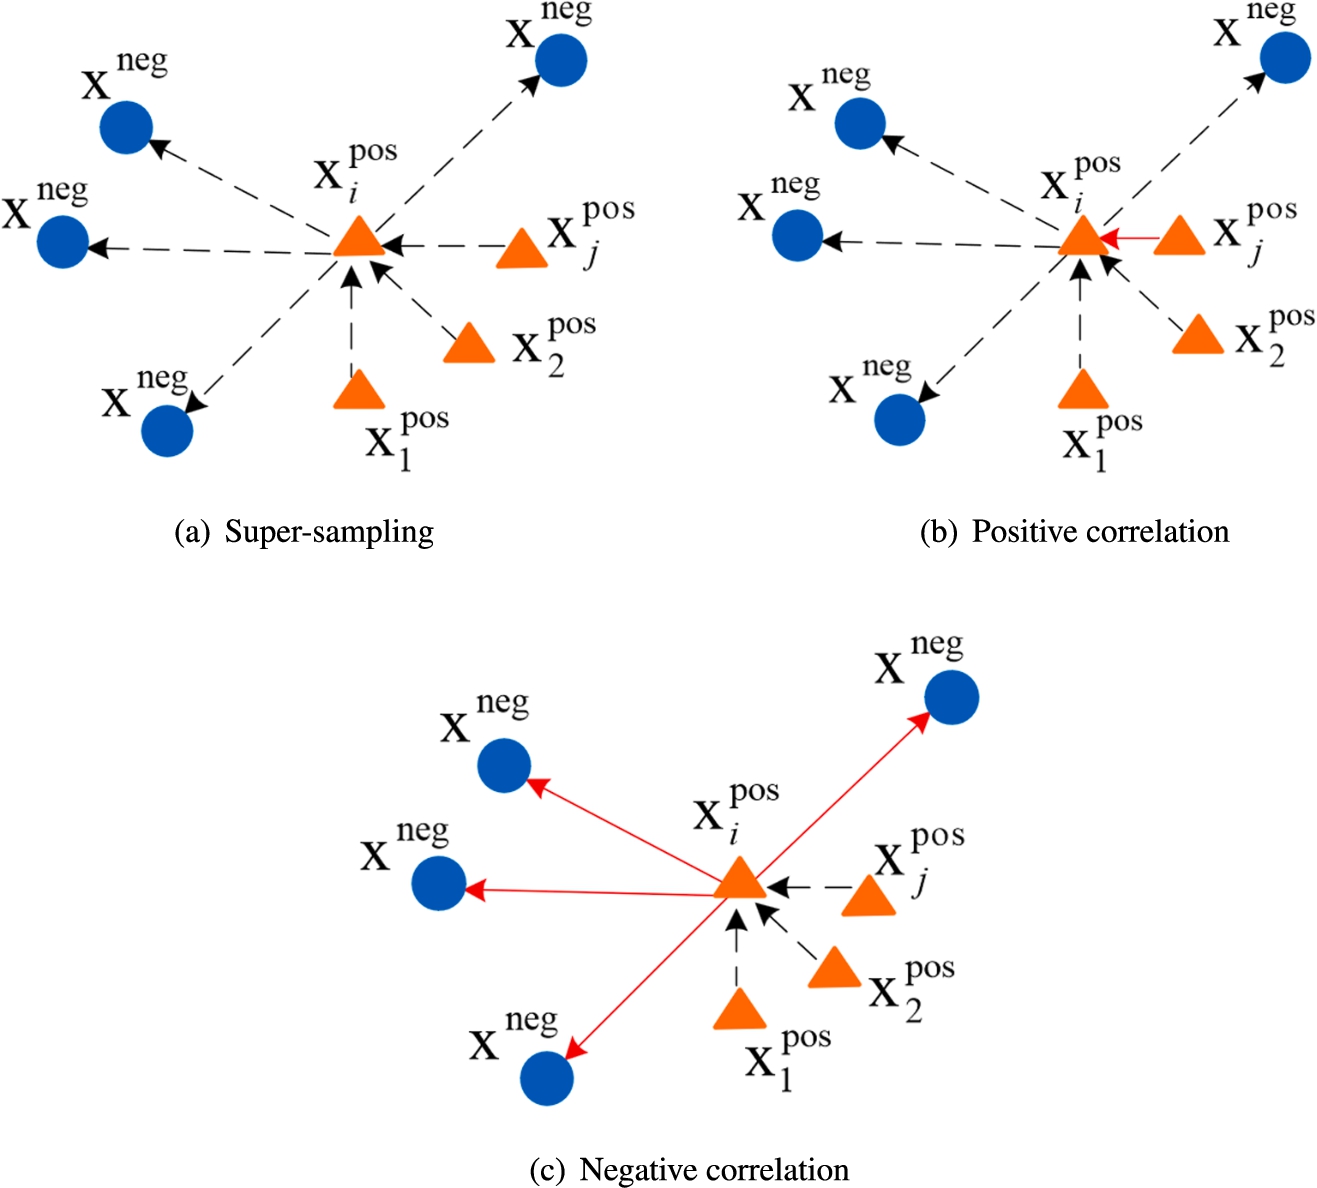
Correlation strategies.
Super-sampling method
For the problem of sampling bias, a super-sampling method is proposed to get class features by increasing the contrastive-positive samples, where the nearest semantic distance is chosen as the optimizing sampling strategy of the Neighbors.
Augmentations
CPS X is obtained by adding Neighbors which are the new nearest M samples around Augmentation. As the
Neighbors in the super-sampling method are selected among the input batch. When the batch size is N, after data augmentation there will be
Corresponding, the loss function in SimCLR is modified:
Figure 5 shows the margins of super-sampling. Neighbors in the same class can be searched with high probability in a narrow margin. Whereas Neighbors with different classes in a wide margin can be searched into CPS, which obviously affects subsequent model training.
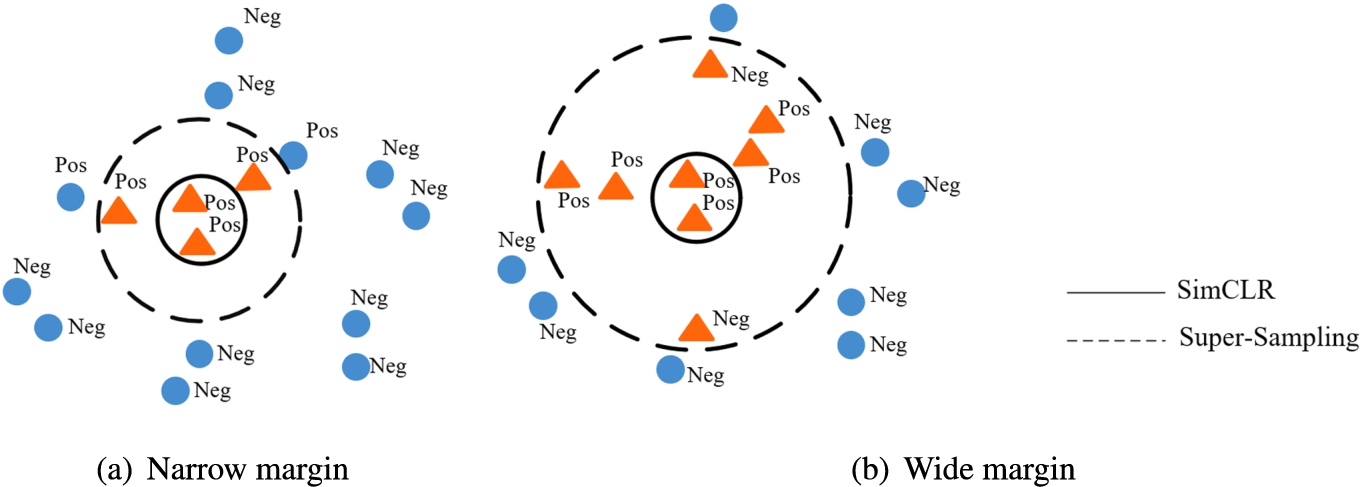
Margins of super-sampling.
We introduce a samples-correlation strategy including two kinds of loss functions to adjust the balance of model’s Alignment and Uniformity, which will reduce the risk of model collapse.
Positive correlation loss (PC loss)
SimSiam [3] adopts the Siamese networks for contrastive learning without negative sample pairs, which performs better on the downstream tasks. The correlation of the Augmentations with an asymmetric structure from SimSiam is calculated, and added to the final loss. The final loss includes the influence of the Neighbors and also highlights the importance of the Augmentations, that balance Alignment and Uniformity of learning.
The asymmetric structure as Fig. 6, has different MLP layers on outputs The optimization of the loss function is as follow:
The asymmetric structure.
The positive correlation loss (PC loss) includes the Super-Sampling loss and the cross-entropy loss of the Augmentations:
Cross-entropy is as follow:

The proposed NC loss increases the weight of the negative sample pairs in the loss function of Super-Sampling loss with the simple contrastive structure of SimCLR, and strengthens sample specificity. The sample specificity in SimCLR is:
In Super-Sampling loss, new contrastive-positive samples are added, and the sample specificity is:
Equation (12) reduces
Contrastive learning framework
The proposed framework is illustrated in Fig. 7, where SECL-P denotes the model with PC loss and SECL-N denotes the model with NC loss. SECL comprises four components:
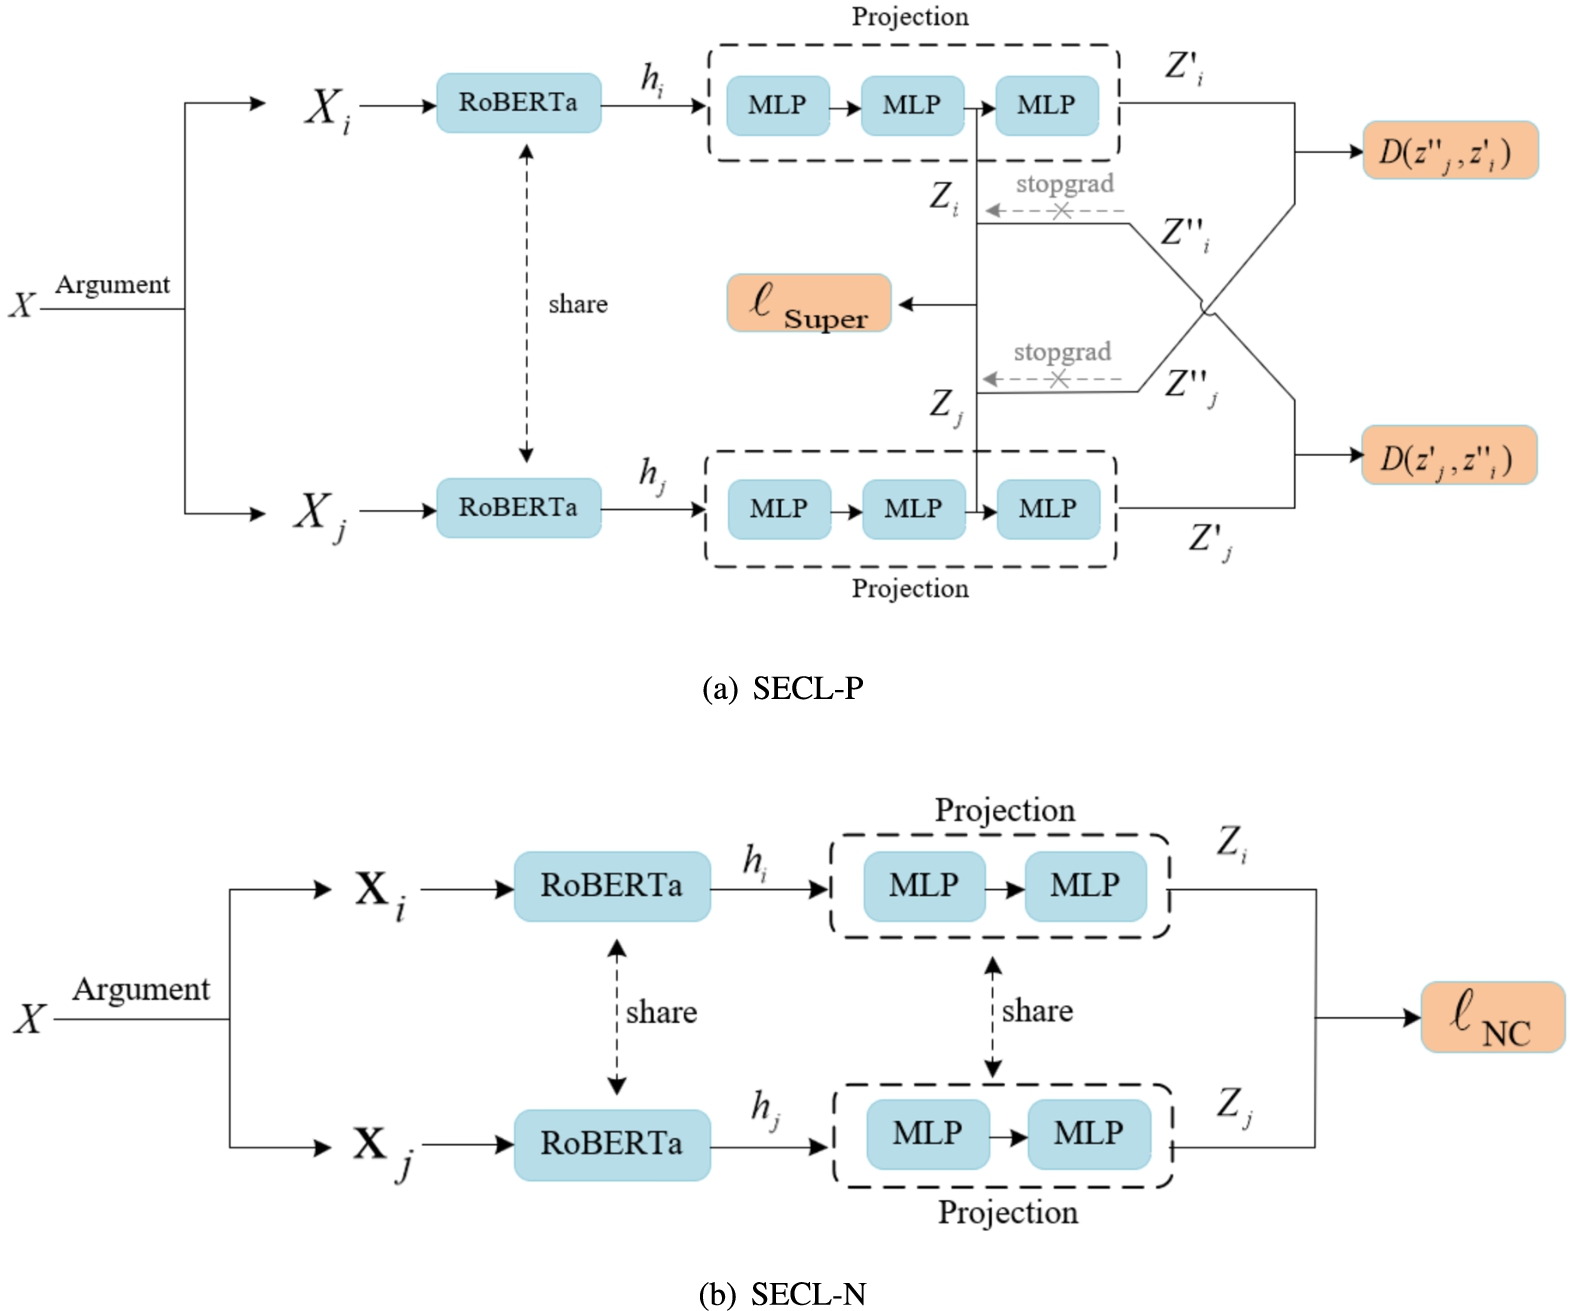
SECL.
Experiments in this section are designed to reveal the good performance of SECL, and to ensure our results can be easily reproduced with reasonable computation resources. We initialize the model with a random seed for 5 times and average the results.
Datasets
The experiments are conducted on the Stanford Sentiment Treebank dataset (SST-2), the Amazon Review Sentiment Classification dataset (ARSC) and AG’s News Topic Classification dataset (AGNews). SST-2 and ARSC contain two kinds of emotions: Positive and Negative. AGNews is a four-class classification task. In order to verify the existence of collapse, SST-2 (mini) dataset is a part of SST-2 where the number of Positive and Negative samples are the same (7500). The distribution of the datasets is shown in Table 1. The pre-training data is unlabeled, and the fine-tuning and testing data are labeled.
Distribution of the datasets
Distribution of the datasets
We use pretrained RoBERTa-base as our feature extractor. During pre-training, we update both RoBERTa and MLP. In fine-tuning, we replace the MLP in SECL with a linear classification head and update SECL.
The parameters for each training stage are shown in Table 2, while SECL-N has a learning rate of 1e−5 in the pretraining stage. The MLP’s hidden dimension size is 768. And for different datasets, the value of λ is 1.4 (SST-2), 1.6 (ARSC), and 2 (AGNews).
Parameter settings
Parameter settings
SECL (
Comparison with baselines
Comparison with baselines
The convergence of SECL’s loss is shown in Fig. 8 (taking SST-2 as an example), where y axis is a logarithmic scale of the training loss, and x axis is the training epoch. The loss has converged to
The accuracies of SimCLR and SECL on the validation sets (also taking the SST-2 dataset as an example) are demonstrated in Fig. 9. After the
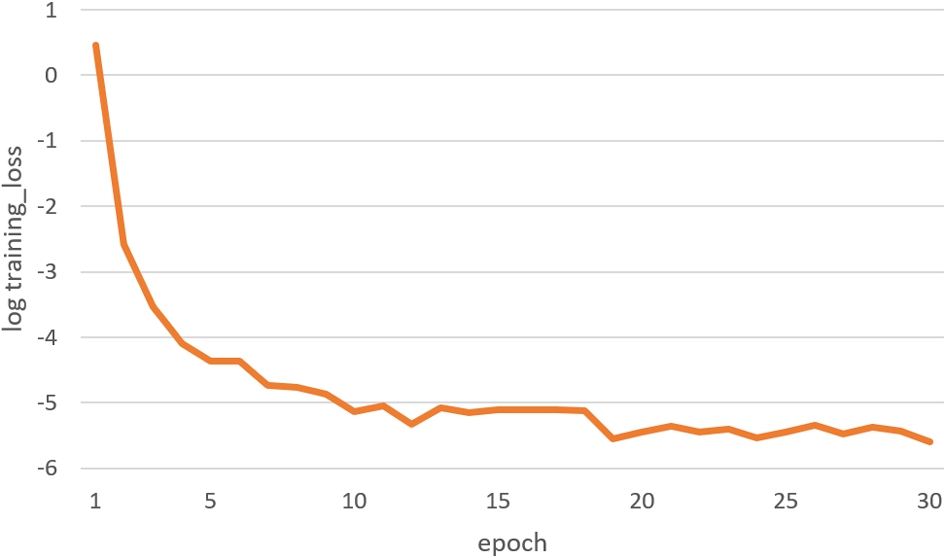
The convergence of loss.
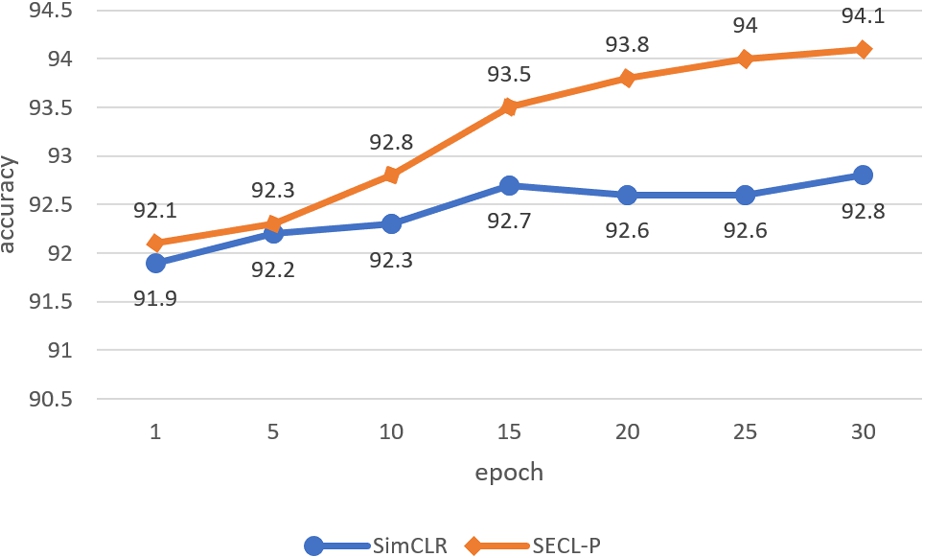
Accuracies on validation on SST-2.
We use Eq. (2) and (3) to justify the inner workings of our approaches (the SST-2 as an example), as shown in Fig. 10. We visualize checkpoints every 300 training steps and the arrows indicate the training direction. For both

In order to study the super-sampling margin, M (
With the super-sampling method, S_SimCLR (
When margin
The results of M (
)
The results of M (
Table 5 presents a comparison on “with vs. without stop-gradient”. The architectures and all hyperparameters are kept unchanged, and stop-gradient is the only difference.
We update SECL asynchronously by different MLP layers on the output embeddings and stop-gradient. As clearly shown in Table 5, once the stop-gradient is removed, the precision will drop significantly. It suggests that the stop-gradient is the key to preventing the model from converging to a constant solution.
Experimental results of “with vs. without stop-gradient”
Experimental results of “with vs. without stop-gradient”
Model collapse occurs when the super-sampling margin increases, as shown in Table 4. To investigate the impact of the collapse, the dataset SST-2 (mini) with the same amount of Positive and Negative samples is designed to ensure that Neighbors have enough samples with the same class as the Augmentation. Results are shown in Table 6.
The classification precision of S_SimCLR (
On SST-2 (mini), the classification precision of
Results on SST-2 (mini)
Results on SST-2 (mini)
In this work, a