
Abstract
In this paper, a novel approach for transductive classification is proposed. Unlike existing methods that heavily rely on constructing the Laplacian matrix to capture data distribution, the proposed approach takes a unique path. It employs a linear transformation model to create local patches for each data point and then unifies them in an objective function to build the Laplacian matrix. Incorporating this Laplacian matrix into the transductive classification framework allows us to assign optimal class labels globally. The experimental results from toy data and real world databases demonstrate that the proposed approach achieves more efficient and stable performance, while this approach is insensitive to the parameters. Notably, our method exhibits robustness to parameter variations, making it highly adaptable to practical applications.
Introduction
Classification is one of the most fundamental research topics in machine learning, with the primary goal of effectively separating data into distinct classes. Over the past few decades, various classification methods have emerged. For instance, the Support Vector Machine (SVM) [6] constructs a hyperplane to maximize the margin between two data sets, Linear Discriminant Analysis (LDA) [21] identifies axes that maximize the separation between different class data points while keeping data from the same class close, and deep learning-based methods [16,24] aim to minimize classification loss through neural networks. In these supervised classification algorithms, the classifier is initially trained using labeled samples and is subsequently employed to predict class labels for unseen test data. However, many scenarios involve the availability of a substantial amount of unlabeled data. For instance, in text classification, users may have access to a vast database of documents, but only a fraction of them are manually labeled.
In order to leverage both the labeled and unlabeled data, researchers have proposed semi-supervised classification methods [22], including the Expectation-Maximization algorithm for semi-supervised generative mixture models [13], Self-training [28], Co-training [3,30], Transductive Support Vector Machine (TSVM) [10,27], and graph-based transductive classification methods [7,25]. These methods can be broadly categorized into two classes: the inductive classification method and the transductive classification method. The inductive classification method aims to induce a decision function with a low classification error rate across the entire sample space, while the transductive classification method directly estimates labels for unlabeled data. TSVM [1] can be seen as a straightforward extension of the maximum margin principle of SVM to unlabeled data. It incorporates two distinct principles: regularization through margin maximization on labeled samples and the cluster assumption through margin maximization on unlabeled samples. The existing graph-based transductive classification methods can be formulated as quadratic optimization problem, in which the Laplacian matrix [2] is constructed to estimate data distribution while considering supervised label information. The Gaussian Laplacian based classification (Lap) [19] is a popular transductive classification method; however, its classification performance is highly sensitive to the bandwidth parameter [23], which is used to construct Laplacian matrix based on Gaussian function. Another related graph-based transductive classification is transductive classification via Local Learning algorithm (LL) [26], which applies the concept of local learning to classify specific data points based on their neighbors.
In graph-based transductive classification methods, the construction of the Laplacian matrix, which estimates the distribution of data samples, plays a crucial role in enhancing performance. The patch alignment framework, introduced in [31], unifies existing data distribution measurements into a comprehensive framework comprising two essential components: local patch construction and global alignment. Drawing inspiration from this framework, this paper introduces a novel approach to transductive classification through patch alignment. Distinguishing itself from Lap, which directly employs the Gaussian kernel to compute the Laplacian matrix, the proposed method utilizes a unified objective function to train a linear transformation model for constructing local patches. Consequently, the Laplacian matrix is constructed through a global alignment process that combines all these patches. In contrast to LL, the proposed approach features a unified objective function, enabling the direct acquisition of the Laplacian matrix in a single step. Classification experiments conducted on toy data and six real-world databases showcase the superiority of the proposed method over LL. Furthermore, compared to Lap, the proposed approach demonstrates robustness to related parameters, rendering it more practical for real-world applications.
The rest of this paper is organized as follows. Section 2 presents some related works. The algorithm of transductive classification via patch alignment is proposed in Section 3. Section 4 gives the experiments and discussions, and Section 5 is the conclusion.
Related works
Transductive classification
According to the different ways of processing unlabeled data, semi-supervised learning is divided into inductive and transductive methods [22]. Moreover, graph-based transductive classification methods have received more attention since their effectiveness in practice [7]. A general way to formulate the transductive classification problem is given as follows.
Given a set of n data
To compute the Laplacian matrix L in Lap [19], a weighted k-nearest neighbor graph of n nodes is built, the corresponding Laplacian matrix is computed as:
Another transductive classification method, the LL [26] algorithm formulates a Laplacian matrix which leads to a solution with the property that the label of each data can be well predicted based on its neighbors and their labels. This method adopts two steps to learn the Laplacian matrix. In the first step, a local model is learnt and in the second step, the sum of local prediction errors of all the data is minimized to compute the Laplacian matrix. Based on the above, Lap, NLap and LL are selected as the comparison algorithms in this paper.
Patch alignment framework
From the above elaborations, it shows the Laplacian matrix, which reveals the intrinsic structure of the data distribution, is critical for the performance of the transductive classification algorithms. Many research works have demonstrated that the local manifold structure is more important than the global one [14] during the estimation of data distribution, and some research works [4,26,29] report that the local learning algorithms often outperform global ones. However, the global information [33] should also be considered for the estimation of the data structures.
In order to explicitly explain the relationship between the “Local” structure and “Global” structure, the patch alignment [31] framework is proposed to unify the existing data distribution measurements into two parts: patch optimization and whole alignment. The local patch can be constructed differently according to specific applications, while the whole alignment is shared by all methods. And it was used to unify various spectral analysis-based dimensionality reduction algorithms, such as ISOMAP [20], LPP [9], LTSA [32]. Additionally, in [29], a ranking algorithm based on local regression and global alignment is proposed for cross media retrieval. However, the proposed method focuses on the problem of transductive classification. And it is built based on the patch alignment strategy for dimension reduction [31].
Given a data set X with n data samples
Since different data distribution measurements have their own mapping rules,
Transductive classification via patch alignment
In this section, we propose a novel transductive classification method, in which the Laplacian matrix is constructed according to the patch alignment framework [31].
Local patch construction
Given
In order to learn the linear transformation model for each patch, the local prediction error of the model with respect to a single data
It can be found that the local patch error can be computed by summing the local prediction errors from all the data in
The calculated coordinates for all the data in
In order to assign an optimal
To set the derivatives of Eq. (12) to be zero for the variable
After calculating
Whole alignment
Following the whole alignment tricks presented in Eq. (7) and Eq. (8), the objective function in Eq. (17) becomes
Comparative analysis with the existing method
Therefore, from the local learning point of view, we can see that Lap, NLap and TCPA differ from each other mainly in their answers to the local learning problem. Clearly their final classification performance heavily relies on whether the corresponding local models can properly estimate
Experiment and discussions
Databases
Databases descriptions
Databases descriptions

Sample data from 6 databases used in the experiment.
In order to get a good picture of the effectiveness of the algorithms, we compare their generalization performance on toy data and six real world databases with different properties. The toy data contains three classes and each class has 500 samples. The real world databases consist of multi-class problems. In Coil-20 [11], the data are gray-scale images of 20 different objects taken from different angles. The Princeton 3D Model databases [17] contains 1814 models collected from the World Wide Web. For each 3D model, there is an Object File Format (.off) file with the polygonal geometry of the model, and they can be classified into 53 categories according to the model’s semantics. The ORL database [15] contains 10 different images of each of 40 distinct subjects. For some subjects, the images are taken at different times, varying the lighting, facial expressions and facial details. The Yale-B face database [8] contains face images showing varying facial expressions and configurations. The CMU Pose, Illumination, and Expression (PIE) database [18] contains the facial images of the human face taken under 13 different poses, 43 different illumination conditions, and with 4 different expressions. The USPS database contains the well known data on handwritten digit recognition. For the databases of COIL-20, ORL, Yale-B, PIE and USPS, the images are treated as vectors of intensity values. For the 3D model database, the D2 shape distribution descriptor [12] is implemented to build the vectors. The details of these databases used in our experiment are presented in Table 1, and the sample images are shown in Fig. 1.
The parameters configurations for the experiments are listed clearly in Table 2. We first use the toy data to compare the performance of Lap, NLap, LL and TCPA. For Lap and NLap, the performance is influenced by three parameters: number of nearest neighbor (k), bandwidth parameter (t) and labeled samples (l), while LL and TCPA also contain three parameters: number of the nearest neighbor in the local patch (k), regularization parameter (μ) and labeled samples (l). The experiments are separated into three parts, and the results are presented in Fig. 2, 4 and 6, in which the points in three concentric circles represent the three classes in the toy data, and the classification results are shown by the red, green and blue points.
Parameters configurations of the transductive methods in experiments
Parameters configurations of the transductive methods in experiments
Similarly, the experiments on real world databases are also divided into three parts. As shown in Table 2, in each experiment, we fix two parameters and vary another parameter with different values. For example, in experiments of evaluating the classification performance influenced by l, a random subset with l samples per object (e.g. for Coil-20,
In the method of graph based Transductive Support Vector Machine (G-TSVM) [12], the pairwise distances computed by the Gaussian kernel (Eq. (4)) is implemented to reflect the cluster assumption. According to the experiments in [5], bandwidth parameter t for Gaussian kernel can be determined as 1000, which leads only to a minor loss in accuracy. The two penalty parameters p and
Linear Discriminant Analysis (LDA) searches for the project axes on which the data of different classes are far from each other while requiring data of the same class to be close to each other;
Principle Component Analysis (PCA), which maximizes the mutual information between original high-dimensional data, is a linear and unsupervised dimensional reduction method. It can be used for classification just as the LDA;
Locality Preserving Projections (LPP) [9] builds a graph model which reflects the intrinsic geometrical structure of the data space, and finds a projection that respects this graph structure. Since LPP also adopt the Gaussian kernel (Eq. (4)) to construct the adjacency matrix to preserve the graph structure, the two parameters K and t are also fixed at 5 and 1000 in this experiment.
It should be noted that for the dimension reduction methods (LDA, PCA, LPP), the classification is adopted in the low-dimensional space. After obtaining the projection matrix, the original data are projected into the low-dimensional space, and the classification is conducted through K-NN classifier. We have found the reduced dimension can affect the classification results, so the highest ARs that the dimension reduction methods can achieve are presented.
In order to discuss the influence of the parameters in these four methods, and compare their performance on toy data and real world databases, several experiments are conducted on toy data in this section. A total of three parameters are discussed: k,
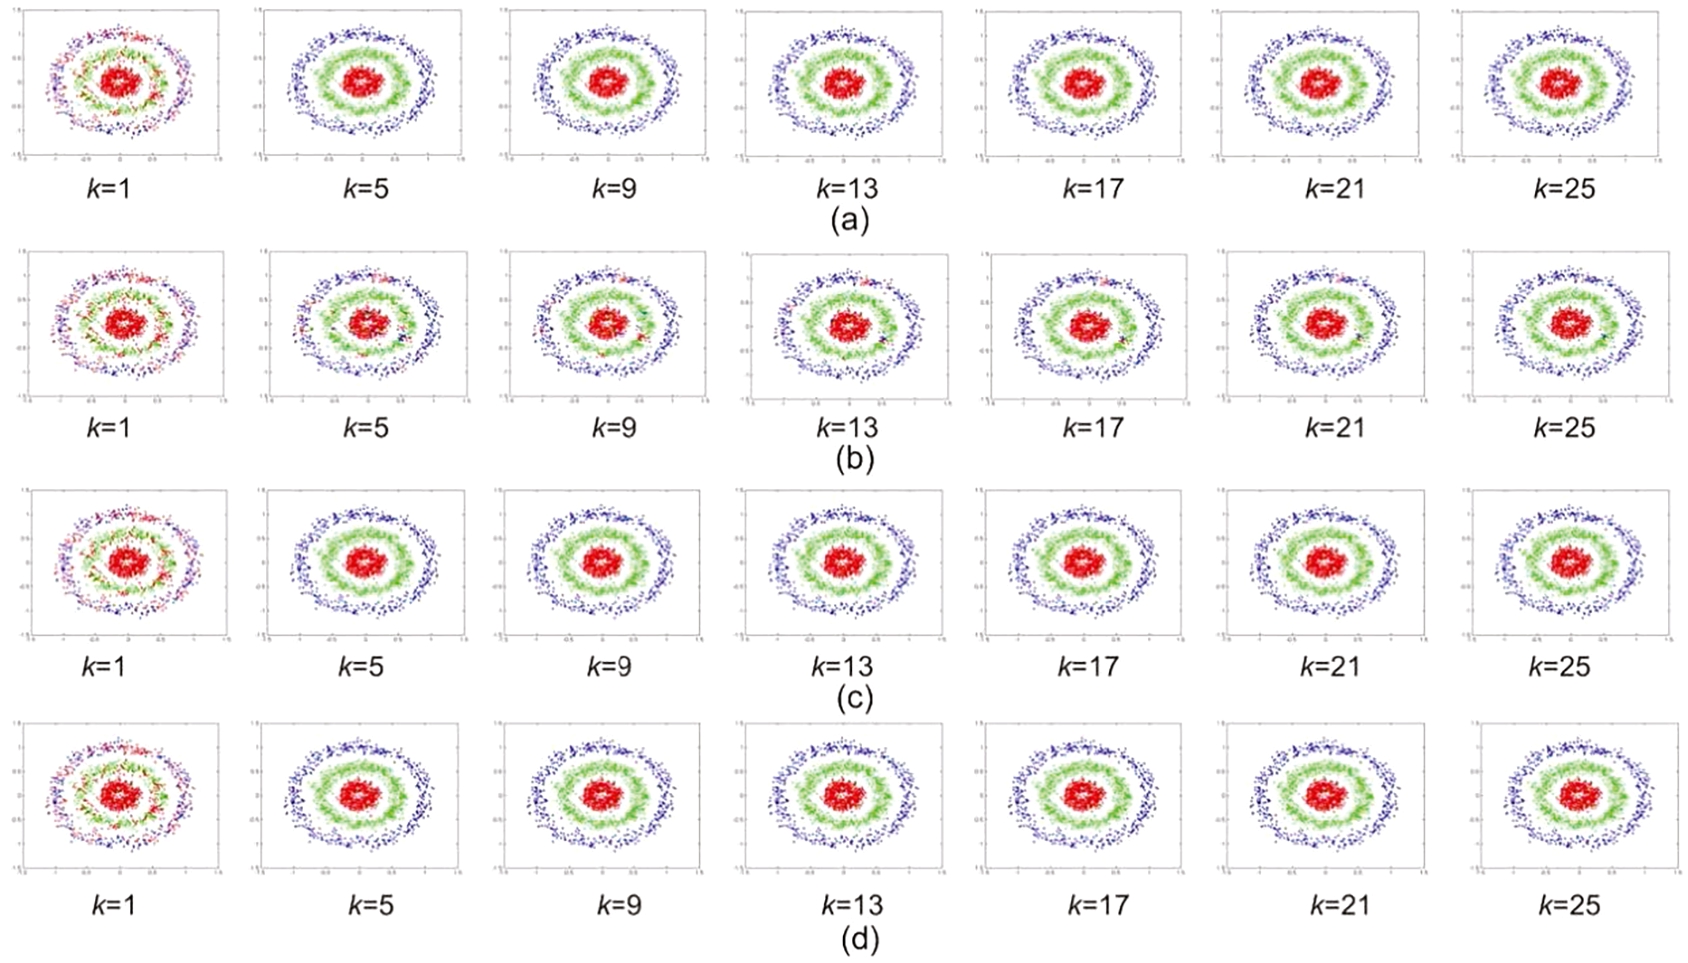
Performance comparison of the transductive classification methods on toy data by changing k from 1 to 25. (a) for TCPA, (b) for LL, (c) for Lap, (d) for NLap.)
First, in order to analyse the influence of the parameter k, a series of experiments are constructed. In this experiment, it is increased from 1 to 25.
In addition, to evaluate the performance of the proposed method on real world databases, the classification performances of these four methods with different values of k on six datasets are shown in Fig. 3. For these experiments, it can be observed that that on Princeton 3D Model, ORL Yale-B and PIE datasets, TCPA performs best on classification with varied values of k, and it can keep the ARs in the high and stable level. In Fig. 3(a), the classification performances of these four methods are quite similar on COIL-20 dataset. Additionally, in Fig. 3(f), when k is between 1 and 7, TCPA has surpassed other three methods on USPS dataset.
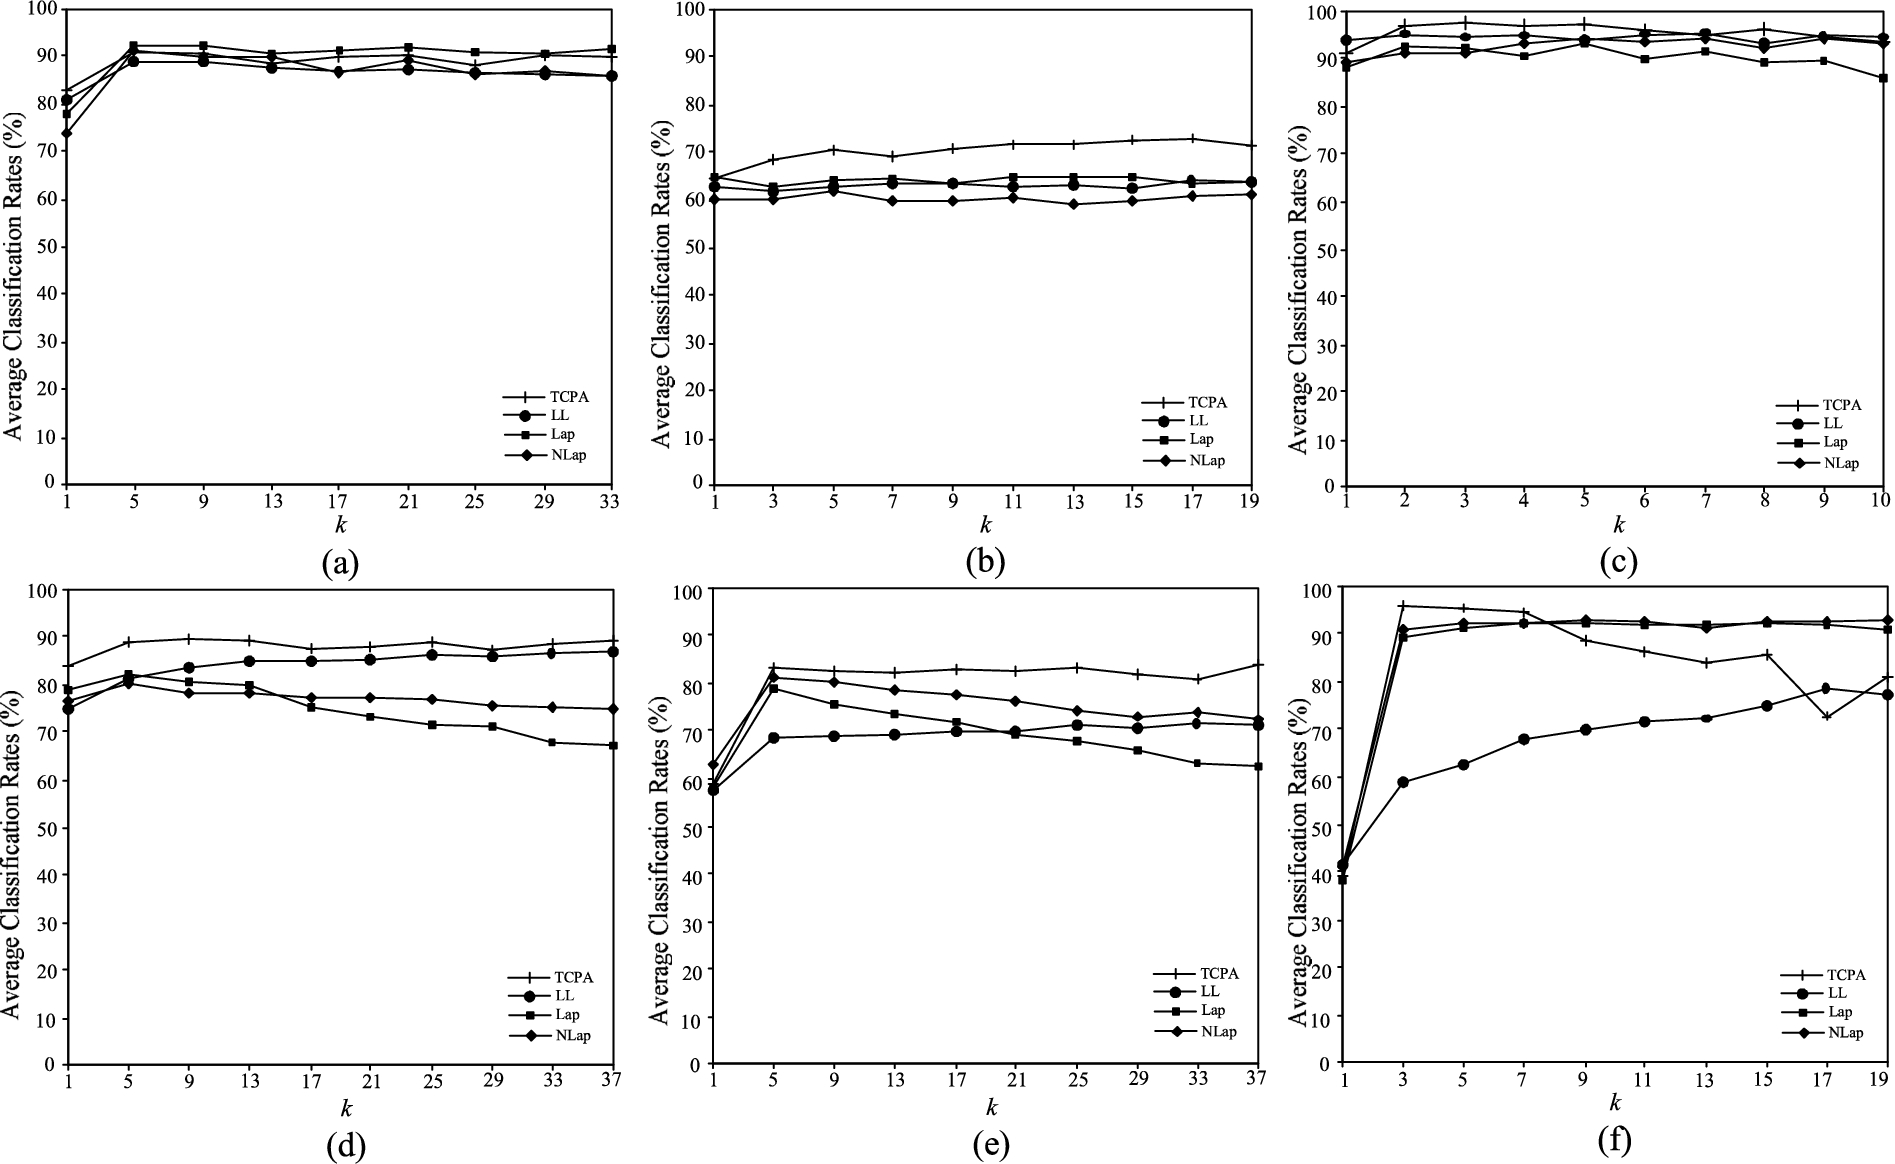
Performance comparison of the transductive classification methods on real world databases. This figure shows the ARs vs. parameter k variations (a) for COIL-20 (b) for Princeton 3D Model (c) for ORL (d) for Yale-B (e) for PIE (f) for USPS.
In order to discuss the influence of

Performance comparison of the transductive classification methods on toy data by changing
For real world data, the classification results of these four methods with different values are shown in Fig. 5. From the six subfigures in Fig. 5, it can be observed that the performance of TCPA and LL is more stable than Lap and NLap in a broad range of

Performance comparison of the transductive classification methods on real world databases. This figure shows the ARs vs. parameter
In experiment of l, two parameters k and

Performance comparison of the transductive classification methods on toy data by changing l from 1 to 181. (a) for TCPA, (b) for LL, (c) for Lap, (d) for NLap.
Similarly, Fig. 7 presents ARs versus the labeled samples l on real world databases. In Fig. 7(a), (b), (c) and (e), it can be seen that compared with other methods, TCPA performs best on the classification results in all cases. The ARs of TCPA keep increasing with the enlargement of the labeled samples. Another finding is in Fig. 7 (a), (b), (e) and (f), the ARs of LL’s are evidently lower than TCPA. This indicates that the process of patch alignment has the effect to strengthen TCPA’s performance on classification.

Performance comparison of the transductive classification methods on real world databases. This figure shows the ARs vs. parameter l variations (a) for COIL-20 (b) for Princeton 3D Model (c) for ORL (d) for Yale-B (e) for PIE (f) for USPS.
In summary, Fig. 4 shows that TCPA has stable performance influenced by parameter μ, while bandwidth parameter t has strong influence on the performance of Lap and NLap. In addition, the results presented in Fig. 7 show that TCPA has higher ARs than Lap and NLap in most cases. From these two points, it can be demonstrated that the local model used in TCPA is much better than the model used in Lap and NLap (Eq. (21) and Eq. (22)). To compare with LL, the results in Fig. 2, 4, 5, 6, and 7 show that TCPA performs more stably and accurately on classification. It can be demonstrated that the sum of all the local patch prediction errors (Eq. (12)) used in TCPA can assign the values more accurately than using single data to obtain local prediction error in LL.
Additionally, in these six subfigures of Fig. 7, it is obvious that the ARs of the three dimension reduction methods (LDA, PCA, LPP) are lower than the transductive classification algorithms. In PCA and LDA, the low dimensional space is constructed without considering the local geometry, so they cannot discover the nonlinear structure in high dimensional space. For LPP, though it also preserves the local geometry by using the Gaussian Laplacian, it is an unsupervised method. These reasons explain that they have lower performance in classification based on all the six real world databases compared with TCPA.
For G-TSVM, we have found that in Fig. 7(a), (f), it obtains the high ARs, but in Fig. 7(b), (c) and (e), its performance is similar with the dimension reduction methods. In Fig. 7(d), it even has the worst performance on ARs. It indicates that in comparison with TCPA, the G-TSVM has unstable performance on classifications.
In this paper, a novel transductive classification algorithm via patch alignment is proposed. This algorithm employs a linear transformation model to construct a local patch, which can predict the values of its neighboring data for each data, and adopts a unified objective function to align the local patches and learn the Laplacian matrix. The results of the experiments conducted on toy data and other six real world databases show that compared with the existing transductive classification algorithms (Lap, NLap, LL, G-TSVM), TCPA is not only having the high and stable performance on classifications, but also is insensitive to the parameters. On the other side, the experimental results show that the transductive classification algorithms outperform the three dimensional reduction methods (PCA, LDA, LPP) in general, since the transductive classification algorithms’ ability in classification have been enhanced by taking both the labeled and unlabeled data into account.
Footnotes
Acknowledgements
The authors would like to thank the anonymous reviewers for their valuable and insightful comments on an earlier version of this manuscript. This research was partially supported by JiangSu Collaborative Innovation Center for Building Energy Saving and Construction Technology Projects (No. SJXTBZ2110 and No. SJXTZD2103). It is also supported by the Xuzhou industrial key technology research & development projects (No. KC21108 and No. KC21335).