
Abstract
The continuous both indoor and outdoor location of subjects is an essential capability within AAL systems. It enables adaptive and context-aware behavior within the services implemented. In AAL systems, location information has been managed in a simplistic way until now: i.e. it refers either to specific rooms or concrete
Keywords
Introduction
Indoor location technology [25] has received a considerable attention from both academia and private companies during the last years. Position of devices and users is a capital piece of information in Context Aware Computing [14], thus it is crucial within the Ambient Assisted Living (AAL) domain. Technology like GPS (Global Location System) and A-GPS already provide a solution outdoors. However, due to the distortion of GPS signals indoors, location error significantly increases there. In consequence, alternative solutions are needed.
One of the most prominent technologies for indoor location is the so called 802.11 (WiFi) fingerprinting (WFP). The basic idea is simple yet powerful and it rests on the assumption that 802.11 signals are virtually ubiquitous nowadays and require that the element being located comes equipped with a 802.11 interface. Given that the 802.11 signal degrades with distance and obstacles, the vector compound by signal strength of the different 802.11 devices perceived at a given point can be used as a reference to locate devices at the same point the vector was created at. This technology needs a site survey phase in which a number of such vectors gathered in specific locations, labeled with the location, are stored in a data base. This data is then used to create a location function, mapping observed vectors to locations.
This technology presents two variants depending on which device measures signal strength. In the first variant there exists a set of 802.11 dedicated hardware elements deployed at the indoor space in charge of registering signal strength of the devices being located. Usually, such hardware gives wireless connection to a network as well meanwhile generating information for location. In the second variant the device being located measures signal strength from the 802.11 fixed devices (i.e. WiFi routers) acting as landmarks. For both variants, the location function produces the final location. We will refer to the later variant as infrastructureless WFP (IWFP) emphasizing the fact that no dedicated 802.11 infrastructure is needed to deploy a location service.
Regarding the application of WFP for positioning in AAL environments, it is of interest to state possible requirements and how WFP matches them. As this technology locates 802.11 devices, it is applicable to locate persons wearing a device (e.g. a smart watch) or mobile things of interest for the subject of AAL environment (e.g. door keys, smartphone, a companion robot). Also, AAL systems are not critical in the location dimension, i.e. they can tolerate location errors to some extent. And this is important as WFP’s output as a location service bears a measurable error. Cost is also important in AAL systems when it comes to systems installed at home. The first variant of WFP considered in the former paragraph required dedicated hardware. However, the IWFP variant can use WiFi routers distributed through the environment (e.g. from neighbours or companies nearby). Thus, in principle IWFP has more applicability in AAL. Thus, in this paper, we focus our attention on IWFP.
This work intends to make advances in three different directions. The first direction is related with the specific techniques used to create the mapping mechanism from signal strength vectors to device locations. As the error generated by the generalization process used when predicting the device’s position should be optimized, we support the argument that ensembles (i.e. a technique based on the combination of multiple basic location functions) are a powerful way to reduce it. The second one, we call it hybridization, refers directly to the integration of two different definitions of the location concept. WFP understand location information as a label (e.g. the living room, the kitchen) or as a pair of coordinates in
The rest of the paper is organized as follows. Some related works are revised in Section 2. Section 3 outlines the basic ideas behind the methodology followed in this work. Section 4 applies the different steps of the methodology to a specific AAL environment. Finally, Section 5 presents the conclusions and future works.
Related work
In WFP, the creation of a location model is the process of, starting from the data base of signal strength vectors obtained with a data survey, obtaining a location function as a mapping between signal strength vectors and locations. Let us denote such database as
Probably the most common regression technique employed in indoor location is neural networks [28]. One of the first proposals is [36] dated back to the year 2000. Since then, many other works appeared using the same technique. [3] uses a feedforward network as
Overview of related works results. The Machine Learning (ML) techniques are: (DT, decision trees), (BAY, bayesian networks), (FZZ, fuzzy algorithms), (k-NN, k nearest neighbours algorithms), (BAG, bagging), (SVM, support vector machine), (ANN, artificial neural networks), (RBF, radial basis networks)
Overview of related works results. The Machine Learning (ML) techniques are: (DT, decision trees), (BAY, bayesian networks), (FZZ, fuzzy algorithms), (k-NN, k nearest neighbours algorithms), (BAG, bagging), (SVM, support vector machine), (ANN, artificial neural networks), (RBF, radial basis networks)
The k-NN technique is widely used in this domain, probably for its conceptual simplicity and immediate implementation. Bahl et al. [2] proposed k-NN to improve the results of signal propagation models. Many others have followed the same path [18,24,34]. The works of Ross et al. [31] and Honkavirta et al. [23] compare the performance of the k-NN algorithm with some probabilistic approaches. Gown et al. combine WiFi with Bluetooth by sensor fusion [22], using k-NN as localization algorithm. Examples of other Machine Learning techniques for CBILS are decision trees [1,9,40] and Radial Basis Function Networks [26].
Classification techniques in the field of indoor location are less common. Castro et al. [8] use a Bayesian network (BN) for ZBILS. Depending on room size, number of adjacent rooms and other factors, the system achieves different levels of accuracy. Elnahrawy et al. [15] also use a BN and compare it with a number of well known indoor location systems, e.g. RADAR [2]. Saha et al. [32] use ANNs and k-NN as classifiers, concluding that the achieved accuracy depends on the relative distance among calibration points and on the number of APs used. Other examples of ZBILS are [33] for k-NN, [7,38] for Support Vector Machines and Garcia-Valverde et al. [21] for a fuzzy rules based classifier. This last one presents the novelty of online learning and adaptation through time allowing the system to maintain the accuracy when the environmental conditions change.
Regarding the combination of ZBILS and CBILS, we have found only the work of Brunato et al. [7] proposing Support Vector Machines [12] for CBILS and its classification variant for ZBILS. However, they do not consider their combination in a single service merging different location information granularities.
Most of the techniques reviewed so far were evaluated in terms of the error incurred when locating mobile entities. However, as it can be seen in Table 1, the error’s difference for the best techniques is not significant, at least within the AAL context.
In our opinion, to make the difference over other indoor location systems is necessary to propose different approaches beyond the machine learning employed. These approaches could affect the pre-process or post-process of the techniques. The main novelty of our work is the proposal of a hybrid schema of classification and regression in the same building. Depending of the characteristics of every room or zone, our indoor location system can only predict the room where the user is, or whether this room meets certain requisites, the system is able to detect the concrete location of the user inside the room. Another novelty presented by our work is the use of ensemble techniques to improve the results obtained by machine learning techniques. The application of ensembles to improve classification techniques in the field of indoor location is a relatively new topic in the literature, some recent works from 2013 are beginning to apply them, e.g. the work of Trawinsky et al. [37]. They apply bagging to the outputs of two different classifiers, a decision tree and a fuzzy rule-based classification system. The results with bagging outperforms those achieved by the classifiers individually.
This section briefly presents the steps to create and deploy the Hybrid indoor location system. The nine steps of the methodology appear graphically represented in Fig. 1.
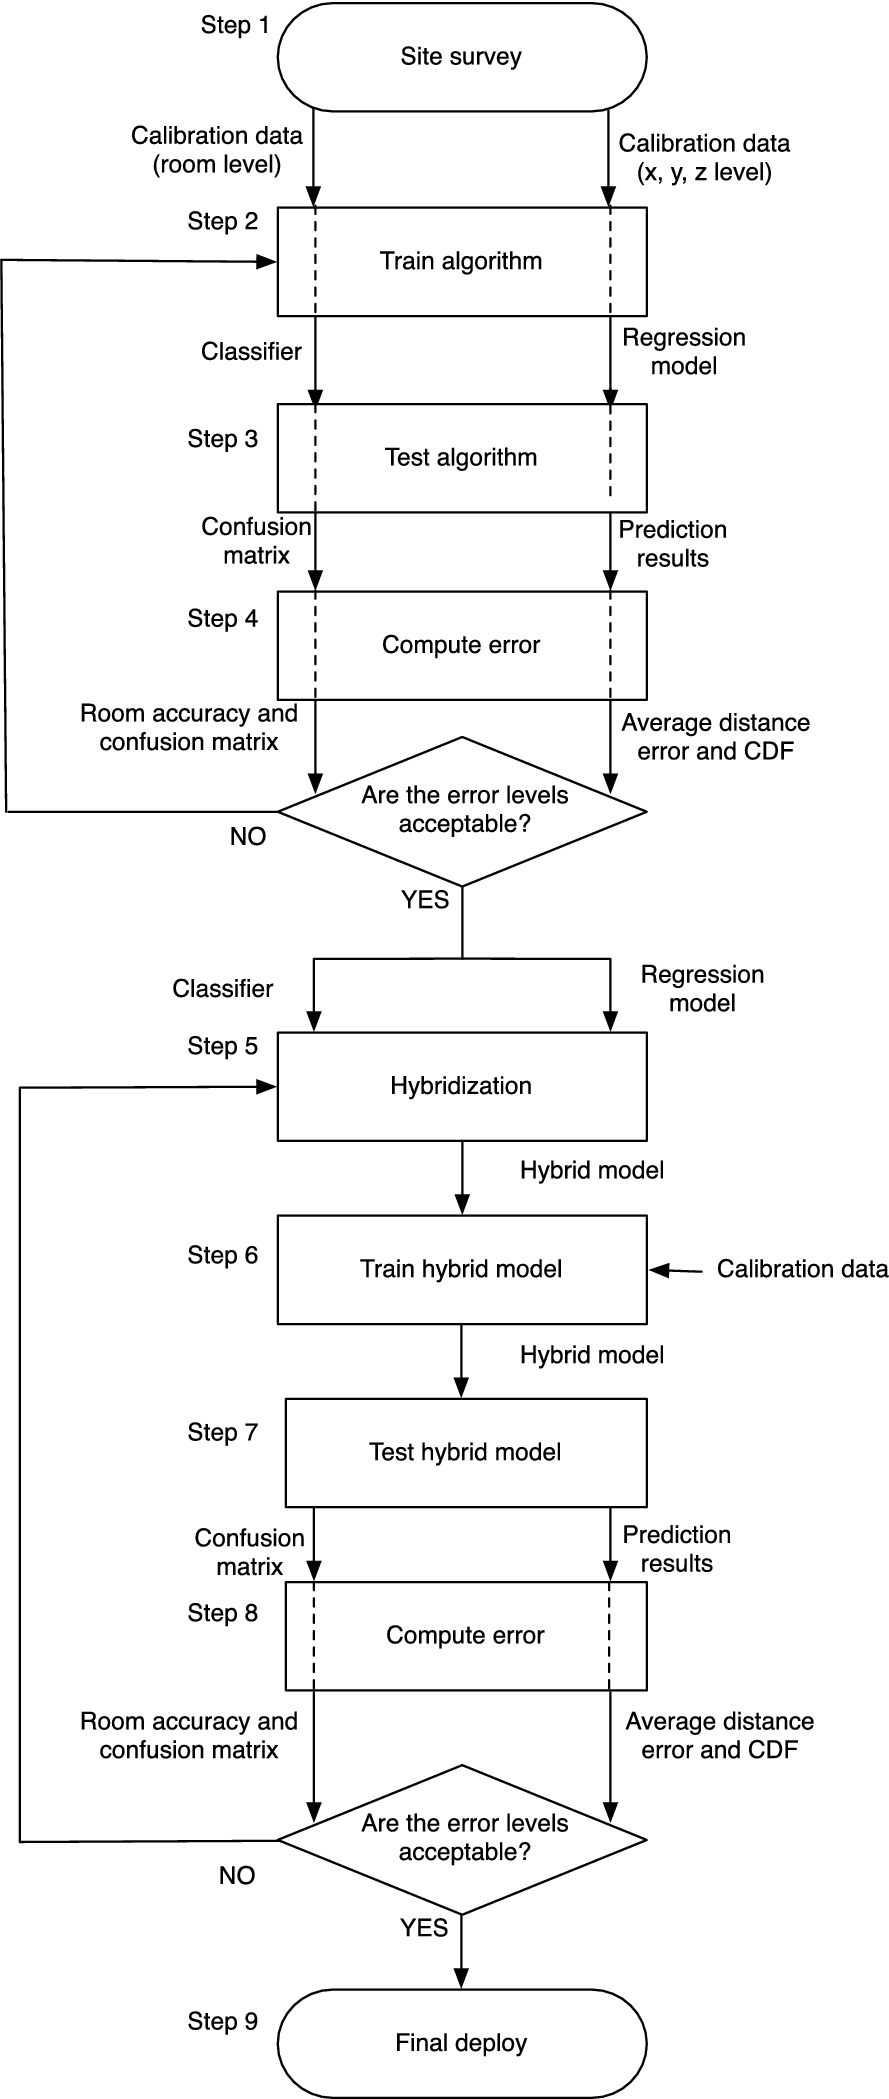
Steps to create and deploy an indoor location service. Notice that the graphical representation for steps 2, 3 and 4 abuses notation to briefly represent that the three steps can be performed through only one of the two threads (i.e. classification or regression).
Firstly, a site survey (step 1) is performed in the building where the indoor location system it is going to be deployed. A site survey phase is needed to obtain the
Regarding CBILS site survey, an imaginary grid of calibration points must be designed over the indoor zone. Calibration points are appropriately located within the center of 2×2 metre tiles. A distance of 2 meters was chosen after reviewing the literature as most of the related works reach mean distance errors around 2 meters. Data gathering must be, and every point during 2 minutes and 7 days.
The case for ZBILS is simpler as no grid of calibration points is required. Instead, the operator should move freely through the space, taking into account that it must spend 2 minutes per zone.
Once step 1 is done, what we get is
Step 3 consists on training the machine learning model. Using the training data set obtained in the previous step, a supervised machine learning model is trained to be used as location function. This step is generic so any supervised machine learning technique could be used (see Section 2).
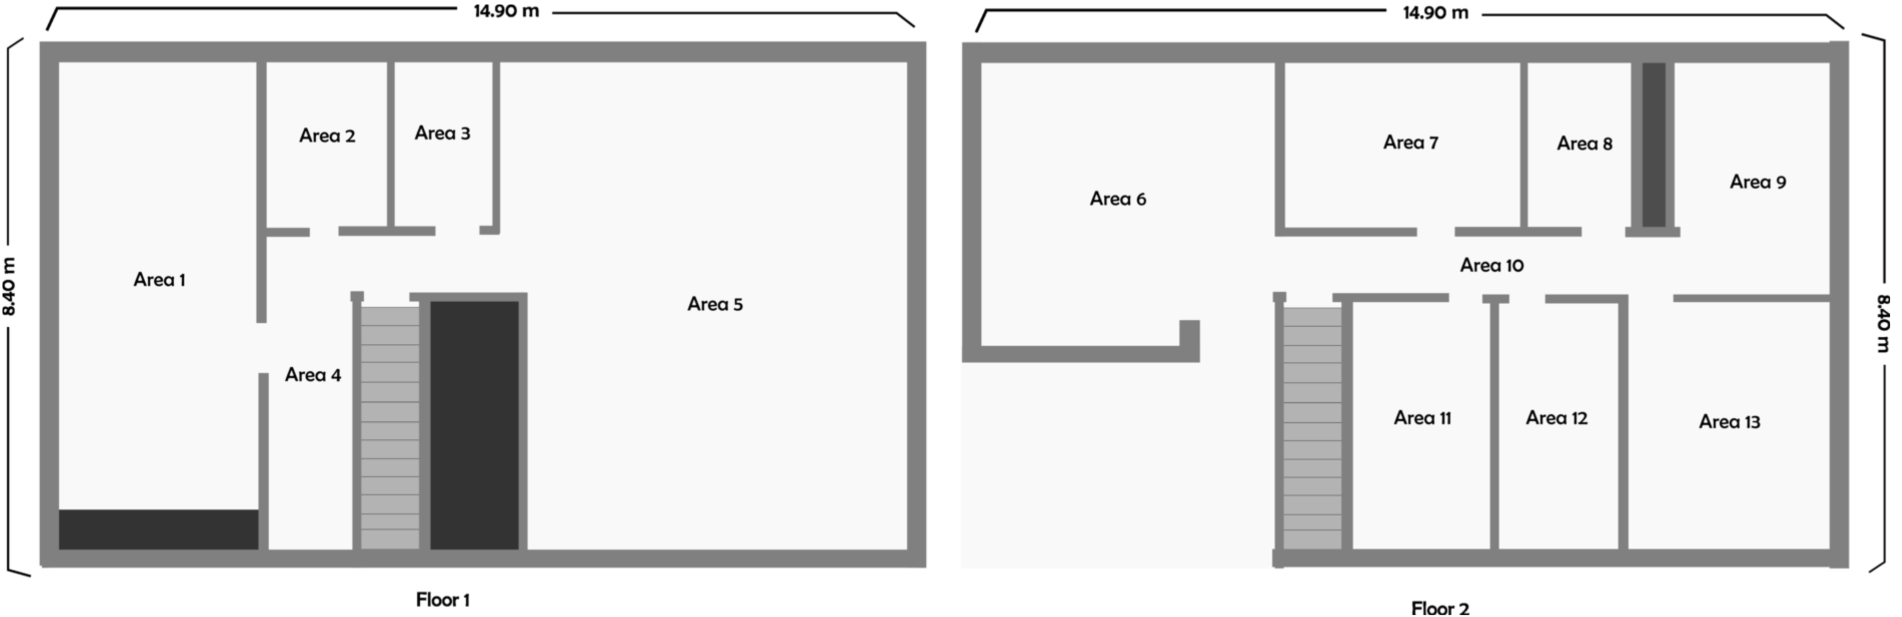
Layout of the two stories home.
Once the obtained the best possible model given the Machine Learning technique at hand, it must be tested in step 4 to prove if the results obtained with the model are sufficiently accurate. Then using the validation dataset as input for the trained model, the model generates a list of inputs which must be compared with the original outputs of the validation dataset. In case of a classification technique, a confusion matrix is generated. A confusion matrix M allows to visualize the performance of a classification algorithm. The value
Meanwhile, for a regression technique, the error e is a distance in meters calculated as follows.
After Step 4 is finished, it is necessary to check if the accuracy of the algorithm is sufficiently good to be proven in a real environment. The developer must consider if the results achieved in step 4 could cover the necessities of the application which the indoor location system will be applied. In the results are good enough, then the machine learning model is selected. Then the hybridization process to combine both ZBILS and CBILS follows. Again, the steps are similar as those in steps 2, 3 and 4. See Section 4.3 for a detailed explanation.
This section illustrates how to apply and validate the technology proposed in this paper to a typical AAL scenario: a real two stories house located in a residential area of Murcia. Figure 2 shows the house’s layout.
This section’s purpose is threefold. Firstly, it delivers empirical evidence about the dominance of the Random Forest [6] machine learning technique over BNs (see Section 4.1) when it comes to ZBILS. This conclusion is important as Bayesian Networks was the technique of choice in many of the papers reviewed and it actually produced good results.
Secondly, it will show how to create a CIBLS with neural networks through a careful treatment of the learning process (see Section 4.2). In the experiments performed, the model obtained outperforms the rest of CBILS systems reviewed. And last but not least, we will illustrate how to combine a CIBLS with a ZIBLS to construct a hybrid solution capable of mixing coordinates and zone location depending on user requirements (see Section 4.3).
ZBILS within an AAL scenario
A BN [10,11] is a model of probabilistic dependency between variables. In regard to WFP location, such variables are all continuous (RSSI values) but one (labels representing the rooms of the building). The BN learning process is supervised. During the training phase, the model can learn the probabilistic dependencies which exist between the input and output variables. Among all the possible probabilistic dependencies, it is necessary to find a network structure that minimize the classification error (i.e. in this case maximizes the accuracy of the ZBILS). Once the network is trained and validated, it can be used to generate the probability for a mobile device to be a specific room, depending of the RSSI values obtained from it. Each time the learnt BN receives a set of RSSI values from the mobile device, it returns a probability for each possible room. Locating the mobile device is a matter of choosing the room whose probability is the max one.
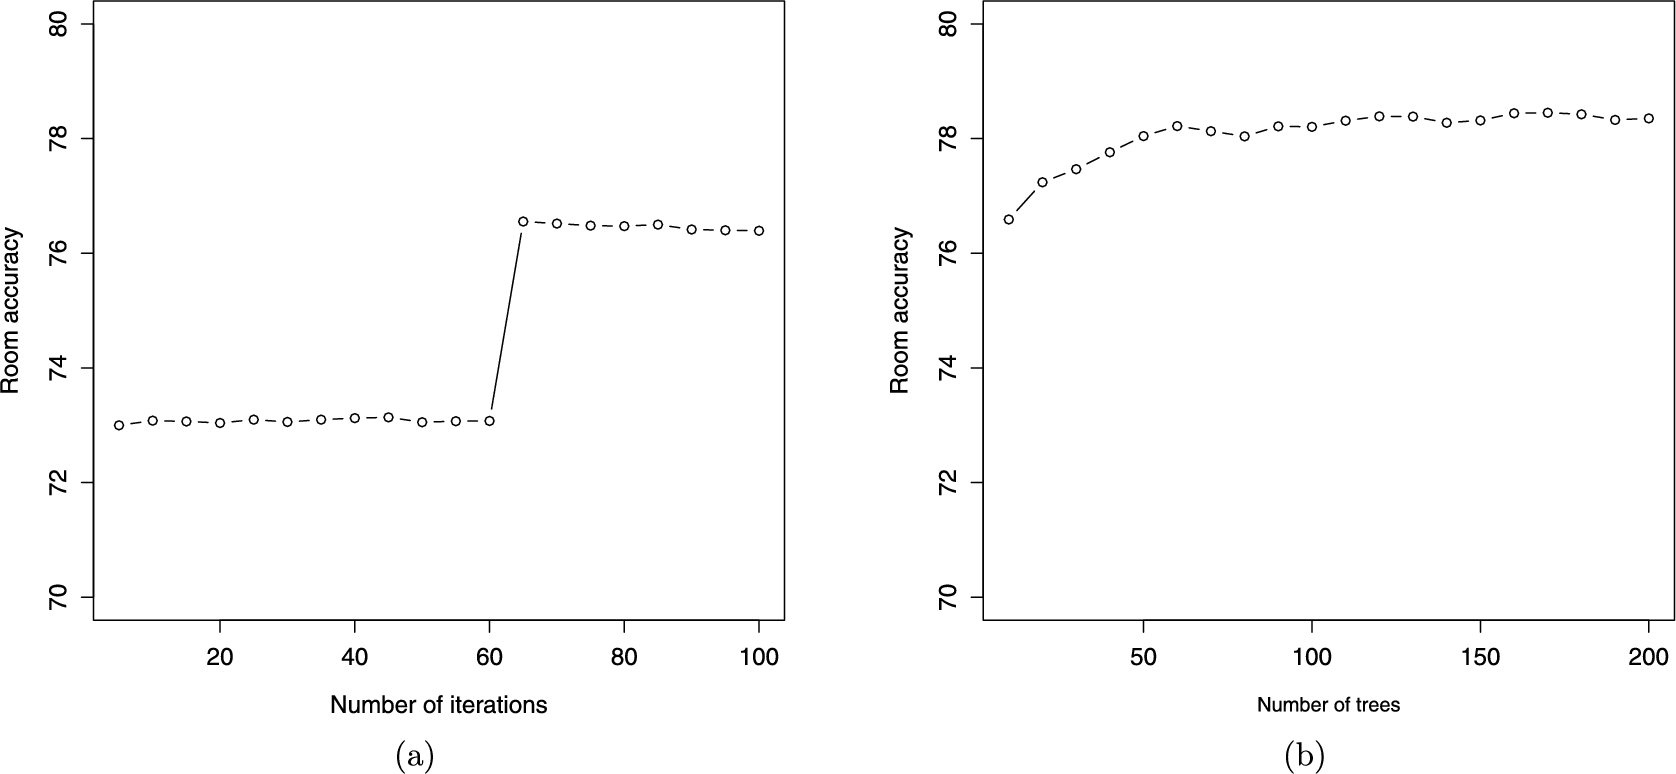
(a) Evolution of Bagging based classifier’s accuracy with the number of iterations. (b) Evolution of Random Forest based classifier’s accuracy depending of the number of trees generated.
In this paper, we wanted to go further than using stand alone Machine Learning techniques by applying ensembles. Ensembles are meta-techniques, in the sense that they work using stand alone Machine Learning techniques as basic building blocks to create more complex models, the ensembles. The most well known ensemble based techniques are Boosting [19], Bagging [5] and Random Forests [6]. Regarding boosting, we have used AdaBoost [20]. This algorithm focuses on examples that are the hardest to classify correctly (i.e. RSSI lectures which can lead to different locations). As a consequence, the overall accuracy of the algorithm will be improved. The results achieved with AdaBoost in our experiment over the Bayesian Network with Tabu Search was slightly better, a 0.14% of improvement after 5 iterations. Bagging (Bootstrap aggregating) is an ensemble based technique. Bagging is a meta-algorithm able to improve the results of weak classification algorithms, combining the classifications of randomly generated training sets. After using the Bagging algorithm with the BN used in this paper, the results obtained in this experiment has not improved the results of the Bayesian Network with Tabu Search. It actually behaved as expected as BayesNet is not precisely a weak algorithm. Random Forests work generating a set of decision trees at training time, using to construct each tree a random subsec of the predictor variables (i.e. a subset of the APs in this case). The different outputs of each tree for the same unlabeled example are aggregated using a voting strategy. The most repeated location is the one selected. This experiment tries all of them.
The models produced by all the techniques mentioned above are validated by using always the last day of the calibration process for testing. As we mentioned, the outcome of such a test can be represented as a confusion matrix Based on a CM structure, the accuracy,
To work with BNs we use Weka software, and the
However, Random Forests clearly outperformed the rest of approaches. Figure 3(b) shows the accuracy evolution for different number of trees. With 170 trees, the accuracy is 78.45%, i.e. 5.39% better than the original Bayesian Network approach and 1.9% better than the Bagging approach.
In this step, we are concerned with location users at any point
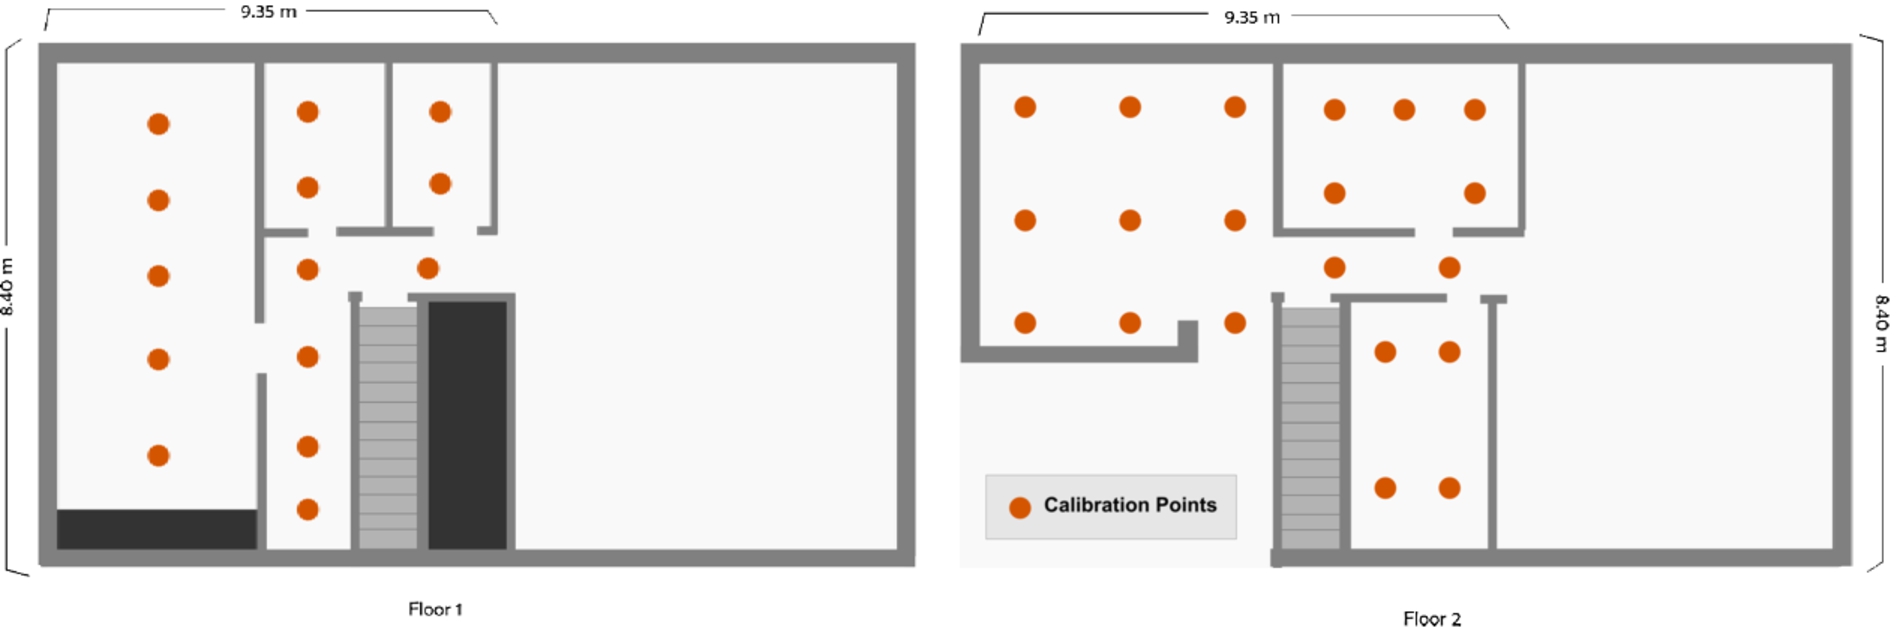
Situation of the calibration points grid over the two stories house.
Notice that creating a regression model to locate in
We relay on the generalization power of the Machine Learning models when we assume that calibrating in concrete points of the room is sufficient to provide a position estimate for any point of the room. The first step of the experiment consists of the subdivision of a concrete room in calibration points. The calibration process is very similar to that performed for the entire house for classification purposes. But in this case, rooms must be atomized into subzones. The accuracy we will obtain is inversely proportional to the size of the subzones. The smaller the zones are, a greater granularity will be achieved. However, atomizing a room into very small zones has a disadvantage: more time has to be devoted to calibration.
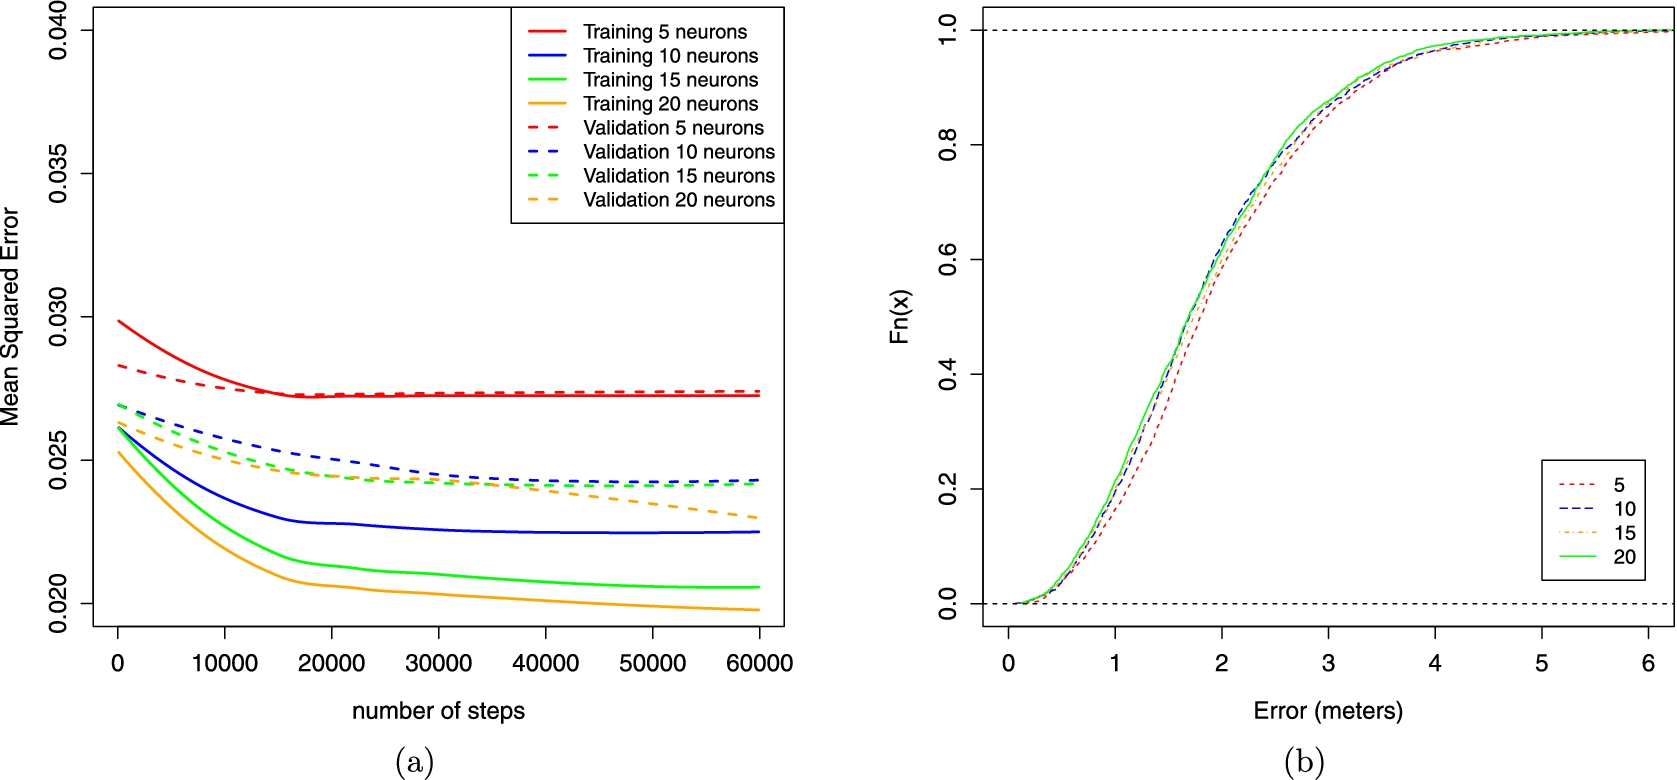
(a) Evolution of training and test error during learning for each MLP configuration (i.e. 5, 10, 15 and 20 hidden neurons). (b) CDF of the MLP whose learning process were stopped at the best test error (5, 10, 15 and 20 hidden neurons).
We subdivide the room in zones of 2×2 meters. We have selected 2 meters as a reference value because after reviewing the literature, the majority of related works obtain error values which are very close to 2 meters. It is actually very difficult to achieve a better error than that. Thus, such subdivision is a good trade-off between size and error. Thus, an imaginary grid of calibration points is layered on the indoor space at equal constant distance between contiguous points (see Fig. 4). The rest of the process for creating the location service remains the same: data must be gathered for each calibration point, and labeled with the corresponding two
We have subdivided the house in two zones, see Fig 4. All the rooms inside this zone were also subdivided in 34 calibration points. In this case, the site survey performed at every calibration point lasted one minute, a total of 34 minutes per day. Notice that we are considering two floors, i.e. the service will actually locate in
We decide to use an ANN for creating the regression model as they show good results. This particular ANN uses is a single hidden layer feed forward network of sigmoidal perceptrons (i.e. a multi-layer perceptron MLP). It has 7 inputs, as only 7 APs are detected at this building. The network has 3 output variables, representing the coordinates x, y and z. Note that the z output will be a numeric value in meters indicating the floor where the user is (i.e. a value of 1 in the ground floor and 4 in the first floor). The calibration data is composed of 5 days, subdivided in the first 4 days for training (8195 examples) and the last day for validation purposes (2095 examples).
Figure 5(a) shows the curves of training and generalization of the ANN. The best average error was achieved with the 20 hidden neurons approach, 1.83 meters. All the results of average, maximum and minimum error are shown in Table 2. Figure 5(b) shows the average error CDF for all the configurations, i.e. 5, 10, 15 and 20 hidden neurons.
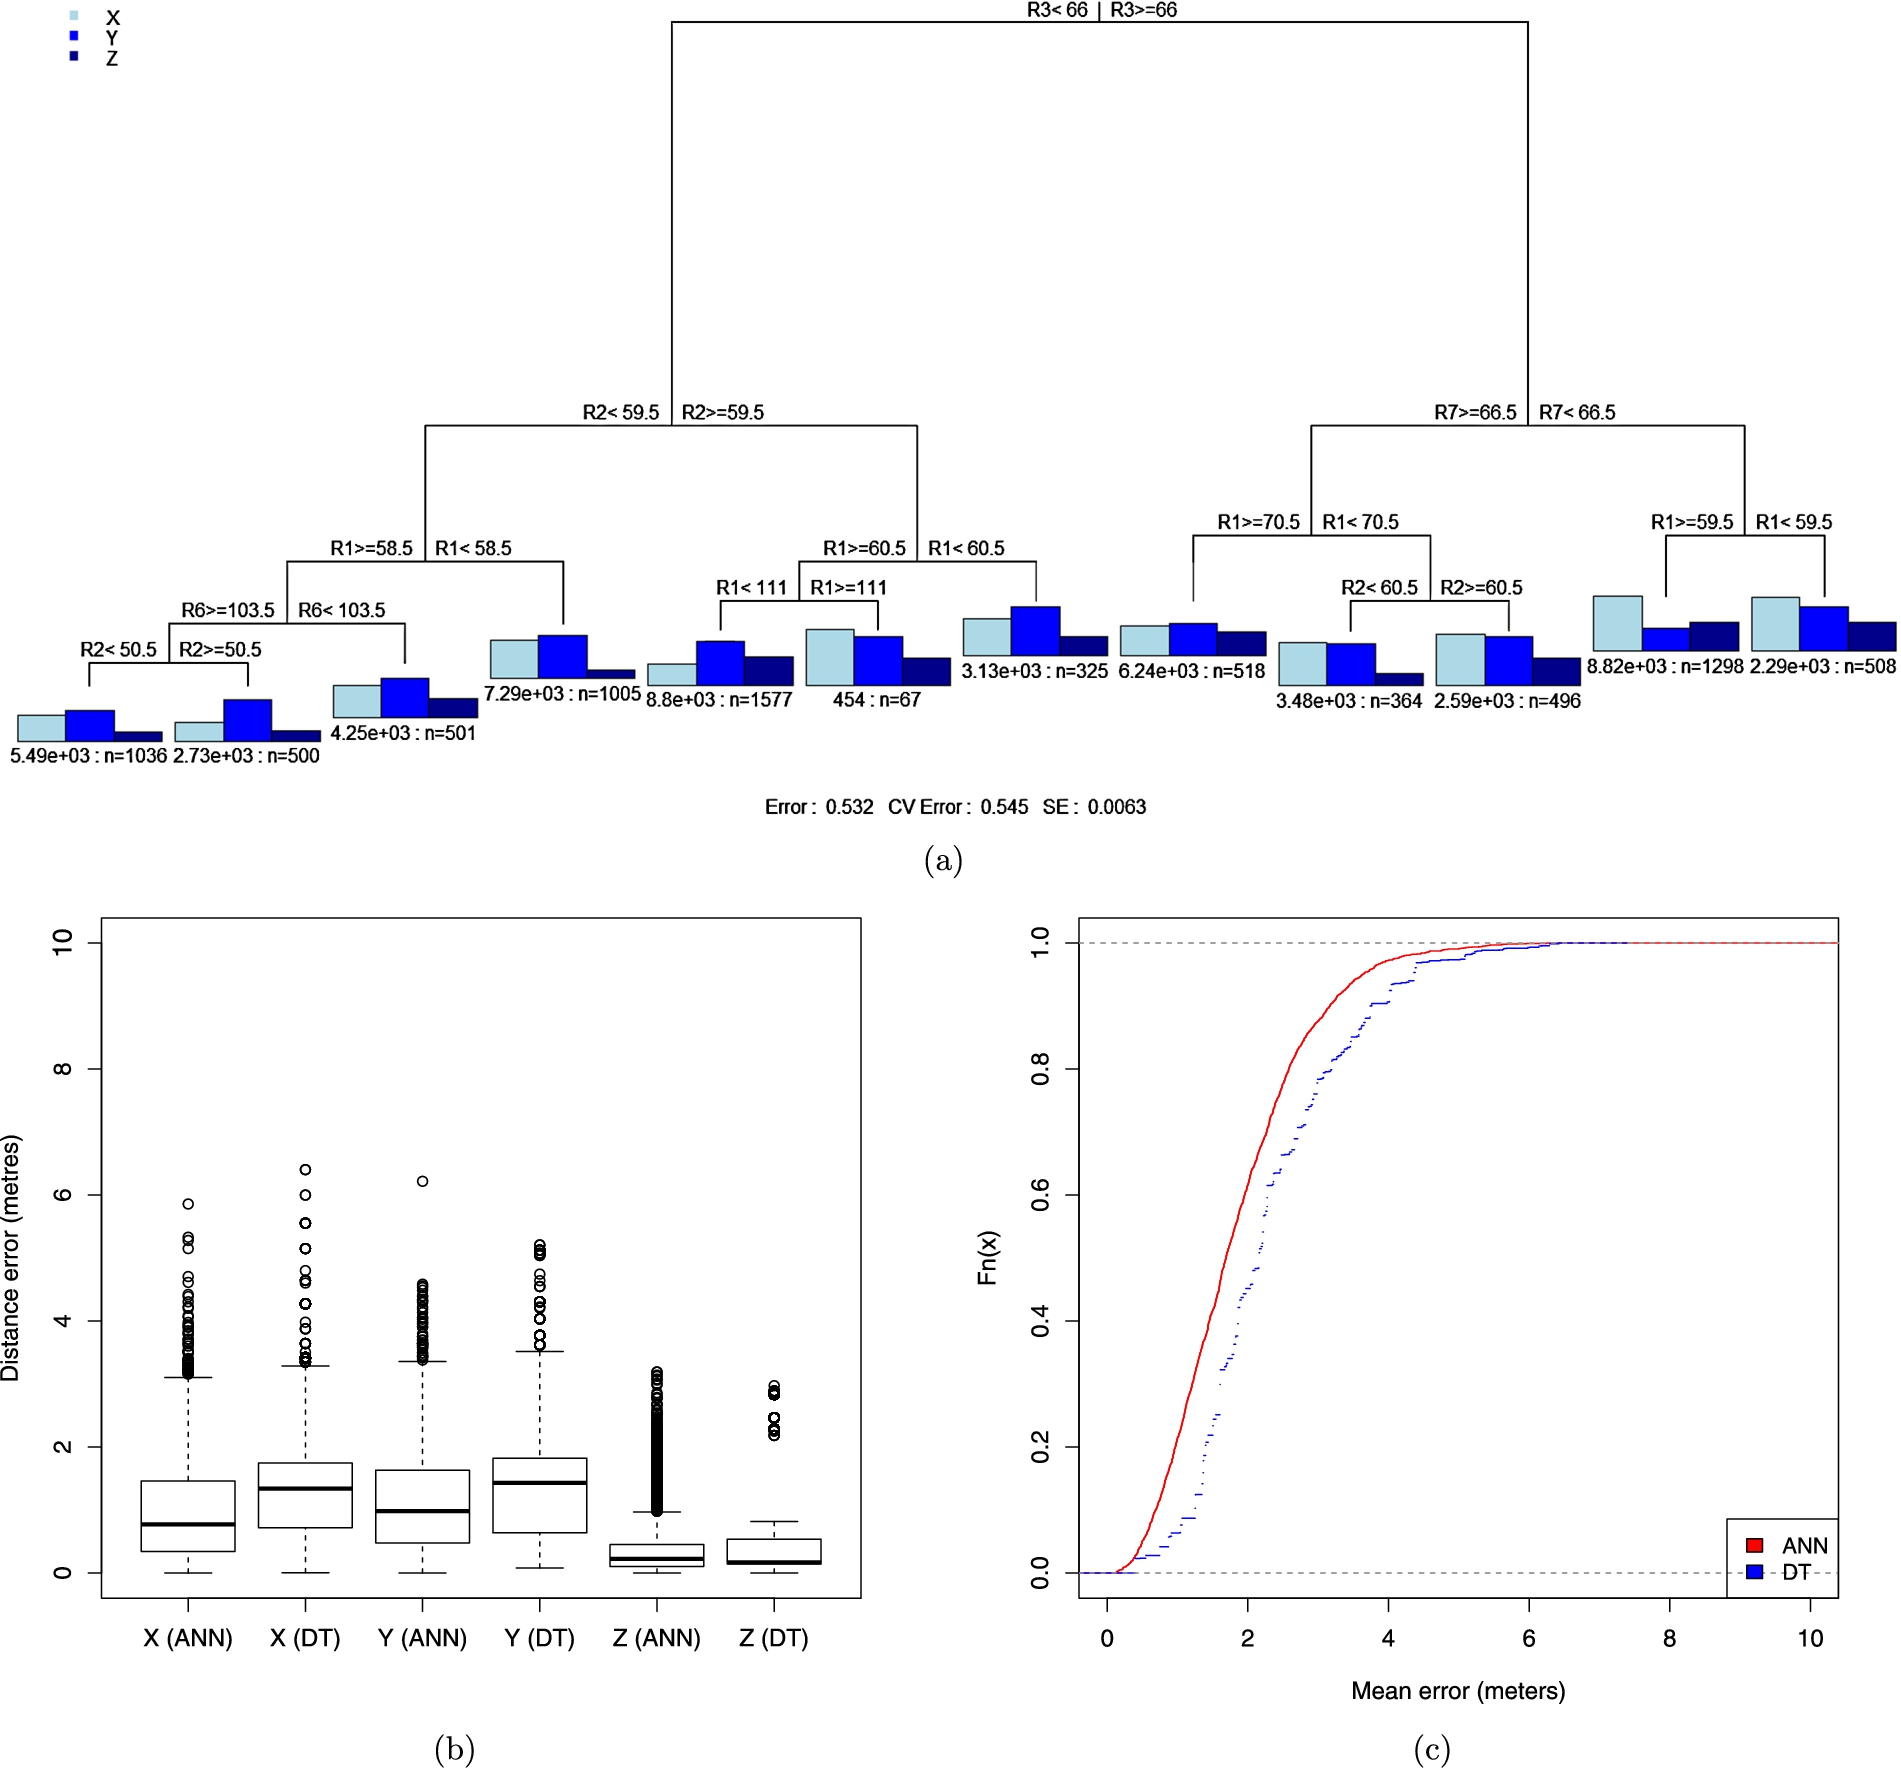
(a) Resulting decision tree. (b) Whisker-Plot diagram showing the error of the 2 output variables. (c) CDF of average error of the best ANN and the best regression tree.
The regression tree model created in this experiment has 7 input variables and 3 output variables. The best average error achieved with this model is 2.31 meters. Table 3 contains the average, maximum and minimum error for two different configurations of regression tree. The default tree and the best one. The resulting best decision tree is shown in Fig. 6(a). Figure 6(b) compares the outputs of the best regression tree and the best ANN by Whisker-Plot diagrams. Meanwhile, Fig. 6(c) characterizes their average errors in terms of Cumulative Distribution Function (CDF).
The technique which obtains better location results is the MLP.
Results on Resilient Backpropagation over a single hidden layer feed forward sigmoidal perceptron
Results on Resilient Backpropagation over a single hidden layer feed forward sigmoidal perceptron
Distance error for decision trees
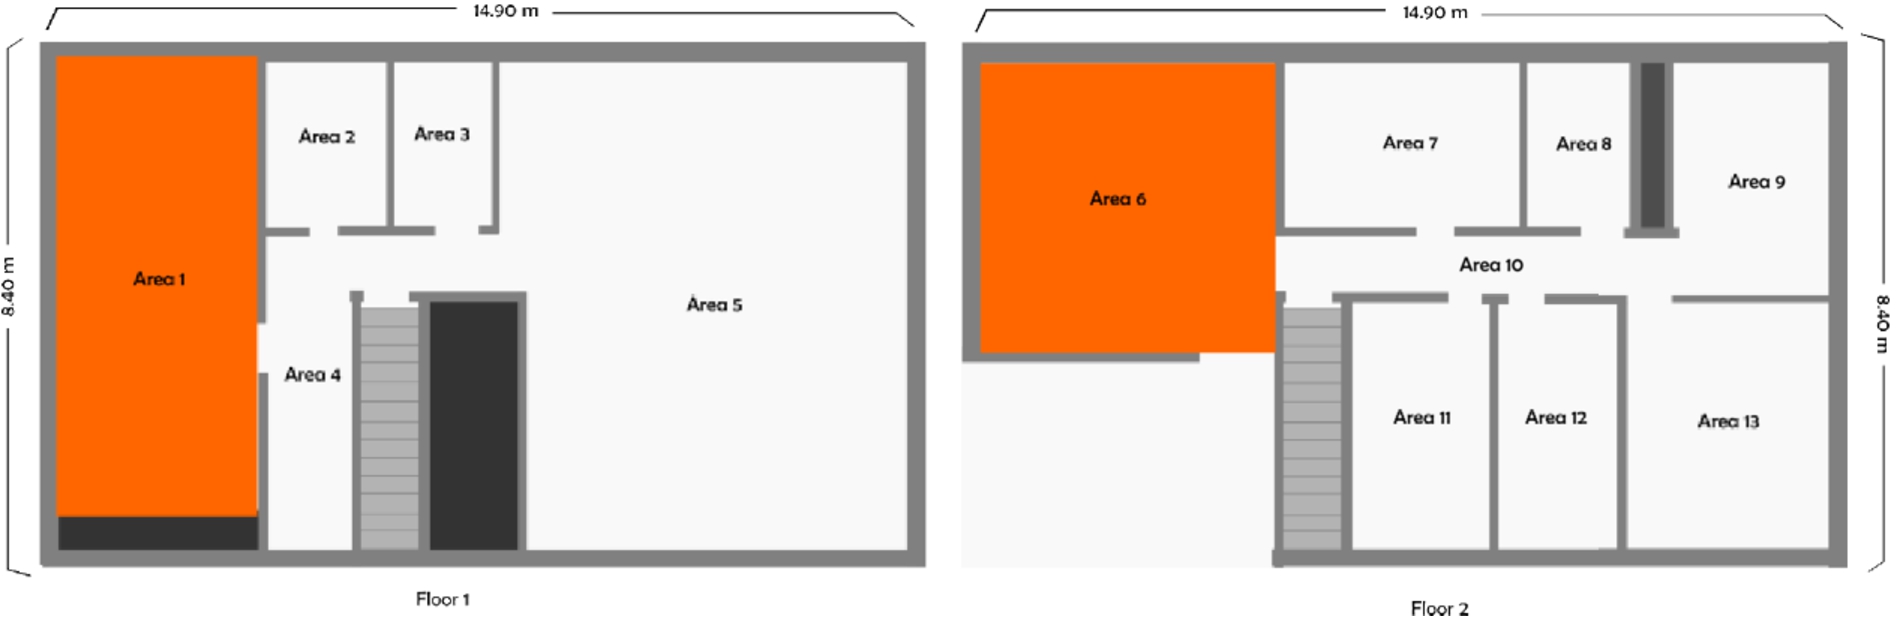
Layout for testing the two hybridization strategies. In dark, rooms with
We have defined two different strategies for merging. The first one is based on the generation of a ZBILS, L, for the whole house, i.e. all rooms in
The second approach consists on a meta-classifier
Accuracy and average, maximum and minimum errors for the two hybridization strategies
The main disadvantage of the first strategy arises when there is a high number of rooms requiring
To perform experiments with both approaches, we have employed the house environment of Fig. 7. It shows in dark the two rooms of the set
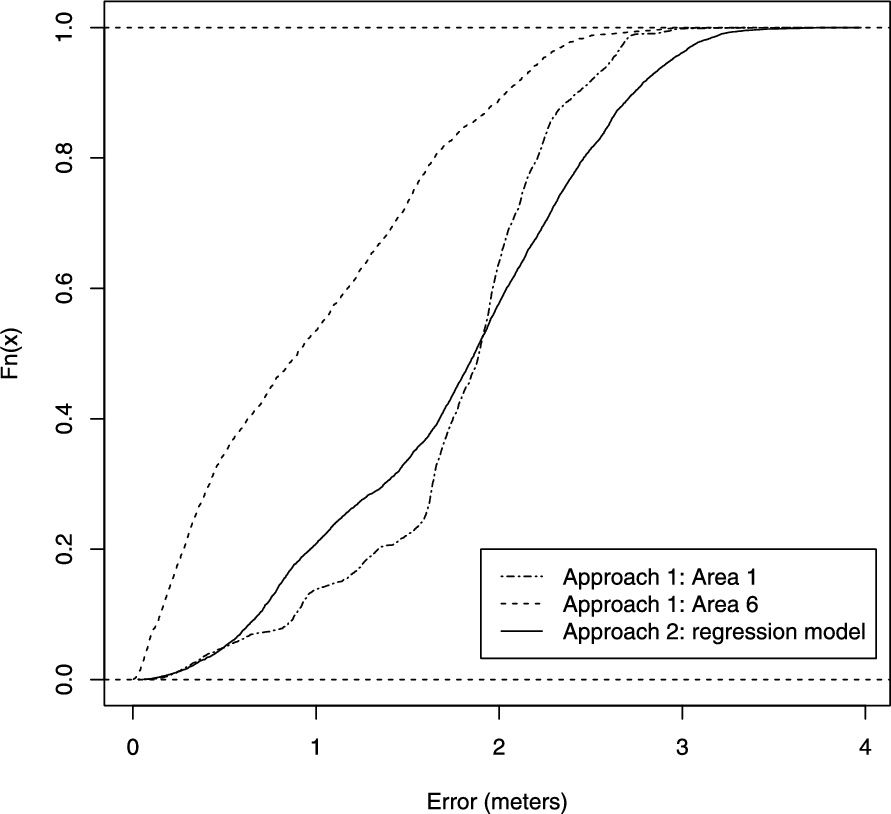
CDF of the MLPs of the two hybrid approaches.
Considering the results obtained and the advantages and disadvantages of every approach previously exposed, our suggestion is that depending of the necessities of the application which is going to use the location engine, the developer must choose one of the two approaches. The first approach could be preferred in buildings where a few rooms need
This paper presents an approach to deal with different location service types in the same location. We have seen that this can perfectly be the case within the AAL domain. The paper presents how to set up the CBILS and the ZBILS depending on the particular necessities at home and how to produce the hybrid model in charge of merging both services. It includes different criteria that can be used in order to select the two different strategies for the hybrid location service. But most important, it shows how to assess the performance of the service before deciding whether to deploy it in production mode. As a way of example, ANNs and Random Forest have been used as the techniques to construct the location services but this work does not put the emphasis in producing models to outperform other former works but in how to use them.
Future works will advance in the direction of measuring the level of degradation of the service in real homes in order to more precisely quantify the cost of maintaining the service. In consequence, business models capable of delivering a profitable and quality AAL service must be defined.