
Abstract
The public health implications of growing numbers of older adults at risk for dementia places pressure on identifying dementia at its earliest stages so as to develop proactive management plans. The prodromal dementia phase commonly identified as mild cognitive impairment is an important target for this early detection of impending dementia amenable to treatment. In this paper, we propose a method for home-based automatic detection of mild cognitive impairment in older adults through continuous monitoring via unobtrusive sensing technologies. Our method is composed of two main stages: a training stage and a test stage. For training, room activity distributions are estimated for each subject using a time frame of ω weeks, and then affinity propagation is employed to cluster the activity distributions and to extract exemplars to represent the different emerging clusters. For testing, room activity distributions belonging to a test subject with unknown cognitive status are compared to the extracted exemplars and get assigned the labels of the exemplars that result in the smallest normalized Kullbak–Leibler divergence. The labels of the activity distributions are then used to determine the cognitive status of the test subject. Using the sensor and clinical data pertaining to 85 homes with single occupants, we were able to automatically detect mild cognitive impairment in older adults with an
Keywords
Introduction
As of 2015, 47.5 million people worldwide are living with dementia [6]. In 2011, 747,000 Canadians and 5.1 million Americans were living with Alzheimer’s disease and other dementias [6,11]. As the “baby boomer” generation ages, these figures are projected to increase dramatically thus posing a serious challenge to the health-care infrastructure. Consequently, detection of the cognitive decline that precedes Alzheimer’s disease, or dementia in general, becomes vital so as to appropriately apply current best practices for clinical evaluations and management as well as to be available for rationale administration of anticipated new therapies.
However, this capability of early detection is very challenging with the contemporary detection processes in the form of conventional clinician visits which are typically not sensitive to detecting mild or subtle cognitive or functional decline. This corroborates what has been reported in some studies that in more than 50% of detected cases it was the family members who served as the primary source of recognition and not the family doctors [15]. This delay in detecting cognitive decline can be detrimental especially to older adults with reversible forms of dementia, who form up to 11% of the cognitively impaired population [12]. Early detection of remediable causes of cognitive impairment such as medication complications or nutritional deficiencies facilitates timely intervention, possibly increasing the chances of reversing the condition. Even for subjects with irreversible decline, early recognition still provides them and their families with an opportunity to proactively plan for their future by seeking the appropriate interventions and to avoid being forced into crisis management [8].
Mild Cognitive Impairment (MCI) is a concept that describes the transitional period between normal aging with intact cognition and early Alzheimer’s disease or other dementia. Individuals with MCI have measurable changes in their memory and thinking abilities but with minor impact on their ability to carry out activities of daily living. Although not all subjects with MCI progress to develop Alzheimer’s or other dementias, the proposed criteria and guidelines for diagnosis of Alzheimer’s disease published in 2011 have documented an accelerated rate of progression to dementia and Alzheimer’s disease in MCI subjects [22]. Therefore, detecting MCI serves the objective of detecting cognitive decline early enough for subjects to seek the right intervention and treatment. Different subtypes of MCI exist such as amnestic MCI (a-MCI), where the memory of an individual is compromised, and non-amnestic MCI (na-MCI), where other cognitive domains of an individual are impaired [27].
Several studies have demonstrated that changes in motor capabilities precede and may be indicative of cognitive impairment [10], and that changes in walking speed could be good predictors of progression to dementia [2]. Accordingly, and with the advancement in technology and the proliferation of smart systems, a good alternative to the traditional clinical paradigm is to bring assessment into the daily activity of a person in their home environment via unobtrusive sensors and systems. In this paper, we propose an approach for home-based automatic detection of MCI in older adults through continuous monitoring using unobtrusive sensing technologies. Our approach employs a clustering algorithm to group room activity distributions belonging to different states of cognition into different clusters, each represented by an “exemplar”. These exemplars are then used to classify room activity distributions pertaining to a test subject, and then these classifications are used to determine the cognitive status of the test subject.
The rest of the paper is designed as follows: Section 2 summarizes related work, lists research questions, and presents contributions. Section 3 describes the inclusion criteria for subject recruitment, the data acquired, and the labeling protocol implemented. Section 4 defines the problem and describes the methodology we implemented to automatically detect MCI in older adults. Section 5 presents and discusses results obtained. Section 6 addresses the limitations of the current work and proposes directions for future work. Finally, Section 7 concludes the paper.
Related work
The literature is rich with smart systems and studies designed to monitor the health and well-being of older adults and to support their independence such as the Microsoft’s EasyLiving project [9], the GATOR Tech Smart House [20], the AWARE home at Georgia Tech [1], and the GE QuietCare System [17]. In addition, in one study by the Center for Advanced Studies in Adaptive Systems (CASAS), Dawadi et al. implemented a machine learning approach to discriminate cognitively impaired older adults from their cognitively intact counterparts based on their ability to complete a ‘Day Out Task’ that consisted of a number of interwoven Instrumental Activities of Daily Living (IADL) [13]. However, all results reported by these systems and studies were based on data acquired in a laboratory environment and not in a real world setting. An approach that would be more reflective of the subjects’ actual performance would be to continuously monitor the subjects, perhaps in their own homes where they are more likely to exhibit their true performance.
In another study, Sixsmith performed a trial to test the ability of an intelligent monitoring system, composed of sensors in the home, to identify emergencies by detecting deviations from normal activity patterns [30]. The sensing technologies consisted of passive infra-red sensors, contact sensors, and temperature sensors. Of the total 61 alerts that were recorded in a period of 3 months, 46 alerts were classified as false alerts and only 15 alerts were classified as genuine. In other words, the approach suffered from a high rate of false positives, approximately 75%. In a similar study, Skubic et al. implemented a simple alert algorithm to generate health alerts to clinicians via continuous monitoring of the subjects in their homes using unobtrusive sensing technologies such as passive infra-red motion sensors, bed sensors, and temperature sensors [31]. Similarly, the alert algorithm generated 183 false alerts out of a total of 299 alerts in a period of 9 months. This translates into an accuracy of 38.8% and a false positive rate of 61.2%. In addition, both of these studies monitored the general health of the occupants and were not designed to specifically detect cognitive changes.
The ORegon Center for Aging and TECHnology (ORCATECH) recruited more than 300 cognitively healthy older adults and monitored them for an average period of 5 years using unobtrusive sensing technologies, resulting in a large database of sensor data and clinical data [24]. Recently, Dodge et al. presented trajectories of home-based daily walking speeds and their variability of recruited subjects and compared the resulting trajectories between the cognitively intact subjects and those with non-amnestic mild cognitive impairment (na-MCI) [7,14]. Participating older adults with na-MCI were characterized by a slowing of walking speed and exhibited the highest and lowest variability in their walking speeds in comparison with their cognitively intact counterparts.
Building on the work by ORCATECH and Dodge et al., we explored the feasibility of autonomously discriminating older adults with MCI from their cognitively intact counterparts using a number of predefined measures associated with their in-home walking speed such as the median weekly walking speed, the coefficient of variation of the weekly walking speed, the coefficient of variation of the morning walking speed, and other measures [5]. Different window sizes were used to extract features from these predefined measures which were then used to train and test two machine learning algorithms, namely support vector machines and random forests. We were able to detect MCI in older adults with an area under the ROC curve and an area under the precision-recall curve of 97% and 93%, respectively, using a time frame of 24 weeks.
We also explored using a number of predefined measures associated with the subjects’ home activity. Activity was measured as the total number of sensor firings. We experimented with measures such as the coefficient of variation of total activity, coefficient of variation of morning activity, and coefficient of variation of evening activity. However, we discovered that such measures did not carry sufficient discriminative information to discriminate older adults with MCI from their cognitively healthy counterparts. This motivated us to seek an alternative approach especially after Hayes et al. reported preliminary results on potential variability in the day-to-day pattern of activities of subjects with MCI when compared to those who were cognitively intact [18].
Accordingly, we designed a better approach to detect MCI in older adults based on their home activity. We built statistical models of the subjects’ home activity by using inhomogeneous Poisson processes to model the presence of subjects within different rooms throughout the day [3,4]. The resulting generalized linear models (GLMs) of the subjects’ home activity provided intuitive statistical analysis, and using the Kullbak–Leibler (KL)-divergence measure, we demonstrated an existing statistical difference between activity models pertaining to subjects when cognitively intact and when experiencing symptoms of MCI. Building on our work on estimating GLMs of the subjects’ home activity, we explore the following research questions:
Can we use GLMs of home activity, in the form of individual room activity distributions, to automatically detect MCI in older using unobtrusive sensing technologies?
What size of time frame results in the highest
How do home activity distributions of older adults when cognitively intact compare with their activity distributions when exhibiting symptoms of amnestic MCI (a-MCI) or non-amnestic MCI (na-MCI)?
Using the ORCATECH dataset, we were able to answer these questions using sensor and clinical data pertaining to 85 subjects collected over an average period of 3 years via unobtrusive sensing technologies installed in the subjects’ homes. This paper makes the following contributions:
We propose a clustering-based method to automatically detect MCI in older adults using estimated GLMs of their home activity. Exemplars are created to represent clusters of the room activity distributions belonging to different states of cognition using a combination of k-means and affinity propagation (AP). These exemplars are then used to classify room activity distributions belonging to a test subject. These classifications are then employed to determine the cognitive status of the test subject. We were able to detect MCI in older adults with an Interestingly, when including subjects exhibiting symptoms of na-MCI only, we were able to detect MCI in older adults with an
Data acquisition & labeling
In this analytic study, we focused on 85 ORCATECH homes with single occupants with the requisite sensor and clinical data needed for the subsequent analyses.
Participants and data acquisition
Participants were recruited from the Portland, Oregon, metropolitan area. The eligibility criteria included [24]:
aged 70 years or older;
living independently in a larger than one-room “studio” apartment;
cognitively healthy (Clinical Dementia Rating (CDR) score < 0.5; Mini-Mental State Examination (MMSE) score > 24); and,
in average health for age (well-controlled chronic diseases and co-morbidities or none at all).
Data were acquired by installing sensing technologies in the homes of the recruited subjects. In order to detect movement and general activity, passive infra-red motion sensors were installed in rooms frequently visited by the participating subjects. Visitors and absences from the home were tracked through wireless contact switches placed on the exit doors of the home. All sensor firings were sent wirelessly to a transceiver, time-stamped and recorded. In addition to the sensing technologies, recruited subjects were requested to complete a weekly online questionnaire, where subjects reported any visitors during the week, days spent away from the home, any change in health or medication, admittance to ER, and a number of other queries. For full details on data acquisition, the reader is referred to [24].
Six neuropsychological tests used to assess the subjects cognitive capacity
Six neuropsychological tests used to assess the subjects cognitive capacity
Participants were assessed in-home at baseline, and during annual in-home visits by research personnel who administered a standardized battery of tests, including six neuropsychological tests which are considered to be representative of five cognitive domains. The six neuropsychological test are summarized in Table 1.
Diagnosis of MCI was made using the Petersen criteria [27] operationalized as absence of dementia, intact functional activities, normal general cognitive function (MMSE score ⩾ 24), and objective impairment on one or more of the neuropsychological tests listed in Table 1. Impairment on neuropsychological testing was defined as a score of 1.5 SD or more below the predicted mean value for subject-specific age, sex, and educational levels, based on normative values generated in the past by the Alzheimer’s Disease Centers (ADC) program [35]. We also investigated different sub-types of MCI, namely amnestic (a-MCI), and non-amnestic MCI (na-MCI). Accordingly,
a-MCI was defined as impairment on the neuropsychological testing in the memory domain only.
na-MCI was defined as impairment on the neuropsychological testing in any of the four domains – executive function, language, attention, and visuospatial but not in the memory domain.
Since subjects were assessed annually, data labels fell into three categories:
cognitively intact: “CIN”, transitioning to mild cognitive impairment: “TR”, and having mild cognitive impairment: “MCI”.
Figure 1 illustrates how these labels were assigned by depicting a subject who was monitored for at least 3 years and was administered three annual assessments besides baseline. The subject was assessed as cognitively intact at baseline, but was assessed as exhibiting symptoms of MCI on the 2nd and 3rd year assessments. Therefore, the data from baseline up to the 1st year assessment were assigned the label “CIN” and the data from the 2nd year assessment onward were assigned the label “MCI”. The data between the 1st year and the 2nd year assessments were assigned the label “TR” for transitioning to MCI. This is because the conversion to cognitive impairment is not an instantaneous event but a gradual process. Accordingly, the subject’s cognitive status would be in flux between years 1 and 2 and would not belong to either cognitive intactness or MCI. In order to ensure consistency in labeling subjects’ data based on their annual assessment scores, we developed and implemented the following protocol:
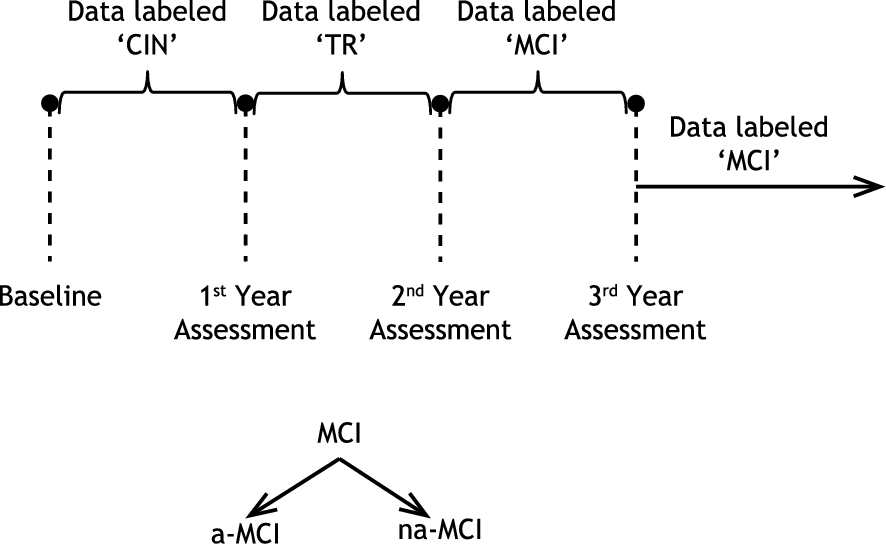
Example of a subject who was assessed as having MCI on the 2nd year assessment onward.
An impairment in a cognitive domain should appear on at least two consecutive annual assessments to be considered; otherwise it was ignored.
If a subject exhibited impairment in one cognitive domain on an annual assessment, and this impairment disappeared on the following assessment, but then reappeared in the same cognitive domain on all the subsequent assessments, then the subject was considered impaired in this cognitive domain from the first assessment onward.
If a subject exhibited impairment in one cognitive domain on an annual assessment, and this impairment disappeared on the following assessment, but then reappeared in a different cognitive domain on all subsequent assessments but resulted in the same sub-type of MCI, either na-MCI or a-MCI, then the impairments were combined and the subject was again considered impaired from the first assessment onward. Otherwise, each impairment was treated separately.
Suppose that a database consists of N subjects, each residing in a living unit of R rooms, who were monitored in their homes for a few years using unobtrusive sensing technologies. For each subject, a sliding time window of size ω weeks is used to build a dataset of room activity distributions. These distributions estimate the probability of the subject being present in room r during a time interval t of the day, where
In this work, we represent variables by lower case letters, e.g. d, vectors by bold lower case letters, e.g.
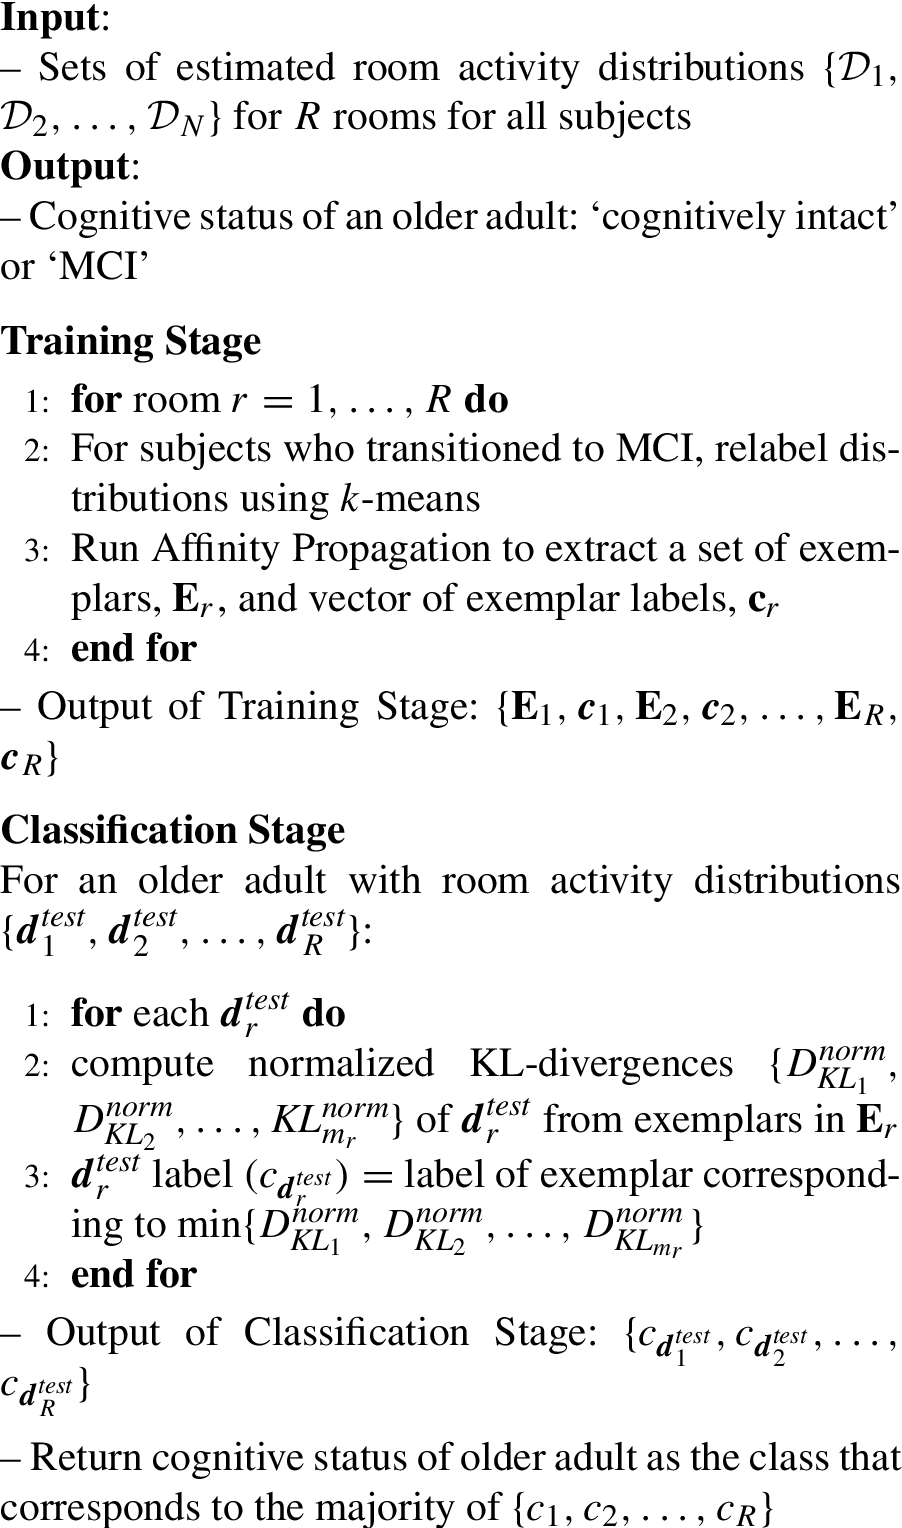
The database of room distributions (1) is used to supply distributions that best represent this database, referred to as “exemplars” using an off-line procedure. This constitutes the training stage. In a test stage, for a subject with R room activity distributions, the objective of the cognitive status recognition system is to assign a label to each room activity distribution and then use these labels to determine the cognitive status of the subject. Figure 2 depicts the general overview of the proposed approach in assigning labels to room activity distributions corresponding to one room r, where

General overview of the cognitive status recognition process using distributions corresponding to room r. (a) Training Stage. (b) Test Stage.
The training stage comprises two parts. For each subject, a sliding time window of size ω weeks is used to divide the sensor data for room r into frames each of size ω weeks. Then for each frame, the ‘room activity distribution estimator’ block estimates the corresponding room activity distribution. This results in a dataset of room activity distributions for room r per subject. A training set for room r is formed by combining all datasets of room activity distributions from all subjects. This training set is then processed through a clustering stage that consists of two sub-blocks. The first clustering sub-block performs high level clustering using k-means to deal with possible mislabeling of the distributions. Since subjects were assessed annually, then it was not possible to determine when exactly the transition to MCI occurred. Accordingly, as per our label assigning procedure, some distributions could potentially be mislabeled. For examples, some distributions could be labeled “CIN” when they should actually be labeled “TR” or the other way around. The relabeled distributions are then fed into the affinity propagation (AP) sub-block to decompose the training set into multiple clusters. Clustering in essence represents the core of the training stage. Each cluster is represented by one of its members, referred to as the “exemplar”. The output of the clustering stage, and in turn the training stage, is a set of exemplars
As for the test stage, a room activity distribution coming from a subject with unknown cognitive status is compared to the set of exemplars by computing the normalized KL-divergence between the unknown distribution and the set of exemplars. The distribution is then assigned the label of the exemplar that yields the smallest normalized KL-divergence. The cognitive status of the test subject based on room r activity distribution is then determined as the class to which the label of the activity distribution belongs, either ‘cognitively intact’ or ‘MCI’. Note that the overview portrayed by the block-diagram in Fig. 2 corresponds to one room only. Therefore, the training described above should be repeated R times. The details of each sub-block are discussed in the following subsections.
The first step in the cognitive status recognition process is creating a training set,

The process of building a dataset of room activity distributions for room r for subject n.
The estimated room distribution provides the probability of the subject being present in room r during some time interval during the day. An inhomogeneous Poisson process can well-model this problem since a Poisson distribution models the number of occurrences of an event in a fixed time interval. If we define a variable
For each frame of size ω weeks, the resulting distribution is estimated as follows. The input space consists of a total number of
Because subjects were assessed annually for MCI, it was not possible to determine at what point exactly the transition took place. Consequently, for subjects who transitioned to MCI, some distributions could potentially be mislabeled. This was demonstrated in our previous work [3,4], where we demonstrated that the majority of the subjects started transitioning to MCI several months prior to the start of the “TR” period, defined in Fig. 1. Therefore, several distributions labeled “CIN” should be actually labeled ‘TR”. As for subjects who started transitioning after the start of the transitioning period, some of the distributions labeled “TR” should most likely be labeled “CIN”.
In order to address this issue, we added a preprocessing step of high-level clustering using k-means. We are not much concerned about the distributions bordering the “TR” period and the “MCI” period since we are formulating the problem as a classification problem and both of these periods are lumped into one class, the ‘MCI’ class. Therefore, for each subject who transitioned to MCI, the room activity distributions for each room are clustered using k-means into two clusters: one cluster for the ‘cognitively intact’ class, and another cluster for the ‘MCI’ class. As a result, for subjects who started transitioning prior to the start of the “TR” period will have some of their “CIN” distributions assigned the label 1, indicating that they belong to the ‘MCI’ class. This change is reflected in the datasets of room activity distributions for each subject. For subjects who did not transition, no change occurs in their datasets of activity distributions. For subjects who transitioned prior to the start of the “TR” period, possible changes are shown in (11).
Kullback–Leibler divergence measure
Since we are dealing with probability distributions, a good measure of similarity between the different distributions is the Kullback–Leibler (KL)-divergence [28]. The KL-divergence of an activity distribution,
One useful property of the KL-divergence is asymmetry. So
Affinity propagation
The next sub-block in the clustering step is using affinity propagation (AP) [16] to divide the training set distributions into different clusters and to appoint a representative to each cluster, referred to as the “exemplar”. AP is an algorithm that simultaneously considers all distributions as potential exemplars and recursively exchanges real-valued messages among the distributions until a good set of exemplars and clusters emerges. Clustering is based on the exchange of two types of messages: the “responsibility” message to decide which distributions are exemplars, and the “availability” message to decide to which cluster a distribution belongs. The responsibility message is given by
In addition to the measure of similarity, AP takes as input a set of real numbers, known as self-similarity or preference (p) for each activity distribution, so that distributions with larger values of p are more likely to be chosen as exemplars. For the proposed cognitive status recognition system, the self-similarity p is proportional to the median of the input similarities, that is
AP is chosen as the clustering technique because it handles better the fact that activity distributions belonging to the same class should not be forced to have only one exemplar or center as is the case with k-means for example. Ideally, it would be perfect if we are able to generate only one cluster for ‘cognitively intact’ class and another cluster for the ‘MCI’ class. However, practically this is not the case given that different individuals are more likely to exhibit different patterns of daily activity. Accordingly, with AP, we are able to divide the training set of distributions into different clusters, each represented by an exemplar while ensuring that members of each cluster belong to the same class.
The output of AP is a matrix of exemplars,
Cognitive status recognition algorithm using clustering of room activity distributions
The cognitive status of the 85 subjects based on annual neuropsychological assessments during the monitoring period were as follows:
59 subjects remained cognitively intact throughout the monitoring period. 11 subjects had a-MCI at baseline or transitioned to a-MCI during the monitoring period. 15 subjects had na-MCI at baseline or transitioned to na-MCI during the monitoring period.
Baseline here corresponds to the beginning of the data that we received from ORCATECH, which for some subjects did not necessarily represent the actual subjects’ baseline – when the subjects were recruited. Subjects were monitored for different periods of time for reasons such as subjects passing away, moving out of the metropolitan area, or feeling overwhelmed by study procedures. Table 2 presents statistics associated with the monitoring periods (in weeks) of the 85 subjects.
Statistics of monitoring periods of subjects
Statistics of monitoring periods of subjects
Sensing technologies were deployed in the subjects’ living units. Subjects lived in a variety of settings from apartments in organized retirement communities to single-family detached homes. In order to standardize comparison among the recruited subjects, we decided to base our analysis on four rooms: main bedroom, main bathroom, kitchen, and living room. In other words, R in (1), was equal to 4.
Because we focused on homes with single occupants, before we could start estimating the rooms activity distributions, it was necessary to clean the data. The weekly questionnaires that the subjects were asked to fill out were very helpful for the cleaning process. The cleaning process involved discarding days on which subjects had their in-home annual assessments, days on which subjects had any visitors over, days which subjects spent away from the home, days spent in ER, days on which subjects had maintenance people over, or days on which people reported health problems that limited their activity, and days on which sensors failed to fire due to a dead battery or other malfunction.
Evaluation score
Although the majority of clinical studies use sensitivity and specificity scores as evaluations metrics, next we justify why these scores can be misleading especially with imbalanced databases like the one at hand. Suppose we have a database of 100 subjects, 80 of which are cognitively intact and the remaining 20 have MCI. Let’s assume we are able to detect MCI in this dataset with equal sensitivity and specificity scores of 0.8. At first glance, one is tempted to believe that the system is performing very well. However, if we analyze these numbers, we will discover that the system is suffering from a rate of false positive as high as 50%. Recall that,
Accordingly, we use the F score instead to evaluate the performance of our approach, and to put more emphasis on precision than recall, i.e. making sure we penalize the system for false positives, we report the
80% training data and 20% test data
Since not all the subjects transitioned to MCI during the monitoring period, it was not possible to test our approach using a leave-one-subject-out evaluation process by including all 85 subjects. Alternatively, we randomly divided our database of subjects into a training set and a test set of subjects, such that the training set contained 80% of the distributions belonging to each cognitive state – “CIN”, “TR”, and “MCI” and each MCI subtype – “a-MCI”, and “na-MCI”, and the test set contained 20% of the distributions belonging to each cognitive state and MCI subtype. Note that the creation of these sets was based on full subject data in order to ensure that no distributions pertaining to the same subject existed in both the training and the test sets.
scores with
weeks and slide sizes of 2 weeks, 3 weeks, and 4 weeks
We experimented with different time frames ranging from 4–24 weeks as well as different slide sizes ranging from 2–4 weeks. We empirically found that a value of β, defined in (17), of 0.5 resulted in the best performance. The results obtained using a time frame of 4 weeks, i.e.
According to Table 3, we were able to detect MCI in older adults with an
Similarly, Table 4 presents the
As the window size continued increasing, better performance and higher
One reason that could explain the worsening performance for windows bigger than 20 weeks is that as the window size increased, the number of estimated distributions per room for each subject decreased. Many subjects who transitioned to MCI during the monitoring period also had a long period of being cognitively intact. This was in addition to subjects who remained cognitively intact throughout the monitoring period. As a result, the database clearly contained more distributions belonging to the ‘cognitively intact’ class than the ‘MCI’ class, which in turn meant that the set of exemplars created from the training stage most likely contained more exemplars representing distributions that belonged to the ‘cognitively intact’ class. If exemplars representing one class dominate the set of exemplars, then there is a higher probability for a room activity distribution belonging to a test subject to be labeled as belonging to the class with the higher number of exemplars. In this case, it is the ‘cognitively intact’ class.
Out of the 26 subjects who were labeled as having MCI, 22 of them were cognitively intact for some period and then transitioned to either a-MCI or na-MCI. So in order to test the validity of the results obtained using the 80%–20% division of the database, using the features that resulted in the best performance, i.e.,
As Table 7 shows, comparable performance was noted which confirmed the results obtained using the 80%–20% division of the database. The majority voting
scores window of size
weeks and slide size = 4 weeks associated with leave-one-subject-out cross-validation
We were also interested in investigating the different sub-types of MCI and how the room activity distributions of subjects experiencing symptoms of each of the sub-types differed from their room distributions when they were cognitively intact. Of the 15 subjects who were labeled as having na-MCI, 14 of them transitioned to na-MCI during the monitoring period. Table 8 summarizes the
The performance of the algorithm was impressive; the
scores for
weeks and slide size = 4 weeks with aMCI distributions only
As for a-MCI, of the 11 subjects who were labeled as having a-MCI, 8 of them transitioned to a-MCI during the monitoring period. Table 9 summarizes the
According to the definition of a-MCI, it a sub-type of MCI that primarily affects the memory of an individual, so an individual experiencing symptoms of a-MCI is less able to remember information such as appointments, conversations, or recent events [27]. In other words, subjects with MCI still have their problems solving skills intact. Therefore, individuals with a-MCI most likely continue carrying out activities in the same sequence and fashion as when they were cognitively intact since their ability to judge the sequence of steps needed to complete a complex task is not compromised. Consequently, changes in their room activity distributions are less likely to occur.
However, the majority of the subjects did have significant differences in their bedroom activity distributions after they transitioned to a-MCI. This is mostly attributed to disturbed sleep patterns, mainly in the form of waking up at night. This finding is supported by a recent study by McGee et al., who concluded that sleep disturbance is common in subjects with a-MCI, and that many individuals with a-MCI have more than one symptom of sleep disturbance [19,26]. Besides waking up at night, other symptoms include initial insomnia, snoring, breathing difficulties, nightmares, or excessive daytime sleepiness. In another study, Hita-Yañez et al. investigated the existence of sleep disturbances in MCI subjects via polysomnographic recordings in cognitively healthy older adults and in patients with MCI [21]. Hita-Yañez et al. concluded that sleep disruptions were evident in MCI patients. These differences in results between aMCI and naMCI may be related to differences in the pathology underlying these MCI sub-types.
One limitation of the proposed work is the prerequisite of having sufficient data to build a database of room activity distributions in order to extract exemplars that would represent the different states of cognition. Accordingly, an alternative method has to be designed in order to address cases where such a database of room activity distributions cannot be created. One direction for future work is to investigate the feasibility of using changepoint detection for automatic detection of MCI in older adults. If feasible, such an approach would not require a database of room activity distributions. Instead, it would track each individual separately and perform intra-individual comparison by comparing each subject’s activity distributions to their past distributions, and assess their cognition accordingly.
Another limitation of this work is the small population size of older adults who transitioned to MCI during the monitoring period. We believe it is very important to test our proposed approach on a larger population size in order to corroborate these results and confirm their validity.
Conclusion
In conclusion, we proposed a home-based clustering technique for automatic detection of MCI in older adults. We formulated the problem as a classification problem with two classes: ‘cognitively intact’ class and ‘MCI’ class. A sliding window was used to create a database of room activity distributions from the sensor data pertaining to 85 subjects. Affinity Propagation was then applied to cluster the room distributions in the database and to extract exemplars to represent the distributions belonging to the different cognitive states. This represented the training stage. In the test stage, the room distributions belonging to a test subject were compared to the exemplars and were assigned the labels of the exemplars that yielded the smallest normalized KL-divergence. The labels of the room distributions were then used to determine to which class the test subject belonged. This answered our first research question.
By varying the size of the time frame, mainly from 4 weeks to 24 weeks, and the slide size from 2 weeks to 4 weeks, we observed an overall improvement in performance, reflected as higher
Finally, we investigated the different sub-types of MCI, namely a-MCI and na-MCI. Using leave-one-subject-out cross-validation, we found that subjects experiencing symptoms of na-MCI had room activity distributions that were significantly different from their room activity distributions when there were cognitively intact. This was reflected as very high