
Abstract
Current smart-home and automation systems have reduced generality and modularity, thus confining users in terms of functionality. This paper proposes a novel system architecture and describes the implementation of a user-centric smart-home gateway that is able to support home-automation, energy usage management and reduction, as well as smart-grid operations. This is enabled through a middleware service that exposes a control API, allowing the manipulation of the home network devices and information, irrespectively of the involved technologies. Additionally, the system places the users as the prime owners of their data, which in turn is expected to make them much more willing to install and cooperate with the system. The gateway is supported by a centralised user-centric machine-learning component that is able to extract behavioural patterns of the users and feed them back to the gateway. The results presented in this paper demonstrate the efficient operation of the gateway and examine two well-know machine learning algorithms for identifying patterns in the user’s energy consumption behaviour. This feature could be utilised to improve its performance and even identify energy saving opportunities.
Introduction
Smart home and automation technologies are becoming increasingly popular. This does not only concern the technologically literate part of the population, but also energy producers, grid operators and as well as energy distributors. For example, the mass roll-out of smart meters [14] is expected to transform the area of residential energy consumption. This will also impact the carbon emissions, especially in countries like the UK. According to the Department of Energy and Climate Change (DECC) statistics, 50% of UK carbon emissions are from buildings; of which, two-thirds come from dwellings. In addition, the residential sector alone is responsible for the 37% of electricity end use in the U.S. and 29% in the EU [24].
Researchers and industrial players are looking forward to new technologies that are able to monitor and remotely control the energy consumption behaviour. There have been many new proposals for Home and Building Energy Management Systems (HEMSs/BEMSs). Prominent examples include the Nest1
The main motivation behind this work, is the belief of the authors that future smart-home technologies should place the user in the heart of the system architecture. Especially in residential energy management scenarios, its is not feasible to simply implement energy conservation operations, disregarding the behaviour of the individuals involved and their comfort levels. For the success of any such a system, the active user engagement and personalized feedback, become key issues. Additionally, the fact that all the user’s sensitive information will be received and stored by an alien entity, does not provide adequate motivation for people to adopt smart-home technologies [3].
This paper presents the design and implementation of a novel smart-home system that takes into account the above points. This system is one of the core elements of the Digital Agent Networking for Customer Energy Reduction (DANCER) project that aims to achieve lasting behavioural changes, associated to the energy reduction within the house, while retaining desirable comfort levels. A preliminary version of this work has already been published [23] describing the high level architecture of the proposed system. The current work looks in more detail the two vital components of the DANCER system, the Home Gateway (HG) and the Behavioural Pattern Extractor. These two parts of the system allow the user to interact with it, provide the home automation functionality and finally enable the system to learn and adapt to the user’s behavioural patterns.
The contribution of this paper is threefold. First, the general architecture of the system is briefly explained, focusing on generality, modularity and the users’ behavioural patterns and comfort. Second, the software design and implementation of the HG are analysed. This includes the database structures, the software services (e.g. Policy Engine) running and most importantly the developed middleware that exposes the Application Programming Interface (API) of the HG. This allows services to request context and actions from the middleware, without any need to know the technology specifications of the final endpoint. Consequently, users can integrate devices of various technologies into the home network as well as define personal actions on them, customizing/extending the operation of the smart-home. Finally, the machine learning mechanism is presented. A specialized component (RECAP) is in charge of collecting the data and uses well-known deterministic machine learning algorithms to extract behavioural patterns, which are later on fed back to the HG. In contrast to other approaches that simply enforce energy-saving actions, the employed methodology is able to provide much more personalized and refined feedback and management policies.
The structure of this paper is as follows. In Section 2 the most important literature on the area and existing market solutions are reviewed. Section 3 presents the general architecture of the DANCER system, while the following Section 4 describes in more detail the individual software components and service of the HG. These include the Policy Description Language (PDL) that allows users to input their own automation preferences and the DANCER middleware and API that provide the feature of generality. Afterwards, in Section 5 the implementation of the machine learning component is described, along with the feedback mechanism to the HG. Sections 6 and 7 present the current test-bed implementation and a set of results that demonstrate the feasibility and capabilities of the proposed solution. Finally, Section 8 concludes this work.
The DANCER project is part of a larger effort in the UK to transform the energy demand management and introduce smart HEMSs/BEMSs. This has led to the establishment of networks such as the EPSRC2
Most of the existing platforms focus on interoperability and middleware support for developing new intelligent applications. The open-source OpenHAB4
The availability and machine-to-machine (M2M) communication capabilities of smart-home platforms, enables researchers to examine ways of extending the advanced metering infrastructure to a sub-residence level [10]. One of the most prominent and practical proposals for bridging this gap between smart-homes and the forthcoming smart-grids is the OpenADR demand-response protocol [16], proposed to be used complementary to the Smart Energy Profile.
Review of existing HEMS Platforms
Home Gateways (HGs) are a core component of HEMS/BEMSs, and as such, they have drawn an extensive amount of interest. Standardization efforts such as the Home Gateway Initiative (HGI)7
Their increasing processing capabilities are gradually enabling HGs to automatically predict user preferences through ambient intelligence and machine learning techniques. An excellent overview of the available on ambient intelligence technologies is provided by Cook et al. [6]. Older techniques were usually focusing on a limited number of context variables for the learning process [4,13]. In a different approach, Hasan et al. [12] considered the problem of conflicts between multi-user preferences. The authors proposed a combination Bayesian RN-Metanetwork (multilevel Bayesian network) and game theory to model the users’ preferences and achieve conflict resolution. Users however, had to evaluate the system recommendations at every occurrence, in order to update it’s behaviour. Concerning the amount of information integrated in the energy management systems, earlier proposals provided only partial solutions, e.g. for home thermal characterization [22] and air-conditioning [7]. Moreno et al. [18] suggested an OSGi-based system, employing Big Data algorithms to manage and optimize the energy consumption in buildings. Even this more holistic approach though, investigates the issue only on a per building/room basis. Principal Component Analysis (PCA) is used to reduce the dimensionality of the collected sensor data. This results in only taking into account the outdoor temperature, humidity and pressure, when trying to predict energy consumption. While the authors managed to accurately predict the energy consumption, they do not consider the effect of the aforementioned variables on the energy-related actions of the users. For residential scenarios, personalized energy management profiles requires a much finer investigation and extended system capabilities.
In a nutshell, a new energy management architecture is required, which not only provides the features seen in Table 1, but is also capable of supporting multiple automation technologies and at the same time allows personalized learning. Especially in residential deployments, the one-size-fits-all principle cannot be applied and a per-user/per-device consideration is necessary. Finally, a simplified system that allows users to easily extend its functionality, is the way to lead future residential energy management beyond the limitations of current approaches. Collaborative communities could emerge, making the power distribution grid management a two way information stream. This work attempts to realistically address the raised issues and intends to consolidate the notion that users should be placed at the centre of the system design.
DANCER is a user-oriented sensor-based system for monitoring and reducing energy consumption is houses. Its efficiency and therefore its success, is coupled with the comprehensiveness with which the user can interact with it and its adaptivity in terms of different deployment scenarios. Unlike most online-based HEMSs, it is able to operate (although with limited functionality) even when there is no Internet connectivity in the premises it is located. This is a necessity for a realistic deployment scenario, as some of the locations might be completely disconnected. Consequently the main functionality is located in a Home Gateway (HG) device placed in the residence of each user. The general outline of the system architecture of DANCER is shown Fig. 1.

High level architecture the DANCER system.
The system architecture diagram demonstrates the two core principles of the system design, modularity and generality. Various components can be added/removed, to alter the system’s operation or extend its capabilities. The home network for instance, as shown in Fig. 1, can comprise of a variety of diverse devices. Smart and legacy appliances, sensor nodes, UWB platforms, user interface and HVAC devices are amongst some prime examples. The HG should have the capabilities to connect to all of them, through wired or wireless connections. The applications of the HG however, cannot have a priori knowledge of the available network devices. Consequently, interoperability is a key objective. In DANCER, a middleware layer has been introduced in the HG to mask all implementation details from the services running on top. It allows the manipulation of the local databases and control of the connected devices through a set of dynamic action libraries. Through the provided API, the middleware exposes this generic pool of resources (context and actions) on a number of application services running on top and controls the authorization procedure. More information on the developed middleware is given in Section 4.2.
The HG is able to connect over the Internet to a public UDP-based VPN. The VPN connection allows access to a central storage component named Remote Energy Consumption Amalgamation Point (RECAP). This stores/aggregates each household’s energy consumption information in a centralised, secure manner. This enables automated behavioural pattern extraction operations to take place, without wasting the limited resources of the HG. The cumulative behavioural patterns that derive from the collected data, can be then used to produce energy saving strategies which in turn can be fed back to HG. This whole operation can also achieve improved global (rather than only local) energy utilization. The Behavioural Pattern Extractor service of the RECAP, as seen in Fig. 1, might be ported to the HG as one more service, in cases where no Internet connection is available. In both scenarios, the output of the extractor is a set of rules matching the behavioural patterns of the residents, which can be taken into account while automating the energy-related tasks. Consequently, when devising energy saving policies, the comfort and habits of the users can be taken into account, achieving a compromise between consumption and savings as well as personalized feedback.
The VPN connection of the HG can be utilized for an additionally purpose. It allows the user to connect to the home network remotely, even if the home network is protected by a firewall. This as seen in Fig. 1, is achieved through a public web-interface located in the RECAP component.
The HG software involves a number of services running over the DANCER middleware. As depicted in Fig. 2, their operation is supported by three database structures, while inter-process communication is achieved via a RabbitMQ server running in the background. This is mainly utilized to allow client services to send request messages to the middleware API service, but can also be used to allow other components to receive messages and act as servers. This communication paradigm results in the local HG services, being no different than the RECAP services described previously. All local and remote daemons/applications are able through the API to access the home network devices and information stored in the databases. Consequently the HG is able to operate as a stand-alone device, as well as a distributed system, depending on the requirements of the use case scenario. This feature can prove to be quite valuable in terms of energy management. In a distributed system, various control aggregation levels can be supported. For the remainder of this document however, only two levels are considered (HG and RECAP).

The software architecture of the DANCER Home Gateway.
The core service component is the Local Energy Saving Decision Making Agent (LESDMA). It receives data from the end-users energy usage preferences, the derived users’ behaviour patterns and the home network sensors, including activity-monitoring UWB modules. Afterwards decisions are made to adjust energy consumption in areas not being used throughout the dwelling. Apart from the decision making mechanism, other important daemon services running on the gateway include the Sensor Manager and the sensor/actuator controlling services. The former is in charge of polling all the home network devices to discover their status and acquire the information required for the efficient operation of the LESDMA. The latter ones (e.g. Serial Manager) are used to facilitate the communication with the devices present in the home network, supporting the technology independence feature. All the mentioned services along with the DANCER middleware and the databases involved are more extensively presented in the following subsections.
The software architecture follows a service-centric approach similar to OSGi. However it was deemed appropriate to avoid using the framework in order to optimize the gateway’s performance. Instead the services are controlled using Linux service manipulation tools. The deployed architecture though, could easily be ported on OSGi, in cases where a more powerful platform would be available.
There are three local discrete databases, an SQL, an RRD and a Policy Database. Each of them performs a specific operation and does not necessarily relate to the other two. They are all designed however, to store all necessary information locally and to facilitate the maximum programmability of the HG. It is noted that apart from the SQL database, the remaining two are file-based.
SQL database
It contains the contemporary information on the home network devices, the context data they produce and the identifiers of the actions that can be applied upon them. Consequently, there are six main tables in the resulting schema.
The first table, contains all the context data required for the HG operation. Each entry has a name, a value and a unit (e.g. none, Fahrenheit, Celsius, Watts, etc.). Additional fields include the function, the type, when it was last updated and two factors, the periodicity and the scaling one. The function and type fields can be used in combination, to acquired updates for this context from the home network (or any other location). The type column values are limited to the following options.
User: For context that is set by the user.
Data: For context that is set by the system.
Function: For context that is acquired through accessing the home network.
Network: For context that is sent automatically from the home network.
The components table contains all the necessary information for the devices present in the home network. These include the device ID, the MAC address of the device (if applicable), the endpoint, general information on it, its type, the current operational mode, its interface and the level it is has been current set to. The interface more specifically references the currently supported technologies in the interfaces table. In terms of drivers, up to this point the HG can support X10, Zigbee and Xbee devices. The component type is a more abstract concept and can take as values the three following options.
on-off: For components that only turn on and off.
level: For components that take a value as a parameter.
sensor: For components that only report context information.
The actions table entries describe the operations that are currently supported to be performed on the home network devices. Each action has a specific type, which corresponds to one of the currently supported interfaces, contained again in the interfaces table. The most important aspect of the actions entries is their combination with the conflicts table. This consists of only two fields that contain as values the IDs of existing actions. Each entry represents a conflict between these two actions and therefore, whenever one of them is performed on a device, the second one is considered to have a negating effect (also see Section 4.1.3). This is quite useful in scenarios where automated actions should be performed. Finally, the last table contains messages towards the user, generated either by the DANCER system itself, or its administrators. This allow personalized feedback to be provided to the users, as well as user-supervised updating operations for the energy management policies.
RRD database
The RRD database constitutes of multiple RRDtool9
The policy database contains the rules that enable the automation and machine learning operations of the HG to take place. They are written in clear text format, while the language format in which these policy rules are formulated is an extension of the approach suggested by the PANDA framework [26]. The fact that these rules are defined in a simple intuitive clear text language, greatly simplifies the system configuration. Policies can be updated or even exchanged by users, encouraging the creation of energy-aware collaborative user communities. In the future, this could be extended even more with the introduction of a Visual Programming Language (VPL) policy editor tool.
The PANDA policy rules can be explicitly defined by the user or generated by the classification algorithms running on the data collected from the home network devices. An example is presented in Fig. 3. The employed format will be referred to from now on as the Policy Definition Language (PDL). As shown in the table, the first line of each policy script defines it name. Notice that this could differ from the actual file name. The second line can contain a string that carries the description of the policy file.

An example of the format of the ‘.PSD’ policy scripts.
The remainder of the policy script is split into groups of rules (policies). Each group is defined by its name and priority value. The priority values are considered in an ascending order, meaning that rules of groups with higher priority values will be considered first. Each rule however, has its own priority value as well, for a more refined prioritization. It has to be made clear at this point that priority is always calculated in conflicting policies, not groups. As mentioned in Section 4.1, each available action in the HG SQL database might conflict with one or more other actions. When multiple policy rules are about to be executed at the same point in time, if they are conflicting only the one with the highest priority will be called. For instance, if a device is about to be both turned off and on, with the former one having a higher priority, then this device will just be turned off.
As seen in Fig. 3, each group can contain multiple policies. Each policy is describe by a unique identifier, which follows the format “PIDXXXX” (X represents a decimal number). This identifier is unique along the whole policy script, not just the group. Afterwards, the conditions and action operation are stated, following a rule-based format
Running over the RabbitMQ messaging service, the DANCER middleware hides all the lower implementation details from the operating services (Serial Manager, Sensor Manager, LESDMA, etc.). This includes the SQL database updates, the communication with the home network devices, the RRD operations and the LESDMA policy script manipulations. Hence, any of these implementation specific aspects, can be altered independently of the operating applications. This improves greatly the modularity of the whole system and enables remote energy management.
Due to the highly portability of the RabbitMQ service, multiple API clients can be supported. For instance, a PHP-based web interface can be running on top of the API as a service, in parallel to another Android-based client application. This mechanism also greatly simplifies the implementation of future client extensions, as these are all just services, agnostic of the lower specifications of the system. In addition it removes any constraints imposed by implementation platforms such as OSGi. A dedicated RabbitMQ queue has been assigned to the API Server. All API messages sent to it should abide to a specific JSON format to be normally processed, otherwise they are dumped. In general there are four types of messages in the DANCER API.
REQST Message
REPLY Message
ERR Message
ACK Messages
Every incoming REQST message is handled and a REPLY message is send back to the connecting client if a reply queue has been registered. In cases where there was a problem with receiving the request or its execution was not successful, an ERR message is sent instead. ERR messages contain an error code describing what exactly went wrong.
The action interface
A set of dynamic libraries, accessible from the middleware, allow it to control various aspects of the network and its local system. This capability, along with the dynamic libraries themselves are depicted in Fig. 2 as the “Action Interface” component. The Action Interface, borrowing the terminology of object-oriented programming, is a generic descriptor defining the method in which all actions towards home network devices or the HG should be presented. Each new library is obliged to support the following programming functions, which are called serially, whenever an action is to be performed.
passParams(): This function passes all the required parameters to the action.
trigger(): After the action has been initialized, it is finally performed.
The current implementation follows a methodology in which is individual action is specified in its own dynamic library file. However, since any number of parameters can be provided in each action, more complicated libraries can be constructed. The Action Interface libraries can be installed, upgraded and deleted on run-time, thus allowing the modular system’s capabilities to be extended, without changing its core functionality and installed services. Actions for devices that were not previously supported can be downloaded on-demand to the HG, provided at least that the system core drivers are in place. On top of that, the fact that the DANCER middleware is in charge of performing all actions in such a generic way, enables the system to monitor the performed energy related operations as well as the requesting components (e.g. Mobile Application, System Service). This allows a much more detailed views of who and why chooses to perform a certain action.
Serial manager
As seen in Fig. 2, below the Action Interface several technology-dependent system components are present. They are mainly used to control and communicate with the various home-automation equipment installed in each residence. In energy management systems, apart from sensor modules, actuator devices are also required. This extends the systems capabilities from only providing feedback to the user, to actually take initiatives, preventing any energy wasting. Actuators based on technologies such as Bluetooth and NFC can be employed to achieve the necessary functionality. However, for the current system implementation, the Zigbee technology was selected, because of its extremely long battery life and easy deployment (especially taking into account that the system is to be deployed/tested in multiple residential locations). More specifically, the Zigbee devices operate under the Home-Automation profile, as defined by the Zigbee Alliance10
Communication between the Serial Manager and the other software components takes place through the RabbitMQ server, following the publish-subscribe paradigm [15]. This is accomplished using the exchange points of RabbitMQ. The Serial Manager is listening to a specific exchange for all messages that has the appropriate tag (e.g. ‘SerialMngr’). It is also able to publish in this exchange point, specific outputs from the Serial Interface, so that services that are interested in this kind of information, can subscribe to it. The incoming requests from other software components contain the Zigbee command that should be send down the serial interface of the HG. Currently the coordinator module used supports an AT command set to control the Zigbee network. The replies generated by the Zigbee network are returned via the serial interface and the Serial Manager sends them back to the corresponding client, via unicast. The RabbitMQ messages follow a JSON format, similar to the one of the DANCER middleware. The generic formats of the input (Request) and output (Reply) messages are shown in Fig. 4. This mechanism not only improves scalability, but also enables message prioritization to take place. Incoming requests are processed according to a RabbitMQ-defined routing label to a set of priority queues. In the current implementation three priority queues have been taken into account, although it is flexible enough to support any number.
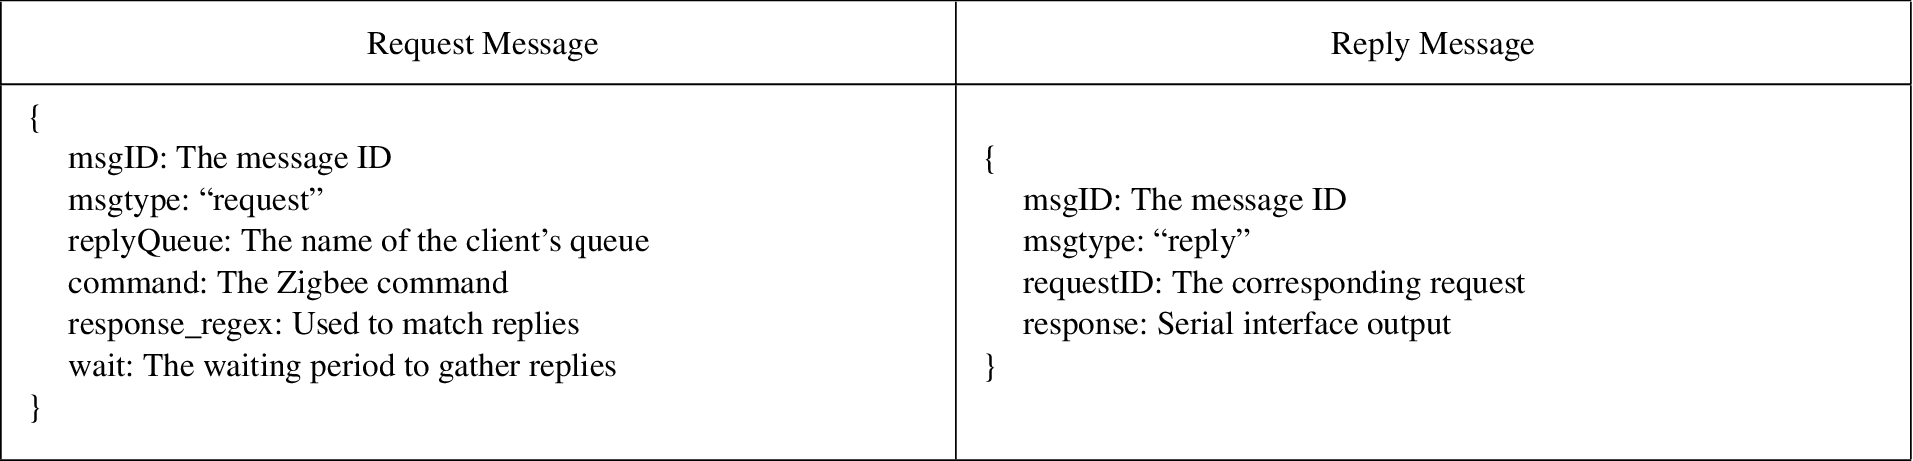
The JSON format of the Serial Manager RabbitMQ Messages.
The Serial Manager can be considered as a dummy process with no knowledge of what commands are issued and what replies are gathered. It is only able to match the information received through the serial interface, to the expected replies of the proceed messages. For the AT command-set used, this is achieved through the use of regular expressions. In the request message structure seen in Fig. 4, they are stored in the ‘response_regex’ field.
The Sensor Manager is another daemon service running on the HG. Its main contribution lies on updating the SQL and RRD databases with (1) the home network actuators’ status and (2) with the current context information. In terms of energy management, the first operation defines the energy saving capabilities of the system. If for example, a device is already off, then further energy savings from it cannot be achieved. The second operation on the other hand, provides information required for the operation of the LESDMA policy engine service and the machine learning procedure of the RECAP. All energy/environmental data obtained from the deployed sensors are considered here.
The first Sensor Manager operation is achieved by periodically polling all non-sensor components defined in the corresponding SQL databased table. What is required of the Sensor Manager, is to check all context entries and identify the ones that it should update with the appropriate information from the home network devices. As mentioned in Section 4.1, the context table entries contain the ‘type’ field. In order for the service to chose the entries that should be updated, the ones whose ‘type’ is set to ‘Function’ are selected. For each of them, the function database column is then used to request the appropriate action from the DANCER middleware.

Demonstration of the procedure for saving reported data via the Sensor Manager.
The second operation of the Sensor Manager however requires a bit more careful investigation. To provide a more comprehensive description, Fig. 5 is shown, noting the procedural steps for the case of an Xbee sensor. Some of the sensor devices (components) present the home network, do not have the capability to respond to requests and just report the sensed values back to the gateway. This operational method, depicted in Step 1 of the figure, is very common in Xbee wireless modules, which may coexist with other more advanced Zigbee devices. The Serial Manager, as mentioned briefly in the previous subsection, is able in Step 2 to receive the data coming from the HG serial interface, and to publish them in Step 3 to a central RabbitMQ exchange point. For the AT command-set used by the coordinator module firmware, these data are serial inputs identified by the prefixes “
Apart from updating the existing fields in the context database, the Sensor Manager is also able to record these changes in the corresponding RRD files. For this operation to be successful, the Sensor Manager should also have the ability of creating new RRD database files. For instance if a new context variable is defined and a corresponding RRD series file is not present, the service should initialize one named after the context entry, and start saving the sensor data received.
For an energy management system to make decision on when to intervene, an intelligent component is required to work alongside the monitoring operations. In DANCER this operation is performed by the Local Energy Saving Decision Making Agent (LESDMA) service. It runs as a daemon and loads a single policy script database file, as defined in Section 4.1.3. The operation of LESDMA implements the automation part of DANCER, rather than directly reducing energy consumption. It is the policy script that defines whether the selected rules will conserve or not energy. This is exactly what make personalized behavioural pattern detection so important. In cases where energy saving policies are implemented, the comfort levels of the user are directly related to the degree the system tries not to disrupt the user’s everyday habits.
During its operation, the daemon checks the SQL database periodically (approximately every three seconds, although this value is configurable) and reads the newly updated context variables. Whenever the value of a variable is updated, the policies that are affected by it are reviewed. In simple words this means that policies that include the changed context variable in their conditions are checked whether they are currently true or false. All the policies which are true for the current context are set to be executed. Execution of a policy is nothing more that requesting from the middleware to run the function which is specified in the rule, but only for the appropriate device.

Pseudo-code of the decision making operation of LESDMA
This is exactly the point where prioritization takes place. If multiple conflicting actions are true at the same time, only the highest priority one is activated. Conflicts are specified in the “conflicts” table (in terms of the SQL schema) of the database, which is also read periodically along with the “context” table. It has to be stressed that conflicts only apply to actions on the same device. Conflicting actions on different devices will still be executed. The algorithm of this operation is presented in more detail in the pseudo-code of Algorithm 1.
In the pseudo-code two procedures are visible, the ContextChangeEventDrivenPolicyReasoning and the ExecuteAffectedPolicies. The former one is called periodically to just receive the set of policies P, affected from a certain context change. If any, it then calls for their execution through the latter. Its operation is mainly related to accessing the SQL database, therefore it is not explained in any more detail. It is also reading the conflicts table, denoted as C in Algorithm 1. It has to be noted that each individual policy p of P, is also a complex structure with conditions and actions, where each action targets a specific home network device ID.
The ExecuteAffectedPolicies procedure has three distinguishable parts, placed in three serially executable for loops. The first one only allows the execution of policies which are true for the current context. The second one performs the prioritization. If there are conflicting policies, whose group or individual priorities are higher that the priority p being checked, then p will be excluded from the execution step. Finally, the last for loop executes the remaining true, non-conflicting policies. Notice however the E set. This a global variable used to indicate the actions that have previously been executed, so that they won’t get called again and again. If an affected policy is not true, then it’s action is removed from the set if it was contained. On the contrary, if the affected policy is true and is actually executed, then it’s action is added in E. It has to be made clear here that each action belongs to a specific policy, therefore even if two policies contain the same action call on the same home network device, the LESDMA service will still consider these to be different actions, as far as E is concerned.
It has already been established that learning is a very important aspect of DANCER. The goal here is to allow the system to learn and predict the behavioural patterns of the user, from the historic data that are available. These include the action requests generated by the user, as well as the collected sensor data from the various devices installed in each household. The above constitutes what is known as a classification problem.
In a classification problem, the aim is to create a model that places objects into pre-defined categories/classes. The model is able to determine the category of an object by analysing patterns (attribute-values) between objects of that category. Therefore, the goal is to find the best model that represents the predictive relationships in the data. In the considered scenario, the classes and attributes could vary per device. For example, for the TV device the pre-defined classes could be
Classification algorithms can be divided into two distinctive categories, according to the model representation they produce: ‘black-box’ models, and ‘white-box’ models. The former models are more difficult to be interpreted; some examples of such models are the ones produced from support vector machines and artificial neural networks [17]. On the other hand, ‘white-box’ models are easily interpretable. An example of this category is the decision tree models. Due to their advantage of interpretability, they can be used to understand how the predictions are made by the model. This leads to a greater degree of trust in the models produced, which is crucial in various domains – e.g., medical, home-automation and financial domains, where the predictions usually need to be validated by doctors/experts.
There are many algorithms that can be used for classification purposes. For the purposes of this paper, two of the most popular classification algorithms will be used, namely C4.5 [20] and RIPPER [5]. These algorithms have previously been implemented in Weka (Waikato Environment for Knowledge Analysis) [25], which is a popular suite of machine learning [17] software written in Java, developed at the University of Waikato, New Zealand.
It should be mentioned that Weka has numerous other algorithms that could be tested with our system. However, this was beyond the scope of our research agenda. At the moment, only the two popular classification algorithms mentioned previously are used. In addition, as mentioned in Section 3, the entire system design focuses on generality and modularity. This translates to the idea of equivalent components being used interchangeably. Therefore, any other learning mechanism library or software component can be employed, as long as the end-product of this operation can be transmitted via the middleware API.
In the following sections (Sections 5.1 and 5.2), the two algorithms used in our work (C4.5 and RIPPER) will be presented in more detail. Finally, in Section 5.3 the learning mechanism process is presented.
C4.5 (J48)

Sample decision tree generated by the C4.5 algorithm.
J48 is Weka’s implementation [25] of the well-known C4.5 algorithm [20]. The C4.5 algorithm, probably the most known decision tree induction algorithm, employs an entropy-based criterion in order to select the best attribute to create a node. In essence, the entropy measures the (im)purity of a collection of examples relative to their values of the class attribute, where higher entropy values correspond to more uniformly distributed examples, while lower entropy values correspond to more homogeneous examples (more examples associated with the same class value). Hence, at each iteration of the top-down procedure, C4.5’s selection criterion favours attributes that minimise the entropy of the generated subsets – i.e., the subsets created according to the examples’ value of the selected attribute. C4.5 has been successfully applied to a wide range of classification problems and it is usually used on evaluative comparisons of new classification algorithms.
An example of a decision tree produced by C4.5 is presented in Fig. 6. It can be observed that the rule first checks if the Day of the week is greater than 6 or less than or equal to 6. Given that the first day of the week in our implementation is Sunday (Day 1), Day 6 is Friday. Thus, if the day of the Week is Saturday, then the rule says that no action should be taken regarding the TV device (
An additional information provided here is the correctness of the rules. This information is given inside the parentheses below each one of the leaf nodes. The first number is the total number of instances reaching the respective leaf. The second number is the number of those instances that are misclassified. Thus, the first rule suggests that the leaf
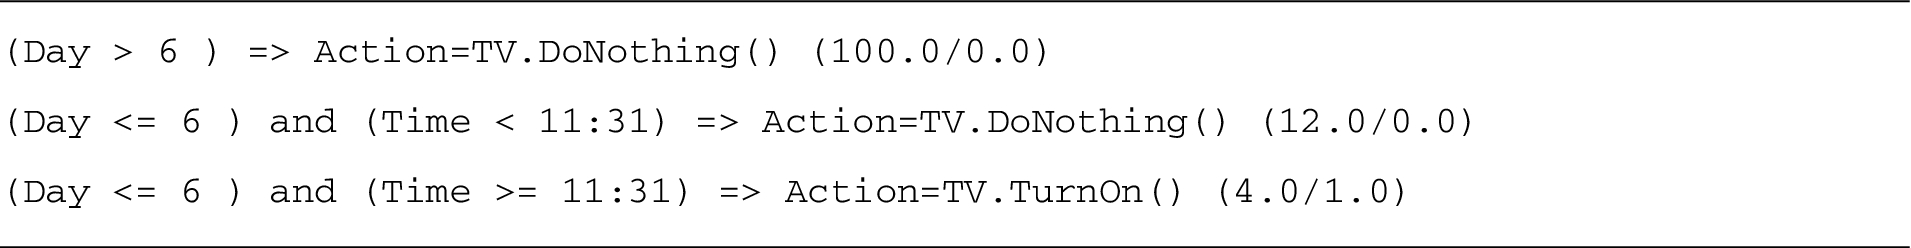
Sample of a set of classification rules derived from the RIPPER algorithm.
JRip is Weka’s implementation [25] of the RIPPER algorithm [5]. RIPPER sequentially creates a set of rules that is subject to a global post-processing step by implementing a rule induction procedure with a reduced error pruning strategy [20]. It starts by designating a fraction of the training examples as the pruning set, which is used to remove terms from rules in order to create simpler and more accurate rules. Then, the procedure to create a set of rules can be divided into two steps. In the first step, rules are individually created using a reduced error pruning strategy covering all training examples (excluding the training examples comprising the pruning set). In the second step, a global post-processing step adjusts or replaces rules guided by a performance measure of the modified set of rules achieved in the pruning set. The performance measure takes into account both accuracy and simplicity (size of the rules) of the set of rules.
An example of the final set of rules created by RIPPER is presented in Fig. 7. It can be observed that the algorithm has created a set of three rules in this scenario. These three rules represent the same rules that were described in Fig. 6 for C4.5. The misclassified cases are again presented inside the parentheses at the end of each rule.
Learning mechanism process
The learning process begins by forming the classification problem. To do so, the attributes that are used to predict the classes of the system need to be defined. Unlike previous approaches, where partial solutions or only a subset of the information collected is used (e.g. [7,18,22]), in our framework, the attributes are the all sensor and polling data collected by the Sensor Manager of each HG, along with their respective timestamps. This is due to residential energy management scenarios considered. The detection of personalized behavioural patterns does not allow for generic concessions on what drives an individual to perform energy-related actions/activities. The attributes are combined to predict the classes; namely the actions that can be performed by the user at any given time. As mentioned in Section 4.2.1, these action records are logged in run-time by the middleware, taking into account their availability on the gateway.
Figure 8 presents the steps of the learning mechanism process. The first step is to query the attributes data. The resolution of this information can take pretty much any value but in the considered scenario has been set to 30 seconds. However, the actions of the user are recorded by the DANCER middleware in an individual log file, at the point in time in which they took place. The first step of the pre-processing operation is in charge of merging these two data sources into a single table. Given a start and stop time of a query, each time-stamp set contains the sensor and polling data. The time-stamp values of the actions however, most probably will differ. Therefore they have to be correlated with the data at the time they were performed. Interpolation could be used in this case, but since the data resolution is quite small, the sensor data values from the exactly previous time-stamp are used to fill the missing values.

Learning Mechanism Process.
From this point on, that data for each the monitored devices is processed individually. Intuitively however, it is expected that the use of each of these appliances will only be involved in a handful of energy-related operations per day e.g., turning on/off the TV, changing the thermostat temperature, turning on/off the lights. Consequently, the number of behavioural rules extracted is by definition small. In addition, important information can be gathered for the state of the environment when there is no action in the house, and also what was the current state that led to an action. For this reason, it was deemed necessary to also take into account the states of the environment when nothing is happening; this is represented as another action, identified as
Next, in Step 3 the learning algorithm (either C4.5 or RIPPER) runs per device. Each algorithm then returns rules in the form of a decision tree (C4.5) or as a set of rules (RIPPER). Since the algorithm is run per device, the obtained rules are also per device (Step 4). In the following step (Step 5), these rules are post-processed. This post-processing operation involves three steps. Initially, the rules generated, whether they are in the form of a tree of a set, are translated into the PDL format described in 4.1.3. Following that, the rules that involve a
The accuracy presents the correctness of each rule, while the F-measure is the weighted average of two other well-known metrics, namely precision and recall. Precision presents the fraction of retrieved instances that are relevant, and recall presents the fraction of relevant instances that are retrieved. The formulas for all these metrics are presented in Eqs (1)–(4), where TP stands for True Positive, TN for True Negative, FP for False Positive, and FN for False Negative.
For the purposes of our experiments, it was decided to choose only rules of high accuracy and
Finally, in Step 6, the remaining rules from all devices are gathered and in Step 7, the DANCER middleware API is used to temporarily store the newly discovered rules in the SQL database of the corresponding HG (whose gathered sensor data and actions generated them in the first place). Once the user connects to the user-interface platform, (s)he is informed that new rules can be applied on the policy engine. Afterwards the opportunity is given to the user to review the new rules, so that these can be integrated in the currently deployed policy script.
Currently the prototype of the DANCER system is comprised of an enterprise level cloud platform connected to the public Internet, Raspberry Pi type B Single Board Computer (SBC) acting as the HG, and a variety of compatible sensors/actuator modules. The selected SBC features a 700 MHz ARM processor, 512 MB of RAM and an 8 GB SD-card storage and is running the Rasbian Linux distribution operating system. Most DANCER services have been implemented using the Java SDK with 1.7 compliance level. Remote and local UI services were built over the Apache 2.2 web server with PHP 5.4 and for the Android platform using the appropriate SDK and libraries. Although the software architecture follows a service-centric approach similar to OSGi, it was deemed appropriate to avoid using the framework in order to optimize the gateway’s performance. Instead the services are controlled using Linux service manipulation tools. In addition, all the software components were ported onto Debian11
The GPIO pin serial interface of the Raspberry Pi is used to connect to the Zigbee coordinator module. The ETRX357 Telegesis chip is employed to be the coordinator, running the Zigbee Home Automation (HA) profile firmware CICIE R300 BETA. It has the capability to communicate not only with Zigbee Alliance certified modules, but also with Digi Xbee Pro12
The HG is able to support peripheral sensors/actuators of various communication technologies. Apart from its embedded Ethernet port, it is also equipped with an Asus WL-330N3G 3G router/access point and a C11 X10 Computer Interface Serial interface. Consequently, it has the ability to communicate with IPv4/IPv6 enables devices, X10 PLC modules as well as Zibgee wireless sensors/actuators.
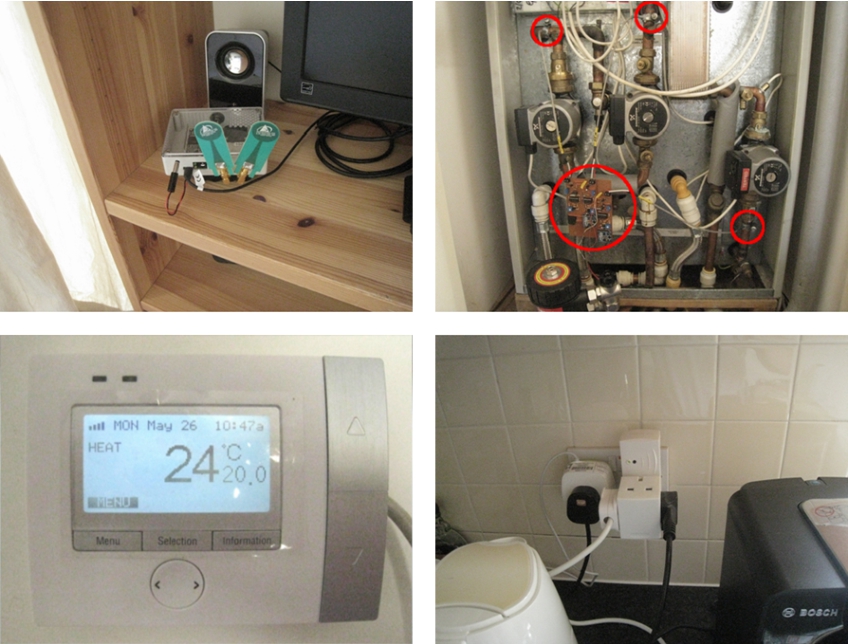
Examples of home network components deployed in the prototype installation – Starting clockwise from the top left corner, they depict a UWB platform measuring occupancy, Xbees sensor monitoring the boiler operation, a Zigbee HA plug module and a Zigbee HA Thermostat.
The prototype implementation has already been deployed on a single bedroom flat in Colchester, UK. As shown in Fig. 9, the utilized/controlled devices installed around the house premises, include a UWB TimeDomain’s13
This section presents the experimental investigation of the deployed infrastructure, in terms of both performance and learning capabilities. The main contribution of this section is not to emulate/simulate a full scale system or to attempt to examine human behavioural patterns from a larger dataset. Instead, it is attempted to make a preliminary investigation of the resources required for a simple one-case scenario, and demonstrate the feasibility and accuracy of the proposed approach. A single household is monitored, namely the prototype test-bed presented in Section 6. The information and data examined, cover the period of one month. All the sensors described in Section 6 were utilized, apart from the UWB transceiver as this has not yet been integrated with the RECAP server on a run-time basis.
Initially, the bandwidth utilization will be reported and the system response times will be discussed (Section 7.1). Afterwards the predictive performance of the rules returned by the two algorithms (C4.5 and RIPPER) is presented in Section 7.2. Finally, the interpretability of these rules will be examined in Section 7.3, and a more general discussion on how the system affects energy management is made in Section 7.4.
Bandwidth utilization & response times
The infrastructure deployed in the individual residences is composed of devices with very limited resources. The proposed system is considered to take advantage of the installed broadband connection of the house, if available. Therefore, the utilization of the user’s bandwidth, as well as the total traffic generated in the VPN server supporting the whole operation should be carefully considered. Various tests were also performed to examine the response time of the system. An important factor affecting this metric is the utilization of the limited CPU and RAM resources of the SBC employed. The status of the gateway of the prototype test-bed was monitored in a normal state where no user requests or RECAP updates were performed. This represents the normal operation of the gateway where it monitors the network devices, stores the collected information and performs the policy engine reasoning. The average CPU utilization was found to be around 9.8%, while the average active RAM utilization lied at about 38.5%. These measurements demonstrate the light weight solution.
In Fig. 10, the inbound and outbound traffic distributions are seen for the VPN server over the period of a month. Only the HG installed in the prototype test-bed is considered. However, real-world conditions were applied, where the generated traffic includes updates in the gateway’s firmware, apart from collecting the generated sensor data. The sensor data on the other hand, are collected by RECAP every two hours.
Naturally, the inbound traffic in the VPN server network interface exceeds the outbound and it lies very concisely in the area just below 500 bits/s. This is mainly caused by the 2-hour sensor data uploading operation to the RECAP. On the other hand, the inbound traffic relates to the data sent to the HGs, such as firmware updates and remote login for monitoring and testing. This is why two local maximums can be seen in the probability distribution of Fig. 10, one at around 200 and one at around 300 bit/s.

The inbound and outbound traffic probability distributions over a monthly period.

Delays for the execution of commands on the smart gateway.
The response delay of the gateway was measured in two use cases. The first one considers the amount of time spent while redeploying rule scripts on the policy engine of the HG, while the second one deals with the delay until a Zigbee command has been successfully completed by the system. According to the firmware of the HG’s Zigbee module, every command generates an output, whether it has been completed successfully or not. So the time from which a user requests a command from the web-interface, until the web-browser (using Javascript and AJAX) receives a response was measured. For both experiments 100 measurements were performed, and their distributions in milliseconds are depicted in Fig. 11. The policy engine script re-deployment is quite concise and usually takes about 0.5 seconds. The time for an action to be completed though, has a wider distribution and usually takes longer. Action requests are seen to take almost up to 1.2 seconds. This is caused by the traffic of the Zigbee network, the amount of commands being processed simultaneously, as well as the response time of sleepy Zigbee devices.
In this section, the predictive performance results for the rules produced by the two algorithms tested in this work, C4.5 and RIPPER, are presented. Experiments took place over the one month dataset mentioned earlier, by using 10-fold cross-validation. Cross-validation was used to avoid overfitting and to increase generalization of the models [9,17].
It should be mentioned that each algorithm returned a quite high number of rules: C4.5 returned 28 rules, and RIPPER returned 11 rules. However, as was explained earlier in Steps 5b and 5c in Fig. 8, two of the post-processing steps are pruning the

Rule 1 returned by C4.5 for Device 2.

Rule 2 returned by RIPPER for Device 3.
Results are summarised in Tables 2 and 3 for C4.5 and RIPPER, respectively. Each table consists of 6 columns. Results are presented by device and by individual rule, so the first two columns present the device and rule number, respectively. As explained in Section 5.3, the results are presented in a per device basis, because each algorithm is run per device, so that it creates rules that are specific to the device at hand. Then, the next four columns present the following statistics: accuracy, precision, recall, and F-measure.
It can be observed in Tables 2 and 3, both C4.5 and RIPPER have performed equally extremely well in terms of accuracy, since all rules returned an accuracy above 99.9%. One should keep in mind however, that this success rate is ‘inflated’ by the high number of
With regards to the precision and recall metrics, results vary per algorithm and per rule. As it can be observed in Tables 2 and 3, there are certain rules that are doing extremely well in terms of precision, but not in terms or recall (e.g. C4.5: Device 1, Rule 1), and other rules that have a similar performance in both metrics (e.g. C4.5: Device 2, Rule 1). Overall, C4.5 returned an average precision of 75.25% and an average recall of 70.84%, while RIPPER returned averages of 81.29% and 46.39%, respectively. Finally, the F-Measure offers ‘combined’ information over precision and recall, as it aggregates their results. We can observe that for C4.5 the average
Summary results for selected rules of C4.5
Summary results for selected rules of RIPPER
Based on the above results, one could argue that C4.5 is preferable to RIPPER, since they have similar performance in terms of accuracy and precision, but C4.5 has better results in terms of recall and F-measure. However, one would have to look into the actual rules and judge if they are meaningful in a real-life situation. Figure 12 presents Rule 1 returned by C4.5 for Device 2. As it can be observed, this rule evaluates the boiler temperature from two different sensors, and advices to turn off Device 2, which is a radiator. However, there is no correlation between the boiler temperature and the radiator. Thus, this rule was coincidental, and should thus be discarded as a non-meaningful rule.
On the other hand, rules returned by RIPPER are found to be much more meaningful. To illustrate this, Fig. 13 is presented, which shows the rule returned by RIPPER for Device 3. As it can be observed, this rule advices to turn off Device 3, which is the TV, if the time is 01:00 am. This in fact was a rule that had previously been entered in the policy engine, and RIPPER successfully managed to uncover.
From the above, it can be concluded that user-comprehensible rules are extremely important. In fact, since the user is eventually going to be receiving the rules and manually evaluating them, it needs to be ensured that the rules returned are easily interpretable and comprehensible. Thus, the next section looks into the interpretability of the rules of each algorithm.
In order to quantify the interpretability of the discovered rules, a measure called prediction-explanation size [19] is used. This measure is defined as the average number of attributes-conditions (e.g.,
Table 4 presents the prediction-explanation size for C4.5 and RIPPER, under each device, the lower the value, the better the algorithm performance. As it can be observed, RIPPER outperforms C4.5 in all three devices for which they returned rules. In addition, C4.5’s prediction-explanation size is bigger in a magnitude of 3 for Devices 1 and 2, and in a magnitude of 2 for Device 3. Hence, the rules produced by RIPPER are more easily interpretable than the ones returned by C4.5.
Prediction-explanation size for C4.5 and RIPPER
Prediction-explanation size for C4.5 and RIPPER
Section 7 presented a set of experimental results generated from the prototype test-bed deployed. The system’s operation was shown to be quite light with relatively fast response times. In terms of the behavioural pattern extraction, various classification problem algorithms can be employed, provided that they generates rules that can be translated into the employed PDL. This however, lies beyond the scope of this paper, as our goal was to present the infrastructure and not look for the optimal classification algorithm. Two of the most well known examples (C4.5 and RIPPER) were tested. The interpretability of the discovered patterns (rules) was identified as significant metric of rule suitability, since it is directly relates to the comprehensiveness and usability of the produced output. In general, the computational time to return the classification rules for a 10-fold cross-validation was very fast, and took less than 1 minute per algorithm. Of course, this time depends on the length of the dataset used for deriving the rules. In our experiments, the one month dataset contains approximately 80,000 entries.

The average daily electricity consumption distribution.
In terms of energy management, users, especially of different age groups and in different locations, tend to have quite diverse daily habits. Disregarding that, while making energy related decisions, may lead to low user satisfaction and thus, complete failure of the energy consumption reduction effort. On the other hand, personalized energy reduction strategies can be much more specific and effective. Figure 14 illustrates the unique energy fingerprint of the monitored residence, depicting the average electricity consumption during the examined period, in the monitored household. The consumption displays two local maximums, one around 11:30 am and one at about 10:00 pm. The first is caused mainly by house chores like cooking and cleaning, while the latter is driven by consumption related to the lighting, cooking, heating and TV usage. Based on the general knowledge provided by the sensor data collected, there are a number of procedural steps to be taken, while devising an appropriate consumption reduction strategy.
First the user’s habits should be identified.
In the second step, advice for energy management can be offered using the DANCER messaging capabilities (Section 4.1.1). For example, if it is detected that the kettle is widely used, the system can suggest that the user should boil only the required amount of water. Generic advices on devices that might not even be used, can lead to confusion and take the focus away from advices that could actually prove helpful.
In DANCER, policy rules conforming to the user’s behavioural patterns can also be devised to reduce the wasteful actions of the user. In addition, other generic rules can also be suggested (e.g. turn-off lights in a room when no-one is present), provided they don’t conflict with the user’s behavioural patterns.
In the final step, the residents/users need to approve the devised strategy and even alter it, according to the their liking. This ensures that the individuals affected by the system’s operation have the ability to accept or reject the feedback.
The second and third steps of the construction of the energy management strategies are exactly the point where personalization is required. A fully generic output would normally cause great inconvenience if the provided energy saving rules did not take into account the user’s preferences. For example, one of the rules generated by JRip dictates that between 10:33 and 10:34, the thermostat should be turned on with the set-point adjusted at about 20–22C°. In these cases, the set-point could be further lowered by a degree, without any major difference in the perceivable user comfort levels.
This document focused on the architectural design and individual software components of the DANCER energy-monitoring gateway. Initially, the whole system architecture was outlined. Afterwards the general software design of the gateway was described and the initial prototype system was introduced. One of the main components of the gateway is the middleware, which enables the communication between the gateway and all other local or remote software modules. On top of the middleware a number of software services such as the LESDMA and the Behaviour Pattern Extractor are running, enabling the energy saving, automation and learning functionality of the system.
This work, apart from presenting the architecture and components of the gateway, also demonstrates the variety of tools and technologies that were required to create the described system. Additionally, it stresses out that for a successful home energy monitoring and automation system, modularity and extendibility, as well as being user-centric are a necessity. The proposed solution meets these criteria, as it can devise energy saving policies in a per user/device basis and also has the ability of being deployed in a single gateway, or being placed in multiple physical locations.
It has been demonstrated that the DANCER system requires minimal bandwidth, while it provides quick response times to the user’s commands. These are all necessary requirements when the user satisfaction is involved, but also influence the scalability of the system. The behavioural pattern detection mechanism is performed off-line in the RECAP server, employing classification algorithms such as C4.5 and RIPPER. Both tested algorithms, demonstrated excellent accuracy levels; this was mainly owed to the fact that the user actions are quite sparse. Therefore, the also considered F-measure metric proved to be much more helpful in determining a rule’s suitability. In terms of interpretability, it seems that the RIPPER algorithm creates much more concise and comprehensive policies that are more suitable for the employed scenario. Consequently, these preliminary results indicate that it would be more suitable for a larger scale deployment. Nevertheless, it has already been mentioned that also other machine learning algorithms could have been incorporated. It was however, beyond the scope of the research agenda to look for the optimal learning algorithm. This work focused mainly in the capabilities of the behavioural pattern extractor of RECAP.
As far as future work is concerned, it is planned to investigate the possibilities for conducting detailed studies relating to different aspects of the system, such as visualisation or the security of the middleware API. Additionally, the deployment of DANCER is planned, over a larger number of residences and monitor the energy consumption behaviour of the users. The project is already in collaboration with the Croydon District Council, which has provided the team with access to several recently built smart metered dwellings meeting a minimum standard of Code for Sustainable Homes (Level 4). Finally, various other behavioural pattern extraction methods will be examined, employing techniques such as genetic algorithms and neural networks. Since human behaviour is known to be hard to model, this operation will pose an interesting challenge to the project.
Acknowledgments
The work presented in the paper was funded by UK EPSRC project DANCER (EP/K002473/1; EP/K002643/1). The authors would also like to thank the Telegesis team for their most valuable advices.