
Abstract
Advanced automation is needed in future mobile networks to provide adequate service quality economically and with high reliability. In this paper, a system is presented that takes into account the network context, analyses uncertain information, and infers network configurations by means of probabilistic reasoning. The system introduced in this paper is an experimental platform integrating a mobile network simulator, a Markov Logic Network (MLN) model, and an OWL 2 ontology into a runtime environment that can be monitored via a Resource Description Framework (RDF) – based user interface. In this approach, the OWL ontology contains a semantic representation of the relevant concepts, and the MLN model evaluates elements of uncertain information. Experiments based on a prototype implementation demonstrate the value of semantic modelling and probabilistic reasoning in network status characterization, optimization, and visualization.
Keywords
Introduction
Mobile networks are a part of a critical infrastructure, facilitating wireless access to Internet with all its services. The number of users, devices, and applications is expected to continue to grow [9]. A dramatic increase in the number of Internet of Things (IoT) endpoints is expected [24]. The advent of IoT is one of the most important drivers for fifth-generation (5G) mobile networks. Consequently, 5G networks need to cater for an increase in data volume and massive growth in the number of terminals served. Furthermore, 5G networks also need to support services with requirements of a new kind, such as ultra-low latency and high reliability [24].
Networks need to be configured optimally to provide customers with high service quality at a reasonable price. Manual network configurations employed in the past make per-cell optimization unfeasible in practice. Given the growth in the complexity of networks, more automation is needed from Operations and Support Systems (OSS) [16], a collective term for capabilities used for managing mobile networks.
State-of-the art operability in fourth-generation networks (4G) is based on the concept of Self-Organizing Networks (SON), which amounts to a set of closed-loop agent systems reacting to measurements, typically by means of a fixed model [16]. Each agent is an implementation of an operability use case. The challenge with this approach is creating and maintaining up-to-date models in view of geographic and temporal variety across cells in radio access networks.
The application of autonomic computing to various areas has been envisioned to the mobile networks with new architectures and software components [14–16]. These capabilities are based on architectures which support learning and adaptation to context-specific situations by means of Machine Learning (ML) algorithms, knowledge representation, and reasoning with knowledge bases [14–16].
Machine Learning is expected to increase the level of automation in the OSS area, for example, by improving the analysis of traffic patterns and cell-related data to learn statistical correlations. Another application of ML is SON verification [8], where learning capability is used for identifying effective solutions. The output of a stand-alone ML system can be characterized as hypothetical in contrast to the deterministic results of a traditional rule-based system. This paper will argue that an effective approach to utilizing ML in the complex environment of future mobile networks involves both classical and probabilistic reasoning.
In this paper, a new approach is proposed to automate mobile network management by using statistical relational learning with a Markov Logic Network model (MLN) [32] for handling uncertainty in mobile network analysis. An OWL 2 ontology is used to complement the MLN model by providing global meaning and a semantic description of the system. The ontology is currently used as a semantic storage with a SPARQL interface for the MLN model and for an RDF-based faceted graphical user interface (GUI). In summary, the practical reason for combining semantic technologies with probabilistic reasoning is the decrease the complexity in monitoring of the MLN model and to making it dynamically modifiable.
To enable a human user to monitor and understand complex network management operations, intelligent storage and presentation of data is needed [22]. In this work, the OWL 2 model targets this issue with a semantic representation of the network state and the related automated configurations. The use of a formal knowledge model which supports automated reasoning reduces the need for case specific software design and implementation, and provides a mechanism for assessing the degree of consistency of the relevant models. Suitably chosen probabilistic reasoning accommodates partial and conflicting data, which would be challenging to address using subsets of First Order Logic (FOL) alone. Additionally, it has been argued that knowledge models bring benefits as a basis of future telecommunication systems both in view of systems design and from the perspective of value networks [30].
The paper is structured as follows: First, the approach is presented in Section 2 and an overview of the system is given in Section 3. After that, Section 4 presents the concept of MLNs and how they are applied to our implementation. Section 5 describes the OWL 2 model and Section 6 presents the RDF-based GUI used to monitor the MLN reasoning. Section 7 presents experiments with the system, such as the evaluation of the MLN reasoning, the affection of the MLN model size to execution times (MLN reasoning and SPARQL queries), and use case examples of the GUI. Finally, Section 8 discusses related work and Section 9 concludes the paper and presents ideas for future work.
Approach
The radio access network of a mobile network domain is composed of cells. In terms of hardware, cells have base stations having dedicated transmitter/receiver (TRX) units, each serving a sector of the cell. Each base station serves a number of terminal devices, known as User Equipment (UE) in industry terminology. Terminal devices may roam across cells and their traffic characteristics (uplink/downlink) traffic may vary depending on the services used.
Mobility and traffic characteristics exhibit diurnal and weekday variations. Additionally, the patterns vary according to the location of the cell in question; a suburban cell may be expected to have the highest loading outside of business hours, whereas the opposite is true for a downtown cell in a business district. There are longer term trends relating to varying usage patterns of services and residential/business user densities. There are also short-term variations due to special events like concerts or sports events.
Given the complexity and variability of network loading, it is difficult to try to optimize network status as one entity. In 4G networks, SON agents execute specific use cases in a limited scope (one or a few cells), performing automated configurations based on measurements. A run-of-the-mill implementation of SON agent utilizes a fixed model. This works well when the model reflects the situation of the cell, but becomes a bottleneck in tailoring the behaviour of the agent on cell level when cell characteristics vary.
Automated adaptation is the next step beyond the fixed model. An approach utilizing Case-Based Reasoning (CBR) has been utilized [7,33]. Interpolation across cases is an enhancement, but is nevertheless limited by the case base.
We study the use of probabilistic reasoning in coping with complexity and adaptability. Instead of using a rule or case base, this system is driven by formulae for reasoning performed over facts about system status. In addition to raising the abstraction level of implementations, a suitably chosen method also supports incomplete and conflicting data, which classical reasoning cannot address.
System overview
Components
The architecture view of the system used in this article is depicted in Fig. 1. The bottom component is the data source, e.g. cellular network or a network simulator. In this paper, we demonstrate the system with a Long Term Evolution (LTE) simulator.
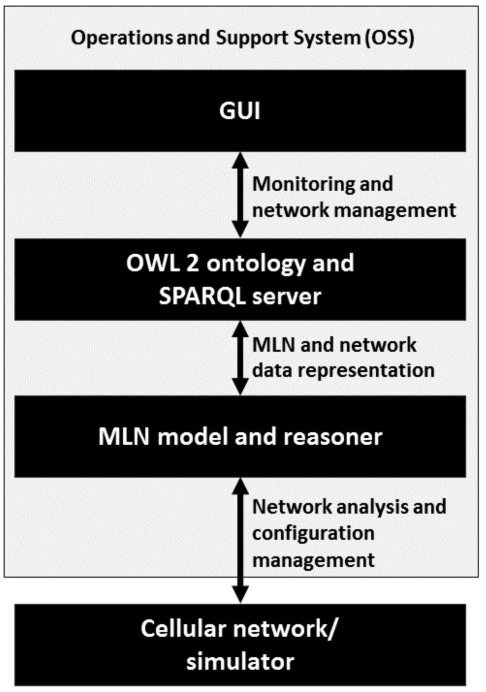
System architecture.
The simulator interacts with the MLN model which analyses the network data and provides data for decision support in the configuration management. The OWL 2 ontology and reasoner are used to create a semantic representation of the network and MLN data and to describe the data as a graph. The ontology is stored in a SPARQL server providing access to the ontology. The GUI is used to monitor and manage the system. In a real network, the three topmost components would belong to an OSS system which manages the network.
The simulation scenario consists of a small urban area (a diameter of 5 km) with 2000 terminals and 32 sectors. In the context of LTE, term “cell” is also used as a synonym for a sector of a base station. The simulator sends performance data that contains measurements from key performance indicators (KPIs) for various cases. KPIs utilized in the system are the number of connected terminals (CUE) per cell, the channel quality indicator (CQI) distribution vector for measuring the signal quality of a cell, and the radio link failures (RLF) for measuring the amount of connection failures per cell. The simulator receives configuration data that contain possible changes in the transmission power (TXP) and angle (remote electrical tilt, RET) of a cell antenna. The data are sent periodically in 15 minute intervals in simulation time.
The MLN model analyses the CUE, CQI, and RLF measurements and infers posterior marginal probabilities for potential network configuration changes in order to optimize the CQI and RLF metrics. A fit of model parameters of the MLN reasoner is performed to historical performance data and past executed configuration actions. The OWL 2 ontology is constructed by transforming the MLN reasoner model into a semantic representation that can be utilized as an RDF graph in a SPARQL endpoint. An operator interface for managing the system and the underlying mobile network is implemented on top of the SPARQL endpoint with HTML5 based GUI.
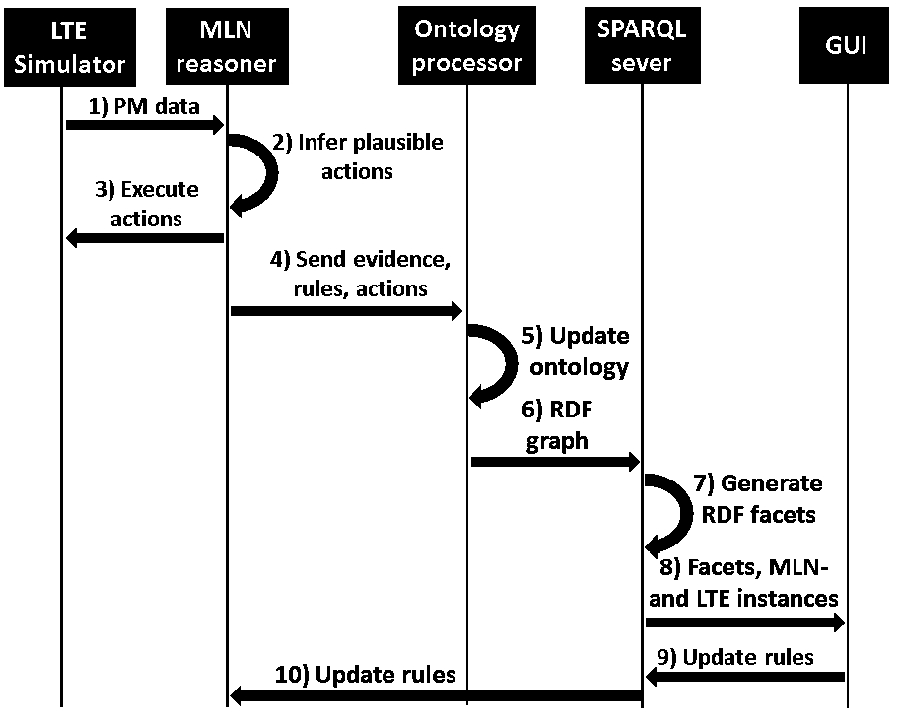
Data sequence diagram for managing a mobile network (simulator) with system components.
Figure 2 depicts the data sequence between system components starting with a measurement report from the LTE simulator on the left. The simulator sends the MLN reasoner performance management (PM) data (1) periodically. The reasoner processes data into its evidence (classified KPI values, such as low, moderate, and high CQI) and infers the probabilities for network actions (2) from them. Then, the reasoner sends a set of action proposals (configurations with high probabilities) to the simulator (3). In addition, the MLN reasoner sends further data, including evidence, formulae, and action proposals to the ontology processor (4), which processes the data into RDF and populates the ontology with new network- and MLN-related instances (5). The RDF graph is then uploaded into a SPARQL server based on Fuseki1
Definition
MLNs allow uncertain and contradictory knowledge in a first-order logic (FOL) subset model by introducing a weight parameter for each formula in the FOL subset knowledge base. The weighted set of formulae defines a template for a Markov network, where the features and feature weights are determined by the formulae and formula weights.
A Markov logic network L is a set of pairs
Each state of the variables in a Markov network
Given an MLN L and a set of constants C, the most likely state of the world can be inferred,
However, a typical inference task is to deduce the most likely state or marginal distributions for a subset of the variables, called query variables, using the values of (some of) the rest of variables as evidence. Given the values
As Richardson and Domingos show [32], exact inference over an MLN model is infeasible in practice. Instead, they introduce an efficient approximation algorithm for this problem using stochastic simulation.
Weight learning
The weights of an MLN model can be learned from one or more databases. A database is effectively a Boolean vector stating the observed truth values for each ground predicate. Given a database (or databases), the most likely weight values are those that maximize the probability of the database given in Eq. (1). The standard method for maximum likelihood estimation (MLE) is the gradient descent method. However, computing the gradient of the probability in Eq. (1) requires computing the estimated number of true groundings for each formula, which is infeasible, as shown by Richardson and Domingos [32]. They propose a solution using gradient descent for optimizing the pseudo-likelihood [4] of the ground Markov network.
Typically, in optimizing the weights of an MLN, it is known in advance which of the predicates in the model will be used for querying and which will be used as evidence. In that situation, Lowd and Domingos [23] propose a discriminative learning solution where they use a gradient descent algorithm to optimize the likelihood of the conditional probability, as given in Eq. (2), instead of the full joint probability, given in Eq. (1). They show that this solution outperforms the solution based on pseudo-likelihood.
Application in OSS setting
Structure of the model
The MLN model of the system is defined in terms of three types of predicates:
Context predicates reflect the current status of the relevant network scope and its environment. A context predicate can indicate, for example, that a KPI value for a cell is currently below the acceptable level, or that two cells are neighbors in the network topology. Objective predicates indicate required changes to KPI values to achieve performance targets defined by the operator. For example, an objective predicate can indicate that a particular KPI value for some cell is too low and needs to be increased. Action predicates indicate changes to network configuration parameter values.
Each predicate represents an attribute of a cell in the network or a relation among the cells. The domain of a predicate can be either the set of cells or an n-ary Cartesian product of the set of cells.
The MLN model is composed of formulae with these predicates. The formulae are intended to describe a correlation between a set of Objectives and a set of Actions in a certain Context. A typical inference task is to query for appropriate actions using the current context data and objective requirements as evidence. Therefore, the formula format is defined as
Above,
The values of the context predicates are computed from the PM data measured from the LTE network. For numerical data, the measurements need to be first classified, for example to low, moderate, and high classes. When values for the action predicates are inferred, the values of the objective predicates are derived from the classified PM data according to performance requirements set by the network operator. For example, if the CQI value measured for a cell is classified as “low”, the derived objective could be to increase the CQI for that cell. On the other hand, when the weights of the MLN model are learned from a database of historical PM and configuration data, the objective predicate values are computed by analyzing realized changes in PM values. In a similar way, the values of the action predicates are computed from changes in configuration data.
After the weights are defined for the MLN model (either learned iteratively or set by an expert), the most likely state of the action predicates can be inferred. Furthermore, the network can be configured according to the inferred action predicates values, because they give the best possible solution with respect to the model. The model weights can still be adjusted by configuring the network with respect to the marginal probabilities of actions and monitoring performance changes. In this manner, the model is dynamically adapted to the network situation.
Inference example
Let L be a simple MLN model consisting of the weighted formulae defined in Table 1.
Examples of weighted formulae in the MLN model
Here the variables c and d denote cells in the mobile network. I is a context predicate indicating KPI category, N is a context predicate indicating the neighborship of two cells, O is an objective predicate indicating a change in a KPI value and A is an action predicate indicating change in a parameter value. Suppose that there is a mobile network with two neighbor cells named
Marginal probabilities for cell configurations
The CQI, CUE, and RLF KPIs are measured for each cell. RLF and CQI characterize the performance and CUE is an indicator of the cell load. To facilitate usage across varying load levels, RLF value is normalized by dividing it with the CUE value. Furthermore, to get a scalar value from the CQI distribution vector, the average channel efficiency is computed using the CQI vector values as weights for the channel efficiency values of each CQI class as defined in the technical specification [13]. For simplicity, these two aggregate metrics are referred to as RLF and CQI, respectively.
For the MLN model these three metrics, CUE, RLF and CQI, were classified as low, moderate, or high. The context predicates of the model describe classified values for these metrics for a cell variable. Furthermore, another context predicate was introduced describing the neighborship status of pairs of cells.
Objective predicates were introduced for the RLF and CQI metrics. For inference, the values of the predicates were computed according to operator goals from the context predicate values so that if the RLF value was high, the objective was to decrease the value, and if the CQI value was low, the objective was to increase the value. For weight learning the objective predicate values were computed from the realized changes in the numeric RLF and CQI values.
For the network configuration parameters, RET and TXP, action predicates are introduced to indicate a fixed-size decrease or increase of the value.
Algorithm 1 shows how weighted formulae are generated. The pseudocode illustrates updating the set of formulae; after a combinatorial generation of formulae, all unachievable formulae are removed from the model. A formula is unachievable, if a KPI is included in the objective (e.g. decrease RLF) but not in the context (e.g. high RLF). A formula is also unachievable, if it has a KPI value in the context that violates an operator goal (e.g. high RLF), but has not a corresponding objective to change that value (e.g. decrease RLF).
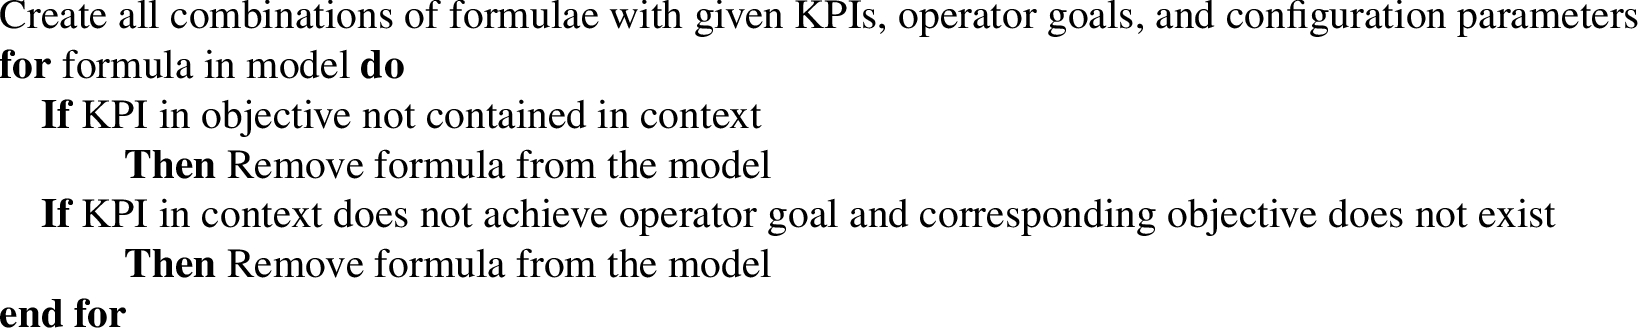
Generating weighted formulae for the model
In addition to creating weighted formulae, some constraints are added to the model, such as: 1) each KPI must have exactly one value, 2) a KPI value can not be both increased and decreased, 3) a parameter value can not be further decreased (increased) from its minimum (maximum) level.
The OWL2 ontology2
The MLN model concepts are linked to mobile network concepts, which helps exploration. Furthermore, this link clarifies the interrelations between the MLN model on the one hand and network state and MLN action inference on the other. An added benefit is that the governance of the MLN model is easier as the network-related metadata is defined for it.
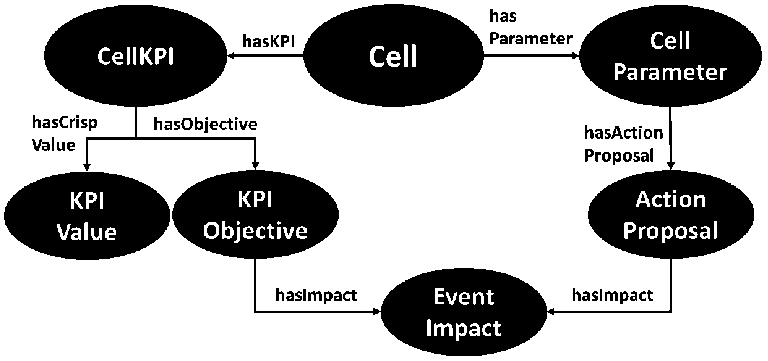
MLN evidence, action proposals, and their cell-related concepts in the ontology TBox.
In Fig. 3, mobile network concepts are described together with MLN evidence and action proposals. The Cell is the most fundamental class in the model and has properties hasKPI to its performance metrics (instances of the class CellKPI) and hasParameter to its configuration parameters (instances of the class CellParameter). CellKPI has a crisp description for its value (KPIValue), such as low, moderate, or high, which is defined in the MLN model. Also, according to the MLN model, a KPI might have an objective defined using the class KPIObjective. KPIObjective in turn has some EventImpact defining the direction of the change of an impact (increase or decrease). The CellParameter can have an ActionProposal, if the parameter needs to be adjusted with respect to the MLN inference. The ActionProposal also has a relation to an instance of the class EventImpact to describe its impact direction.
Formulae
In addition to the evidence and action proposals, the weighted formulae of the MLN model are represented with concepts and mapped to mobile network concepts in the OWL 2 TBox, as shown in Fig. 4. In the OWL 2 model, the “rule” term is used as a synonym for a formula. The MLNRule class defines a formula, which has a numerical value hasRuleWeight defining its weight and relations to formula classes RuleContext, RuleObjective, and RuleAction. The figure also depicts that the formula classes are bound to network classes CellParameter and CellKPI. A RuleAction has a relation to an instance of a CellParameter (such as Txp) and that is bound to an instance of EventImpact class (such as Increase). Similarly, RuleObjective and RuleContext have relations to CellKPI instances, which in turn contain instances of an EventImpact (in case of RuleObjective) and KPIValue (in case of RuleContext).
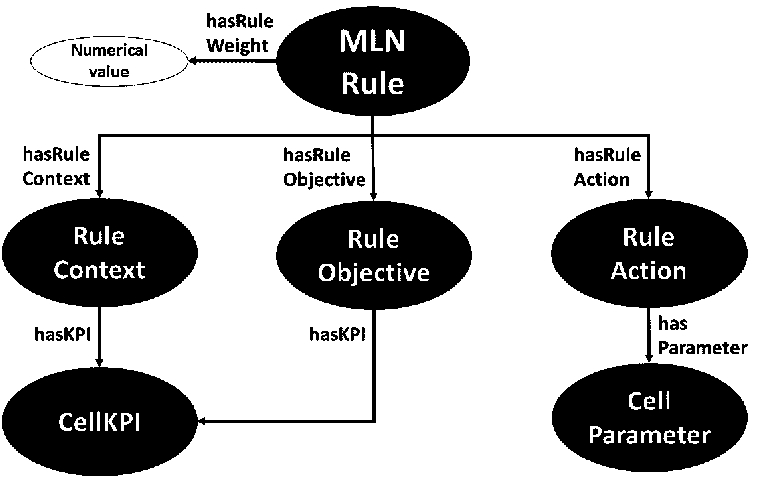
Rules (same as formulae in the MLN model) and their cell-related concepts in the ontology TBox.
To demonstrate the ontology, Listing 1 shows RDF triples representing data regarding the cell with ID 1. The cell has information about the neighboring cells, amount of neighbors, KPI instances (:hasCqi, :hasCue, and :hasRLF are subproperties of :hasKPI), parameter instances (:hasRet and :hasTxp are subproperties of :hasParameter) and facet values that are generated on-the-fly in the SPARQL server. The facets designed for the cell and MLN formula specific data are explained in more detail in the next section.
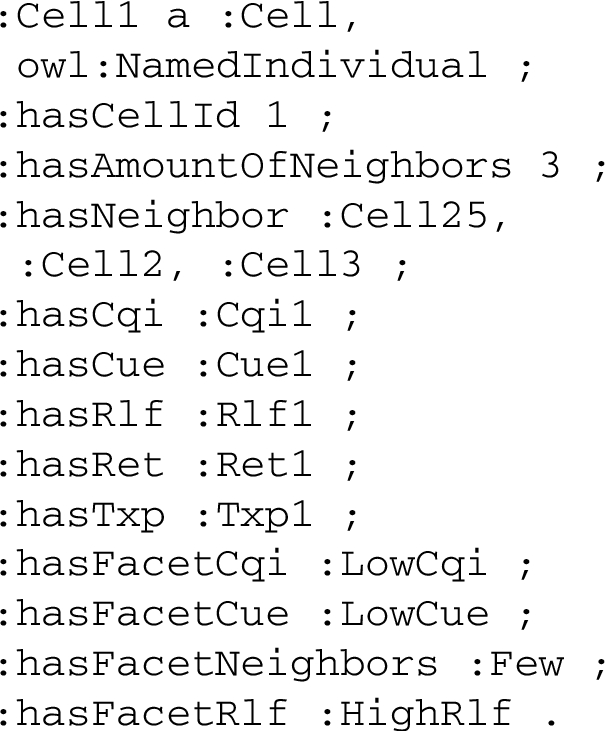
RDF representation of Cell 1 and its related data.
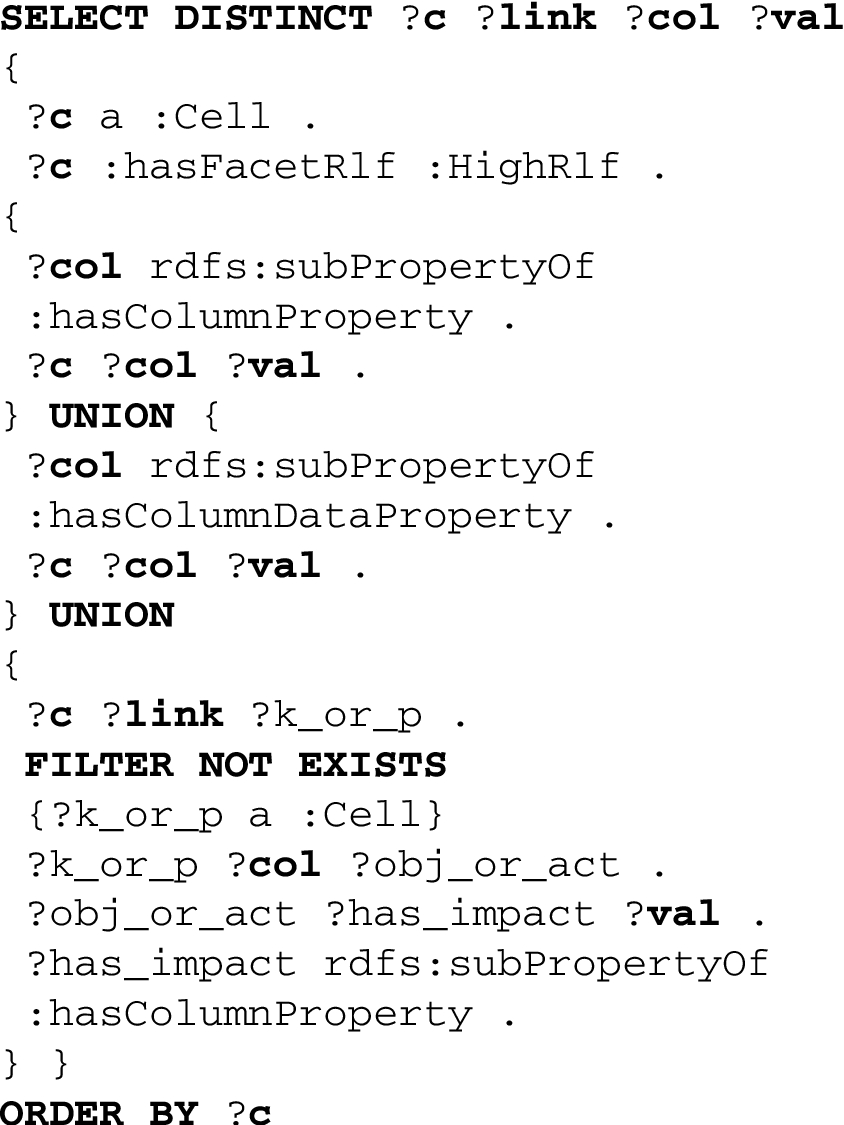
SPARQL query for cell-specific data with facet selection high RLF.
The ontology can be queried with a SPARQL query pattern shown in Listing 2. The query returns cell-specific data for cells fulfilling the given facet selections (high RLF is chosen in this example). The return variables of the query are cell URI (
The query has three union parts, which find column properties (:hasColumnProperty and :hasColumnDataProperty) that specify instances represented in the tabular view of the GUI which is explained in more detail in the next section. The first and second union parts find column properties directly related to the cell, such as :hasFacetRlf and :hasAmountOfNeighbors. The last union part finds instances from the related nodes, such as an objective to increase a KPI value of a cell. The third part also contains a filtering condition that prevents search results from neighboring cell instances.
The SPARQL query returns all cells having a high RLF value. Cell 1 is fulfilling this condition and it is shown as an example in the Table 3. Each column depicts a SPARQL return variable (cell URI (
A snippet of SPARQL query results for the example query. Cell 1 fulfils the facet condition high RLF
The SPARQL query pattern shown in Listing 2 can be used with slight modifications to retrieve MLN formula-specific data. MLN formulae have own column properties defining retrieved values in a different tabular view and facets to filter search results.
The system presented in this paper is monitored via a faceted RDF-based GUI [1] that visualizes the ontology instances processed using the MLN model and supports exploration. The purpose of the GUI is to provide the end-user with informative and interactive tools for evaluating the MLN functionality. Thus, views are implemented to present MLN reasoner-related cell states and MLN formulae.
Figures 5 and 6 show cell states in two alternative visualizations: tabular and graph-oriented. With these views, the user examines how MLN evidence (KPI values and KPI objectives) affects the MLN reasoning outcome (action proposals). In the tabular visualization (Fig. 5), the rows depict cell instances and the columns their attributes, such as classified KPI values (A2), KPI objectives (A3), amount of neighbors (A4), and action proposals (A5). The data describe the current states of cells and thus are based on the latest PM report from the simulator. In the graph visualization (Fig. 6), positioning of cells corresponds to their Cartesian coordinates in the simulator. The arcs in the graph depict neighborship relations between cells and the size of the node depicts the classified value for some KPI in the evidence (CUE, CQI, or RLF). In the figure, RLF value has been selected as the node size from the settings (B2). The color of a node indicates the desired impact of a KPI objective or an action proposal (in the regarding grayscale figure, light gray indicates no action and dark gray an increase). In the figure, TXP action has been selected for the node color and it can be dynamically changed between objectives and action proposals from the settings (B3). Both in the tabular and graph visualization user can interactively browse cells with similar states by selecting facet values (A1 in Fig. 5 and B1 in Fig. 6), such as the amount of neighbors and classified KPI values.
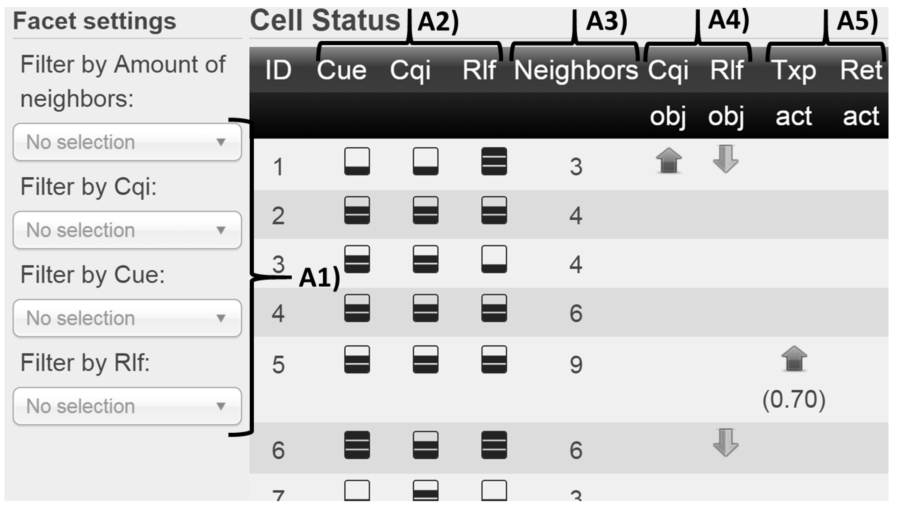
A faceted view for a cell-specific tabular visualization.
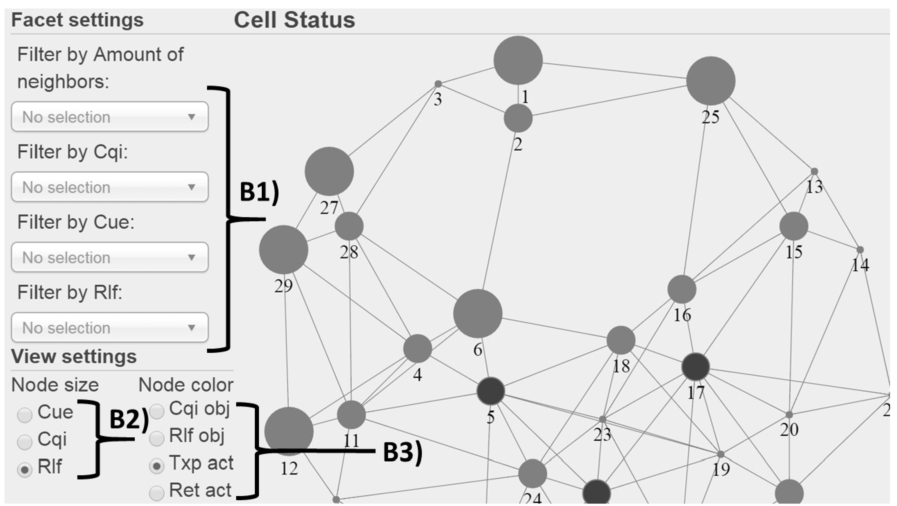
A faceted view for a cell-specific graph visualization.
Figure 7 depicts the weighted formulae in a tabular view by dividing each formula into a formula weight (C5) and the formula classes defined earlier: context (C2), objective (C3), and action (C4). The user examines this view to learn the contents of the formulae and may modify or create formulae in order to change the behaviour of the MLN reasoner. For example, modification can be done by removing a formula or by changing its weight (C6). Facets (C1) in this view are generated as a combination of formula classes (contexts, objectives, and actions) and their objects (CQI, RLF, CUE, TXP, and RET).
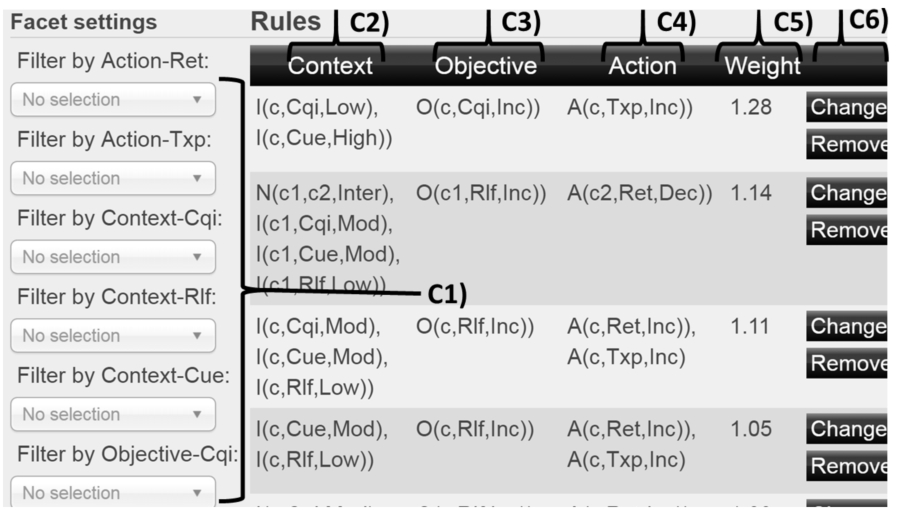
Faceted view for MLN formulae.
Statistical evaluation of the MLN reasoner
The MLN model is used to optimize the performance of a simulated LTE network by adjusting the parameters of each cell simultaneously with respect to PM data retrieved from the simulator in 15 minute intervals (simulation time). Initially, all formula weights of the MLN model were set to zero. The weights were updated after every 48 measurement rounds using the measurements as training data. The Alchemy 2.0 software package [21] is used for the MLN inference and weight learning. The Alchemy implements the marginal inference and discriminative weight learning algorithms described in Sections 4.2 and 4.3.
Figure 8 shows the changes in the total number of RLFs in the LTE network as the model is updated. From the figure can be seen that in the beginning the number increases, as the model weights have not yet been learned. After the weights are first updated, the number begins to rapidly decline and stabilizes after a number of iterations.
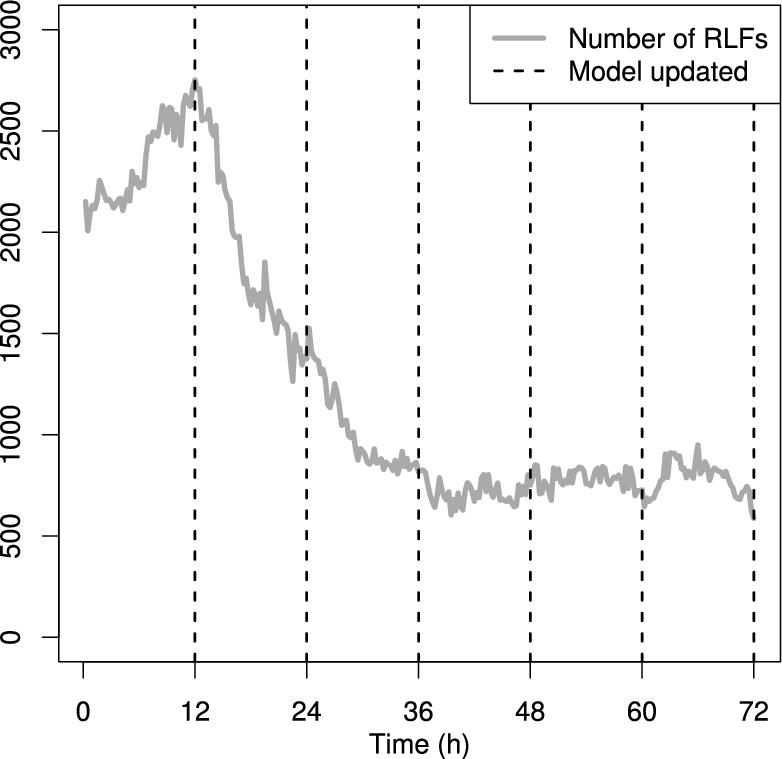
Total number of radio link failures in a 15 minute interval. The vertical dotted lines indicate an update of the model weights.
Table 4 describes the results of some experiments on the impact of model sizes on MLN reasoning and SPARQL query times. In the table, model 1 is constructed with a combinatorial generation of formulae from which unachievable formulae are removed, as defined in Algorithm 1. Model 2 presents the model after formulae with zero weights are removed from the model 1. Model 3 is created by removing formulae having weights less than
Statistics of model sizes and their impact on MLN reasoning and SPARQL query times
Statistics of model sizes and their impact on MLN reasoning and SPARQL query times
To demonstrate the usage of the GUI, a random simulation round is taken from the system and the MLN reasoner and its model is explored via the GUI. First, two use cases are shown for 1) browsing cell states in a table and 2) graph visualization. Then, an example is shown on how modifying the model affects the reasoning outcome.
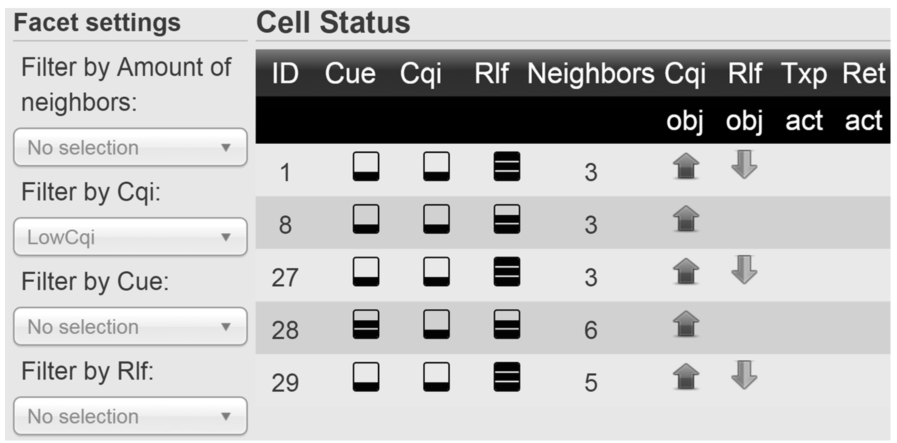
Cells having low CQI.
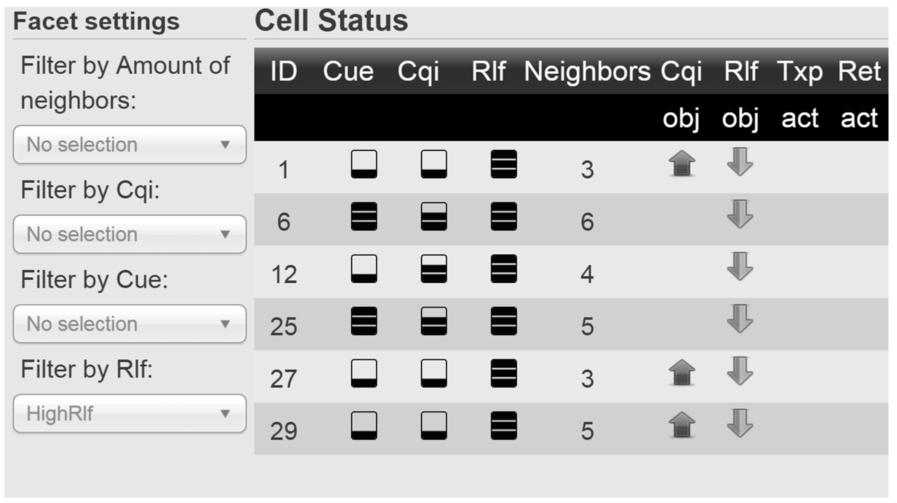
Cells having high RLF.
The cell-specific MLN reasoning data of the given simulation round are presented in Fig. 5. This view can be further examined interactively by selecting facet values. Figure 9 shows that cells having low CQI values (selected as a facet value) also have objectives to increase these values. In the same manner, from Fig. 10 it can be concluded that high RLF values imply objectives to decrease the RLF values. These discoveries relate to the data preprocessing logic of the MLN model (operator goals that need to be achieved), as some classified KPI values (such as low CQI and high RLF in our scenario) trigger KPI objectives into the evidence.
Another finding can be done from the table by selecting many neighbors (9 or more) as a facet value. Figure 11 shows the results for this selection and as it can be seen, all the three cells having many neighbors also have high probabilities (more than 0.7) for increasing their TXPs. As explained in Section 4, the MLN model and its formulae consider the states of neighboring cells as well, which might imply that the number of neighbors affects the probabilities of the action proposals in this scenario. Another aspect to observe from this figure is that these cells have neither an objective to increase CQI nor decrease RLF although actions are proposed to them. This also indicates how dependent cells are on their neighbors.
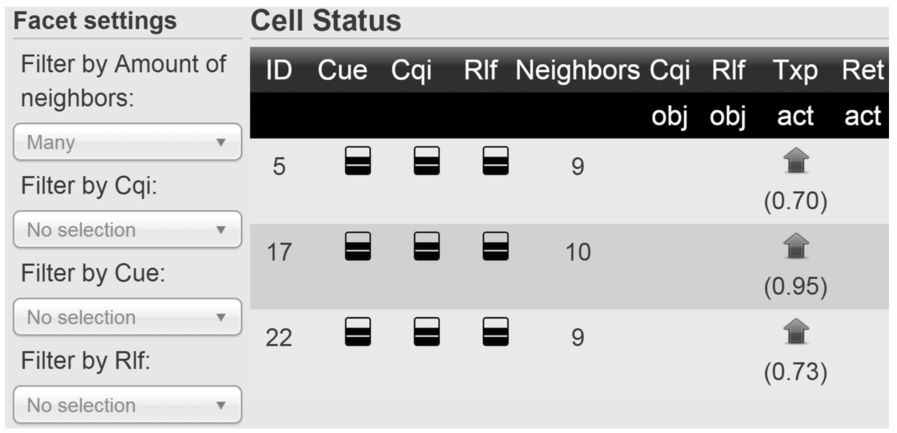
Cells having many neighbors.
Figure 6 showed cell states in a graph visualization, in which node sizes indicate RLF values and node colors action proposals for TXP parameter. Observing this graph more closely, it can be seen that four of the six cells having high RLF values (cells 1, 25, 27, and 29) are located at the edge of the network and have only a few neighbors (five or less). High RLF values of these cells are most likely caused by terminals located at the edge of the network coverage area. Although the whole simulation area is populated by terminals, cells cannot cover the whole area with high signal strength from current cell locations. Thus, these cells most probably have high RLF values regardless of their configuration (even if coverage areas are expanded, new terminals will occur at the new edge of the coverage area). Moreover, the figure shows that MLN reasoner neither proposes configuration changes to these cells nor to their neighbors. This might indicate that the model has learned that the performance is not improved with any action for cells with given characteristics.
Examining and modifying the MLN model
For demonstration purposes, a weight of the following formula in the MLN model is modified:
The weight of this formula is changed from 0.41 to 4.0. The Figure 12 shows cell states for cells having low CQI values after MLN reasoner has recalculated the action probabilities. Compared with Fig. 9, new action proposals have been generated for cells 1, 8, and 27, which implies that the weight update had an effect on the functionality of the reasoner.
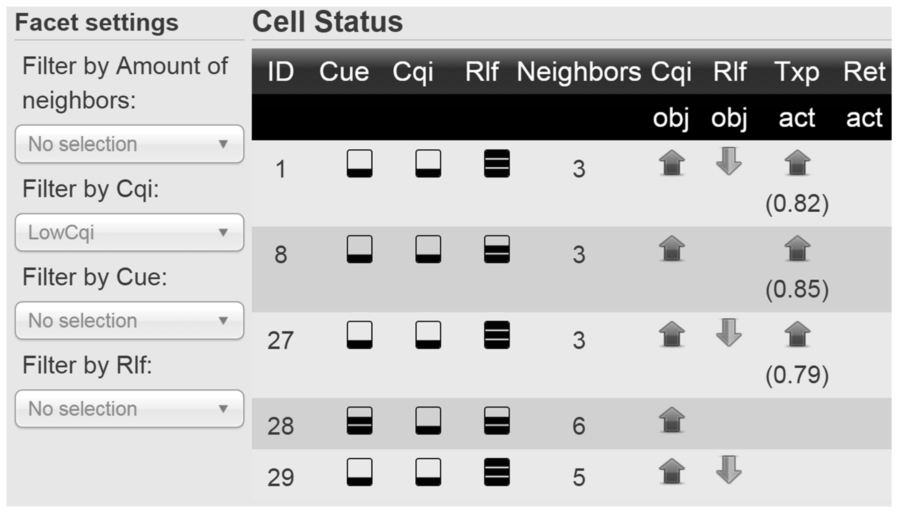
Updated states (actions re-inferred after model update) for cells having low CQI.
The use of probabilistic reasoning in telecommunications has been studied previously. For example, Bayesian networks (BN) have been investigated in automatic network fault management [3,19] and in configuration evaluation [11]. MLNs have been used earlier to diagnose anomalous cells [8] in the network. Ontological modelling has been used together with BNs to evaluate network management activities in [10], which proposes using an ontology to describe domain-specific knowledge which is then utilized to dynamically generate a BN for a context-specific probabilistic evaluation task. To the best of our knowledge, statistical relational models (such as MLNs or a combination of an ontology and BNs) have not been applied earlier for cell configuration tasks specifically. Also, MLNs provide a template from which multiple Markov networks can be analysed. This approach provides more flexibility than a basic Bayesian or Markovian network model.
In the fields of pervasive computing and ambient intelligence, probabilistic reasoning and ontologies have been studied in several works. For example, MLNs are applied to context-aware decision processes in smart home environments [6]. The ontology is used to interpret and recognize situations from incoming data streams and an MLN model is dynamically constructed with respect to ontological knowledge. The MLN model is then used for decision making (smart home activities) from incomplete information [6]. Another project ([17,18]) examined human activity recognition from sensor data; first with MLN [17] and later with a combination of an ontology and a log-linear DL model (a model integrating description logics with probabilistic log-linear models [26]) [18]. Human activity recognition is also considered in another project [31] that uses an ontology to recognize potential human activities and statistical analysis to examine their confidence level [31].
In other problem domains, experiments in combining an ontological approach with probabilistic methods have been investigated. For example, BN-specific projects have use cases for medical decision support [34], financial fraud detection [5], and instance matching in a geological domain [27]. MLNs have been applied with semantic technologies in problem domains for ontology matching [25] and for natural language processing, where ontological concepts are extracted from text [12,28]. Aforementioned studies are not addressing cellular networks or network management tasks and thus they are not fully comparable. Yet, they provide similar technologies and address tasks, such as decision making support and graph analysis, that could be adapted and examined also in our work.
Another statistical relational model used for similar problems as MLN is the Probabilistic Soft Logic (PSL) [20]. It is based on First Order Logic, and provides weighted formulae and probabilistic inference. One application for a combination of ontologies and PSL is in analysing semantic similarities between natural language sentences. [2] Another project utilizes these techniques to extract a knowledge graph from text by using ontologies for representing domain-specific constraints and PSL to infer the most probable meaning for the text as a graph. [29] It has been argued that PSL is more efficient than MLN [29]. Our experiments indicate that MLN analysis can be applied to mobile networks by analysing a limited scope. The analysis of an entire network would in any case be futile for a system having the complexity and dynamicity of a mobile network domain. The comparison of PSL and MLN should be examined more thoroughly in order to conclude their difference in our case.
Conclusion and future work
This paper presented an experimental network management platform that uses MLN to analyse uncertain information from the LTE simulator and to infer suitable actions for the simulator. Along with the MLN model, OWL 2 ontology is used to semantically represent relevant network and MLN concepts. The ontology is utilised with SPARQL queries by the operator (via the faceted GUI) and by the MLN model.
Experiments of the platform in the Section 7 show that the MLN model works well in practice after it is trained to the current simulation context. The average number of RLFs reduced significantly during the weight learning phase. Also, experiments show the importance of monitoring the model; the combinatorial generation of formulae leads to a high amount of insignificant formulae. Removing these formulae with pruning makes both the MLN inference (the calculation of action probabilities) and the SPARQL query executions more robust. A potential future direction is investigating the scalability of the MLN model in larger networks and performing pruning of low-weight formulae in run time.
Some use cases of the GUI were shown to clarify how the MLN reasoning and network status can be monitored in view of this platform. The semantic representation of the underlying data and SPARQL queries provide a versatile access to the data and enable flexible information exploration with faceted browsing activities. Moreover, the SPARQL interface and the GUI provide an easy modification in order to investigate alternative reasoning results.
A further potential future research topic is the enhancement of the OWL-MLN interaction so that the MLN model settings can be dynamically modified by a human or by a description logic (DL) reasoner. Model settings include the selection of measurement variables, their threshold values, and formulae to be generated from the set of variables. Model settings could even include some initial formula weights with respect to prior knowledge. Moreover, the system will be enhanced by creating high-level goals which the user can use to modify the behaviour of the reasoning. For example, high-level goals could be mapped to corresponding MLN model settings.
The reason for combining semantic technologies with probabilistic reasoning was the decrease in the complexity in monitoring of the MLN model and to making the model dynamically modifiable. Our current implementation gives promising results to continue this work in order to enhance the system towards autonomic computing and towards adapting these technologies in more complex scenarios in the field of network management.