
Abstract
Large scale real-time water quality monitoring system usually produces vast amounts of high frequency data, and it is difficult for traditional water quality monitoring system to process such large and high frequency data generated by wireless sensor network. A real-time processing and early warning system framework is proposed to solve this problem, Apache Storm is used as the big data processing platform, and Kafka message queue is applied to classify the sample data into several data streams so as to reserve the time series data property of a sensor. In storm platform, Daubechies Wavelet is used to decompose the data series to obtain the trend of the series, then Long Short Term Memory Network (LSTM) model is used to model and predict the trend of the data. This paper provides a detailed description concerning the distribution mechanism of aggregated data in Storm, data storage format in HBase, the process of wavelet decomposition, model training and the application of mode for prediction. The application results in Xin’an River in Yantai City reveal that the prosed system framework has a very good ability to model big data with high prediction accuracy and robust processing capability.
Keywords
Introduction
Sustainable development of socio-economics and environment requires protecting water quality and reasonably allocating water resources among different users. Wireless Sensor Network (WSN) is widely applied in the field of hydrology and water conservancy [20]. Different from traditional manually collecting data samples for water quality monitoring and analysis, WSN for water quality monitoring is an online method with the following advantage characteristics [1]: (1) intensive sampling; (2) real-time and in-time; (3) distributed acquisition; and (4) longer life span. Sensors are deployed in the monitored waters to collect parameters such as pH, Dissolved Oxygen (DO), water temperature, flow rate and so on. Through converging gateway, data of these parameters are uploaded to upper computers, where they are processed and analyzed.
The whole process of WSN of water quality monitoring is usually divided into four phases: (1) Data sampling; (2) Data transmission; (3) Data processing and analyzing; and (4) Result display. The functions of water quality monitoring systems may be varied due to different business needs and system hardwares. Some systems are required to collect a single index while others may be used to collect multiple indices. The sampling periods may also vary from seconds, minutes, hours to days, or even longer. The obtained data are more accurate when the sampling frequency is higher, but meanwhile the sensor nodes will require higher energy consumption [21]. Therefore, most existing systems have a sampling frequency of 24 times/day [28] and even lower ones. Low frequency can reduce node power consumption and prolong the life cycle of the network, while it is not accurate enough for drinking water detection and sudden pollution alert.
In contrast, if high sampling frequency is adopted, massive data will be generated in large-scale water quality monitoring network. The data generated by a sensor is a time series, which is a grim challenge for a traditional relational database and stand-alone operation data processing system, both in data storage and in real-time data analysis [12]. Consequently, the usage of water quality monitoring systems is limited due to its insufficient abilities of sampling large data series and historical data inquiry. Monitoring systems usually make early warning through analysis of the data changes between current and previous time. However, changes of the sampling data can be caused by the errors of the sensor itself and the instantaneous interference of water quality. Such variations cannot accurately reflect the changes of water quality. In addition, the existing early warning mechanism is realized by regression models and other inaccurate functions, which also result in large errors.
Therefore, the use of a typical WSN for large-scale water quality monitoring has deficiencies in the following four aspects:
The sampling frequency is relatively low;
Data processing efficiency is difficult to meet the real-time requirements;
The error of the regression model is too large to accurately simulate the reality;
Data prediction and early warning functions are not perfect.
A real-time system to monitor and predict the water quality was developed, aiming at solving those four issues. In our system, IoT (Internet of Things) devices are used to collect the data, and Apache storm is adopted as the data process platform to deal with the data stream generated by the sensor network.
Related works
Many solutions to water quality monitoring using IoT technology have been developed since the early 21st century. Zennaro et al. implemented an application of IOT to measure water quality in Malawi [28]. In the system, the sensor nodes took water quality samples at a pre-defined day time interval, and then the sampled data was sent and stored in the gateway station. The sensor nodes would go to sleep after sending the data, and they waked up after a fixed period. In this application, the frequency of data sampling was relatively low, and MySql was used as storage engine for the purpose of data acquisition and statistical analysis. Krish et al. proposed a Supervisory Control and Data Acquisition (SCADA) system integrated with the IoT technology for real-time water quality monitoring [13], which was applied in the Tirunelveli Corporation (Metro city of Tamilnadu state, India). SCADA automatically measured the parameters of pressure, pH, level, and energy by sensors using Arduino Atmega 368, and the sensor data was automatically sent through Global System for Mobile Communication (GSM). SCADA stored the data in DB(Data Base) for data acquisition in the system. Vijayakumar et al. proposed a real time water quality monitoring system [23], in which several sensors were used to measure the physical and chemical parameters of the water, such as temperature, pH, Turbidity, Conductivity and DO. The measured values from the sensors were processed by the raspberry PIB+ model based core controller, and then they could be viewed on internet using cloud computing. Madhavireddy et al. proposed a Smart Water Quality Monitoring System Using IoT technology [16]. The system used microcontroller and the processed values that was remotely to the core controller ARM through a WI-FI protocol to interface the measured values from the sensors [16]. The data continuously updated at certain intervals in the server could be retrieved or accessed from other places in the world. Furthermore, it provided an alert mechanism, where a buzzer would be ON if the sensors do not work or get into abnormal conditions.
However, these systems only focus on real time water quality monitoring, and unfortunately they lack the functions of forecasting and early warning the future situations of water quality. Whereas predicting the situations of future water quality plays an even more vital role for planning and pollution control. However, water quality forecasting needs to deploy sensor nodes widely so as to obtain the parameters of a whole area rather than the local area. Deploying nodes widely will generate great amount of continuous data at high speed, named big data stream. The traditional software platforms cannot deal with such high speed big data stream.
To process these vast amounts of high frequency data, MapReduce has been widely used in cluster environment, where it provides data parallel processing ability to meet the throughput and real-time requirements [11]. Apache Storm is a distributed real-time big data-processing system, and it is designed to process large amount of data in a fault-tolerant and horizontal scalable method. It is a streaming data framework that has the capability of highest ingestion rates [3]. In IoT based monitoring system, the multisource heterogeneous sensor data integration and streaming sensor data processing in real time manner with low latency are key issues [10]. Zhou et al. proposed an efficient streaming spatio-temporal data access based on Apache Storm (ESDAS) to achieve real-time streaming data access and data cleaning [29]. The consumption time in ESDAS is approximately 300 milliseconds for ten thousand records per second for a speeding bolt, and its efficiency is approximately three times higher than that of MongoDB. A Click- Stream Process System (CSPS) was proposed by Jonathan, which focused on the analysis of Wikipedia Clickstream data with Apache Storm. CSPS showed that increasing number of parallel thread would improve throughput. Particularly, it is possible to efficiently stream and analyze stream data, which allows even greater flexibility in prioritizing trade-offs and performance properties of a system [19].
In order to make early warning of the water quality problems, it need get the trend of water quality parameter rather than using the original sample data. Wavelet analysis is a well-known tool used to get the trend of a time series, which decomposes a signal into approximations and details. The approximations are the high-scale, low- frequency components of the signal, from which we can get the trend of the constant data [14]. Consequently, the trend can be used to predict the water parameters with deep learning technology [27]. Wei et al. proposed an integrated approach by using discrete wavelet multi-resolution decomposition and a back- propagation (BP) feed-forward multilayer perceptron (FFML) artificial neural network (ANN) [25]. In their experiment, monthly flow data from three gauges in the Weihe River in China were used for network training and testing for 48-month-ahead prediction, and the result showed that the model was able to significantly increase the prediction accuracy. However, only small amount of data was used in the experiment, thus it need further prove if this method is able to process real time big data stream. Guillen-Navarro et al. developed an intelligent framework based on a deep learning model for early prediction of crop frost to help farmers activate anti-frost techniques in order to save the crop [7]. This framework used LSTM based model to predict low temperature using information from an IoT infrastructure deployed on two plots in Murcia (Southeast of Spain). Three experiments results showed that the average quadratic errors less than a Celsius degree and the determination coefficient
This research complements the current studies in the following two main aspects: (1) A big data platform was developed to process the real time data stream from wireless sensors at temporal granularity of seconds; (2) A wavelet-LSTM model was developed to predict the future trend of water quality and make an early warning for the future water quality problems.
Sytem design
Xin’an River in Yantai, China was chosen as the experimental environment. For the purpose of the experiment, only one monitoring point in a section of the river was deployed. According to the business needs of water quality monitoring, the entire system consists of four parts: the wireless sensor network, the data receiving server, the Apache Storm data processing system and the Web-based data display system. The overall system framework is shown in Fig. 1.

System framework.
IoT computing concept describes the connection of physical objects to the Internet with intelligence to identify themselves from other devices, and it can get the information of physical world and send it to a data process platform. According to the typical IoT architecture, our system is composed of three layers, namely perception layer, network layer and application layer from bottom to top. The perception layer comprises of sensors, the network layer contains standard communication protocol to process information on the required network and application layer. The most important feature of IoT are sensors, which are used for capturing environment information through the connection with online network using specific protocols for communication and information exchange. Currently, the system deploys three types of sensors for getting the parameters of pH, DO and water temperature in the monitored water. The measurement of pH in a water system is of utmost importance, because it is used to diagnose whether the water is acidic or alkaline. Dissolved Oxygen (DO) is another important parameter of water quality, which measures the concentration of non-compound oxygen in water. Too large and too small DO level will degrade the quality of water and cause damage to aquatic life. Besides the chemical parameters, water temperature is another critical factor that affects DO levels, the solubility and reaction rates of chemicals, metabolism, growth, and reproduction, Species composition, Water density and stratification, and whatever. In this connection, water temperature sensor was also adopted in our system.
The perception layer is consisted of WSN nodes, which are generally powered by batteries, and IEEE 802.15.4 is used as the MAC layer to save energy [13]. The typical WSN is used for low-frequency event monitoring, which does not require high real-time data, so it can meet the needs of general industrial monitoring [24]. In the water quality monitoring system, however, water pollution in many cases is an emergency event, which causes spread in a large area in a short time. In this connection, the monitoring system with a sufficiently high sampling frequency is required. Whereas battery power supply cannot satisfy with such requirement. In this case, wireless transmission terminals are used as communication gateways, and solar energy, wind energy, and storage batteries are used as energy supplies in our system. Besides, sensors and wireless gateways are connected by the 485 Bus, and the sensors send the parameters they acquired to the gateway periodically through the Bus. After receiving the parameters, the gateway transmits them to our data center immediately. The monitoring site is too far away from the data center, hence the wireless gateway uses a 4G mobile communication network. In the data center, a socket server response for data receiving and an Apache storm platform is for data analysis and prediction.
In the monitoring system, the data of each monitoring point should be processed to retain the data time attribute, i.e. a continuous data stream, thus it is especially suitable to use the Apache Storm cluster for the process. In order to obtain higher monitoring and prediction accuracy, Trident is used in the system to ensure the data transaction process.
The system consists of two software components, one is a web application for basic data setup, data display and query, and the other is a data processing system. In the data processing system, the data is sent to the Storm cluster through the Socket server, and the Kafka message queue is used as the data communication channel in the middle. To guarantee the real-time and transactional nature of data stream processing, Trident is used in Storm to receive data from Kafka, and then wavelet analysis is used to obtain the trend of the data. LSTM based model is employed to predict the future water quality based on the wavelet decomposed trend. Finally, the data processing results are send to the Web system presentation page through WebSocket service. The software system framework is displayed in Fig. 2.
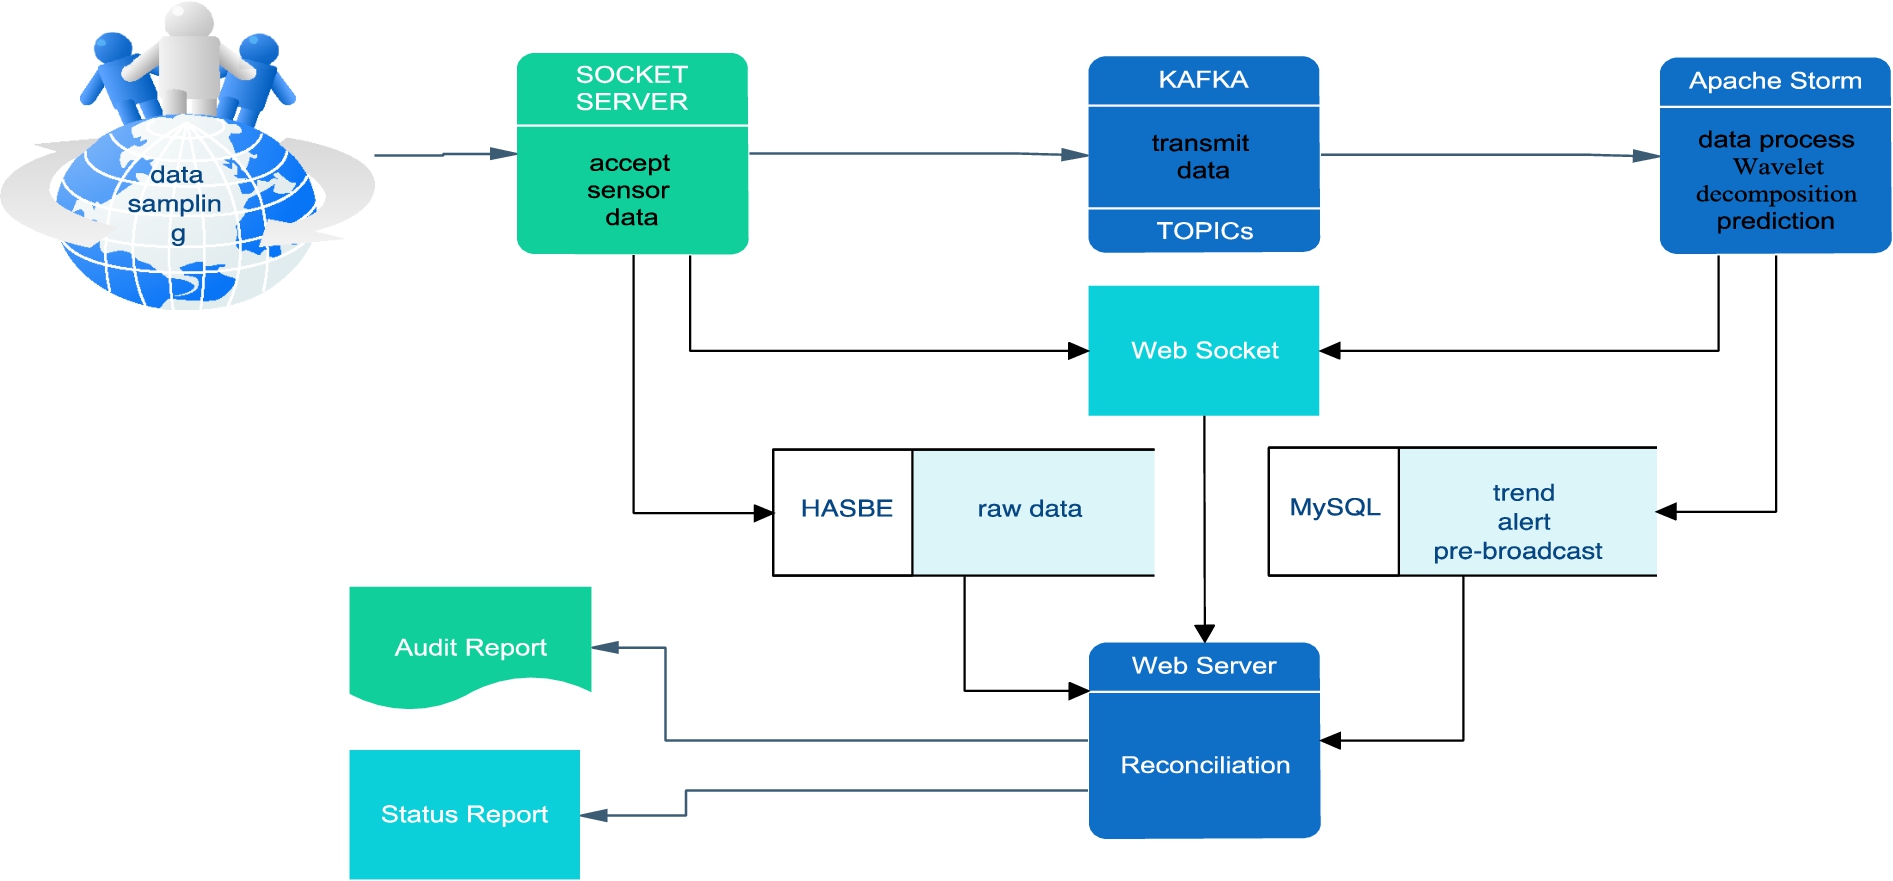
Software architecture.
In the course of system design, we focused on solving the following problems:
Serial data parallelization
Apache Storm is a distributed real-time big data processing system, and it is designed to process vast amount of data in a fault-tolerant and horizontal scalable method. It is a streaming data framework with the capability of highest ingestion rates. By utilizing Storm, it is convenient to execute all kinds of manipulations on real-time data in parallel.
In the view of server, the data from a gateway is data stream in serialized form, but it is composed by the data from several types of sensors. The data stream will be decomposed by wavelet to process the parameters respectively, thus Trident is used to accomplish this process. Trident, an extension of storm, is a high-level abstraction for doing real-time computing on top of Storm, and it can seamlessly intermix high throughput (millions of messages per second), stateful stream processing with low latency distributed querying.
Stream is the core data model of Apache Storm trident, and it is handled as a series of batches. Apache Storm can receive data from many spouts as the source. Firstly, spouts are setup according to the external data source, such as Kafka. Then the streams are created with the same number of spouts. Finally, the streams are merged to one. By using stream, data is treated as a series of batches. Between the nodes in the Storm cluster, Trident handles the input stream and converts the input continuation into consecutive batches containing several tuples to process. Through redirection, each batch is distributed to different partitions for parallelization of data processing [4,22]. If random redirection is used, it will inevitably lead the data from the same sensor being distributed to different partitions, and then to be aggregated, thus the time series attribute of the sensor data will be destroyed and the trend judgment result and the accuracy of the prediction will be affected.
In the system, we create a Topic for each monitoring area in Kafka. The Kafka producers in the Socket Server partition the data according to the monitoring point numbers, and each data carries the sensor number of the monitoring point. Storm creates a consumer Spout with the same numbers of partitions, receives Kafka data and generates a data stream, and then distributes the data stream based on the sensor numbers. In this way, the advantages of Kafka and Storm are collectively used to parallelize the sensor data, and the time sequence of the data is maintained by fully utilizing the cluster computation. The data decomposition process is shown in Fig. 3. For each wireless gateway of the monitoring areas, the system has configured the area number and the monitoring point number. When the wireless gateway forwards sampling data, the water area number, monitoring point number, sensor number, sampling time, and sampling value constitute a data packet.
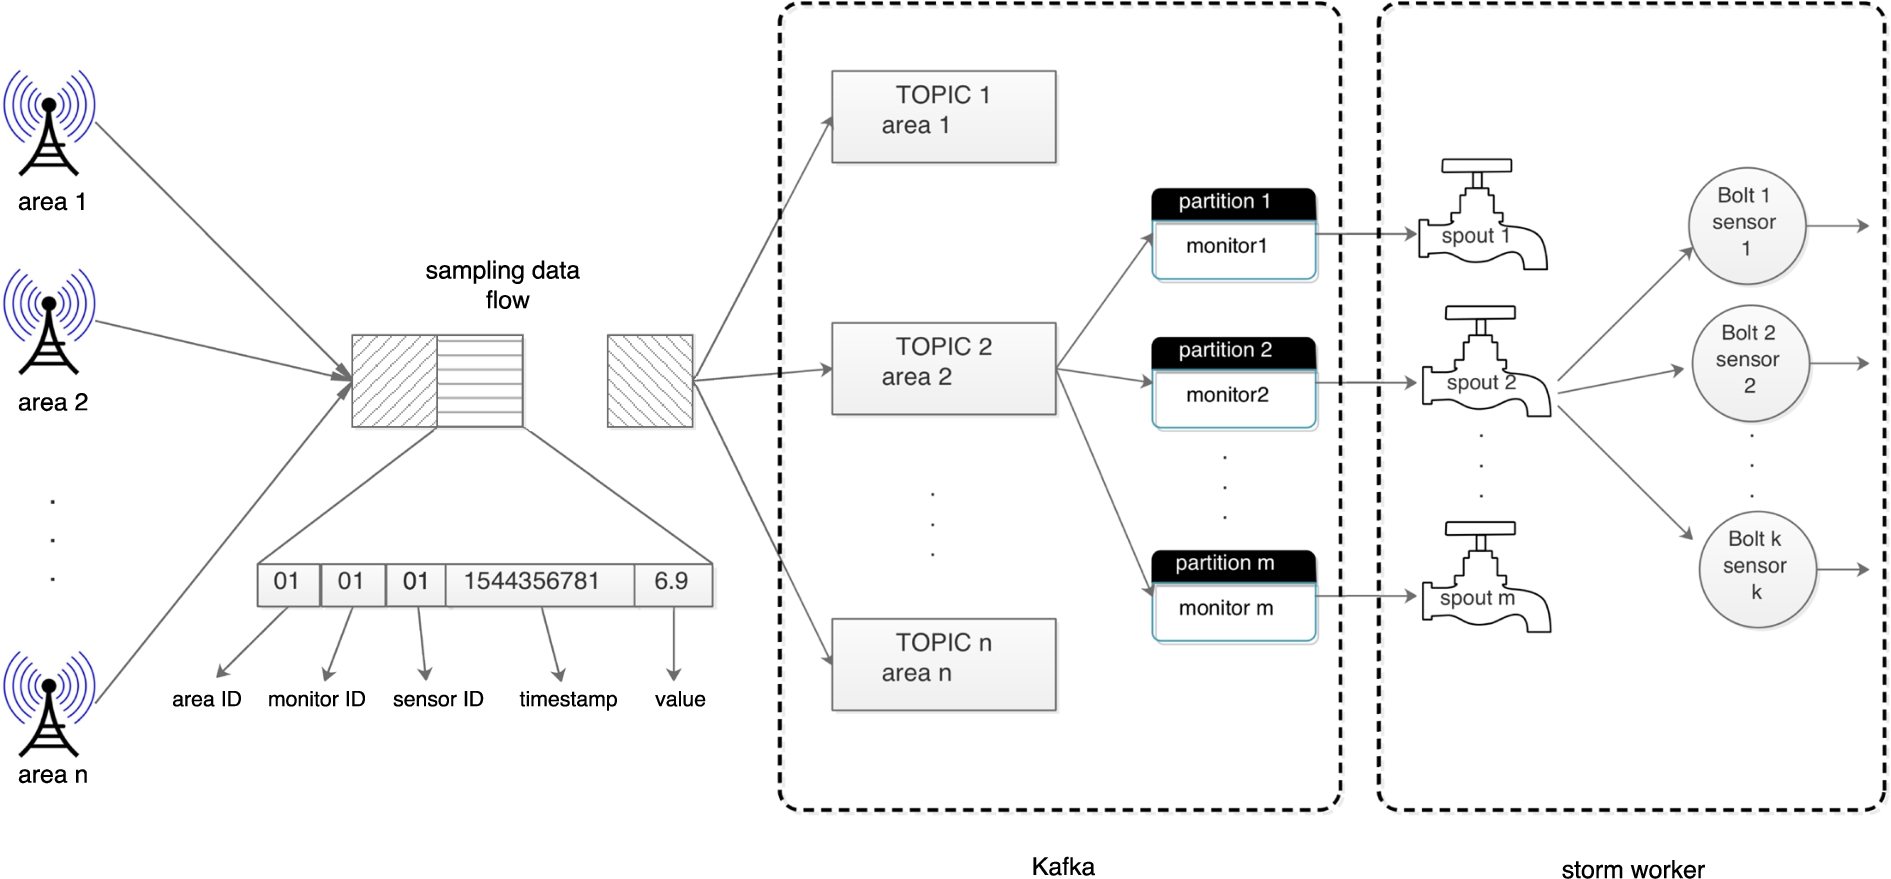
Procedure of data decomposition.
The producer of Kafka sends data to the corresponding TOPIC according to the water area number, and divides data into partitions according to the monitoring point number. The format of the data sent by the gateway is shown as following:
In Storm, the number of Worker of the Topology is established according to the number of TOPIC, while the parallelism of Spout is created based on the number of TOPIC partitions. The data is distributed by the partitionBy method of Storm stream in accordance with the sensor number, and the sampling data of each sensor is processed with a separate thread.
In the water quality monitoring system, the data sampled from an index sensor are usually used to compare with a pre-defined threshold to determine whether the value is normal [1]. Due to the influence of external factors in natural environment and temporary changes of the monitored indices, it is unavoidable to cause errors in these sampled data. This kind of data fluctuation cannot reflect the real water quality; hence it usually results in misjudgment of the water quality situation.
Wavelet decomposition is often used for de-noising analysis of sensor data [5,9,15]. Multiresolution analysis is one of the main functions of wavelet analysis, which was proposed by Meyer and Mallat [17]. It can decompose data sequences into different resolutions in space. A wavelet is defined as a function with a finite interval and a mean value of zero, and it is called the mother wavelet. There is also a scaling function called the father wavelet. Assuming that the signal S has a M samples, the J class Wavelet ID of the signal transform is expressed as [6]:
The data can be reconstructed by inverse transform after using wavelet decomposition:
LSTM model
Most current existing water quality monitoring systems provide only real time monitoring and data query functions. In many cases, it is essential for the system to have forecasting capability and provide users with the future water quality situations in advance.
A Long Short Term Memory Network (LSTM) is a type of Recurrent Neural Network (RNN), and it is specially designed to prevent the neural network output for a given input from either decaying or exploding as it cycles through the feedback loops [8]. The feedback loops make recurrent networks much better in pattern recognition than other neural networks. Memory of past input is critical for solving sequence learning tasks, and LSTM provides a better performance compared to other RNN architectures by alleviating the vanishing gradient problem. Due to their ability to learn long term dependencies, LSTMs are applicable to a number of sequence learning problems including language modeling and translation, acoustic modeling of speech, speech synthesis, speech recognition, audio and video data analysis, handwriting recognition and generation, sequence prediction, and protein secondary structure prediction, and it has an outstanding performance in time series prediction [26]. Because of the presence of fluctuation information in the original data of water quality, neural networks occupy a higher accuracy to predict trend of such kind of data [25].
In our system, the sensor sampling value is a time sequence with a fixed frequency, and its structure remains unchanged after wavelet decomposition and reconstruction.
1) Forward calculating the output value of each neuron, which are the values of five vectors
Where:
The current unit state formula is:
The computing formula at the current unit state is expressed by:
The final output of the LSTM is determined by the output gate and unit states:
2) Reversely calculating the error term of each neuron. The back propagation of the LSTM error term includes two directions: one is the backward propagation along time from the current time t to calculate the error term for each moment; another is to propagate the error term to the upper layer.
3) Calculate the gradient of each weight based on the corresponding error term. In our system, we set 100 data, i.e. 5-minute data in the sliding window to predict the values in the next 5 minutes. One hidden layer is set for the neural network in our system. For the wavelet decomposed 1024 data sequences in the sliding windows, the first 896 values are used for model training and the last 128 are used for testing. The learning rate of each layer of the network node is 0.2, and Mean Square Error (MSE) and
It is online training, thus the value of batch_size parameter is set as 1. The trained model predicts one step ahead based on the current trend obtained by wavelet decomposition, and then the predicted value is used as the last value of the trend sequence to predict next one step ahead value. This process iterates 100 times, and consequently the monitoring indicators in the next five minutes are predicted.
Data storage
Besides analysis, sensor data also needs to be stored in the hard disk for historical data query. In the system, HBase is selected as the data storage database due to its nature of storing high sampling frequency with large data storage size.
HBase is a distributed column-oriented No-SQL database built on the top of Hadoop file system, and it is a data model that is similar to Googled big table designed to provide quick random access to huge amounts of structured data [2]. HBase is a column- oriented database and the tables in it are sorted by row. The table schema defines only column families, which are the key value pairs. A table have multiple column families and each column family can have any number of columns. Subsequent column values are stored contiguously in the disk, and each cell value of the table has a timestamp.
HBase can store large data sets on top of HDFS file storage, and it will aggregate and analyze billions of rows present in its tables. Operations such as data reading and processing will take less time as compared to traditional relational models. In addition, HBase is used extensively for online analytical operations, and the database also can be shared in HBase. These features are helpful for the sensor data from different monitor areas to be stored into different tables.
Mehmood and Anees made an analysis on the CPU and memory usage for real-time semi-stream join processing through two types of tests, unstructured and structured data streams based on synthetic and real datasets. The results show that memory usage and execution time remains consistent for a given specification irrespective of the nature of data streams (unstructured or structured), even when incoming semi-streams are growing [18].
Since the RowKey is critical in HBase, it should be designed based on the data access patterns of the business requirement and the data storage characteristics of HBase. RowKey is a binary code in HBase, and it can be any character with the length of no more than 64k bytes. According to the characteristics of the historical data query, it will be more convenient to use the date and time as the RowKey. However, the continuous time values will cause the data to be concentrated in a region of the cluster, which causes hotspot issues and degrades the cluster performance and even makes it crash.
In order to solve these problems, a table is set up based on the monitored water areas and monitored points in the system.
The RowKey format of is:
Result analysis
System environment
In our system, DELL PowerEdge R710 server is used to build clusters, and the server hardware is configured as 96G memory, 24 core X5650*2CPU, 1800G hard disk. The server is virtualized with three virtual machines, and each virtual machine is allocated 24G memory, 24 core CPU and 500G hard disk. Zookeeper is employed to provide application coordination services, and a HB cluster, a Kafka cluster and a storm platform are built in the virtual machines. The development tool is JDK1.8, Apache Storm version is 1.1.0, HBASE version is 1.3.1, wavelet decomposition uses open source Jwavel.0.3, LSTM uses TensorFlow 1.4.0. The sensors produced by Wuhan Fuyuanfeike Company are used to minitor the indecies of pH, DO and COD. The wireless gateway uses the F2614 CDMA 4G wireless DTU of Xiamen Sixin Company. The selected hardware is shown in Fig. 4.
Since one monitoring point in the monitored water area has been set so far, one TOPIC in Kafka, named xinAn_0001 was created. In order to simulate multiple monitoring points, three copies of the monitored point information were copied and three partitions were created by the receiving software. In the experiments, multiple monitoring points were simulated by software.

Sensors and wireless DTU.
Statistical analysis result of pH, DO and Water temperature data taken from one sliding window in Storm Bolt is shown in Table 1. For each index, 895 of 1024 data set is used for training and the rest 128 is used for testing. The analysis result reveals that amplitude of the three data sets is comparatively stable in general. Whereas smaller standard deviation of the three testing data sets indicates that the values of testing data tend to be much closer to the mean, which might cause prediction values is larger than the observed ones.
Statistical analysis of the data
Statistical analysis of the data
Figure 5 displays the comparison results between the original series of pH, DO and temperature and their wavelet decomposed approximation series (trend). The results reveal that the approximation series effectively filter the fluctuation of the original data and they more obviously display the trend of original series.

Original data and trend line, (a) pH, (b) DO, (c) water temperature.
During the training process, 10% of 895 training data is further used for model validation in order to keep training from overfitting. Table 2 shows the training results after 100 epochs, and the training results show that MSE loss of training fitting and validation are both smaller (0.0008~0.0022) while

Mean Squared Error (MSE) loss of model training and validation of 100 epochs, (a) pH, (b) DO, (c) water temperature.
The testing results show that prediction MSE losses of the three indices are very low (0.0038~0.0009) with higher good of fitness (
Results of model training, validation and testing
Results of model training, validation and testing
For the processing capabilities of the Storm platform, the Complete latency is the whole processing time of the tuple and the tuple tree, while the Execute latency is the time spent by Bolt to process the tuples. Capacity is equal to the numbers of messages, processed by the Bolt calling the Execute method, multiplying by the average time of the message, and then divided by the time interval of the message. Capacity reflects the Bolt’s idleness, where the greater value indicates that the data transmission speed of Spout is faster, the but Bolt has a much heavier burden. Table 3 shows the comparison between the three indicators in three and ten monitoring points. It reveals that the number of data processing delays is raised with increase of the node numbers, whereas it still fully satisfies the business requirements. In addition, the change of Capacity is small, indicating that the Storm platform is robust enough. Figures 8, 9, and 10 display the server hardware loads of 10 monitoring points. The load statistic confirms that the system resource load is basically at a stable level. Consequently, it indicates that, with the support of appropriate hardware resources, Storm platform will be more robust in processing real-time data streams. In Fig. 8, the Y axis is the number of processes and the X axis is the time. From Fig. 8 we can know that seldom process costs long time and most of the processes cost mid or short time. In Fig. 9 and Fig. 10, the X axises are time, and Y axis is memory cost and CPU cost respectively, they show that the resource costs are reasonable.
Performance of storm with different loads
Performance of storm with different loads

Comparison of observation and prediction of pH.

System load of last 24 hours.

Memory load of last 24 hours.
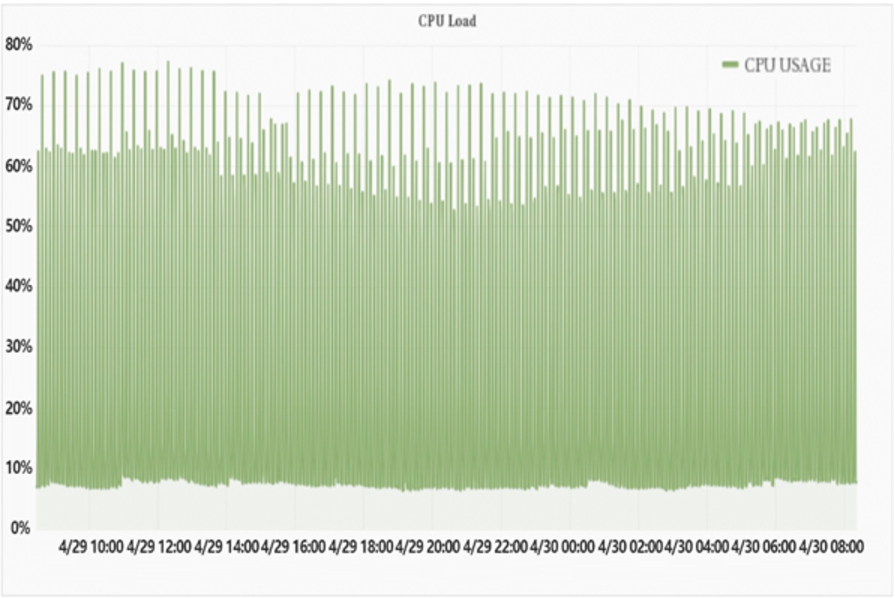
CPU load of last 24 hours.
At present, a big data water quality monitoring and processing platform framework has been completed, and the advantages of the system proposed integrate IoT devices, Apache storm and Wavelet transformation and deep learning modelling approach. It solves the deficiencies of traditional water monitoring system, which can be used to process high frequency real time data, monitoring and predicting the situations of water quality and giving an early warning on the predicted problems. The main experimental results indicate that the LSTM based deep learning model in the system has a good performance to model and predict water quality with high accuracy, and the big data platform has robust capacity to process the vast amount of high frequent sensor data. However, the following work needs to do further in the future: 1) Multi-feature water quality prediction. The platform is currently monitoring three water quality indicators in one monitored point and provides early warning based on prediction results. However, more advanced application requires comprehensively forecasting even more multiple water quality indicators in multiple monitored points. Hence it requires integrating the multi-features to train the model, and then making classification predictions of the multiple water quality indicators. 2) Dynamic temporal granularity forecast. The current forecasting time granularity is in seconds. Such a designed model is helpful in forecasting sudden events, while it is incapable of making a mid-to-long-term forecast of the water quality. The dynamic time granularity is adjusted according to the user’s demand to predict the water quality in the next few days or months. Such demand needs to fuse the historical data and extract the data features for model training, validation and testing according to the time granularity.
Footnotes
Acknowledgements
This work was supported by the Scientific Bureau of Yantai, China under the Science and Technology Plan Project “Green and Efficient Smart Agricultural Management Platform Based on New Generation of Information Technology” (2018YT06130844).