
Abstract
This paper presents a novel Multi-DL Fuzzy Approach aimed at performing image recognition in the development of a real-time traffic alert system, addressing the problem of traffic congestion and related incidents. Traditional monitoring by road operators predominantly relies on fixed location cameras, yielding limited and sometimes ambiguous information. This study proposes leveraging Twitter (now known as ‘X’) as a more comprehensive data source alongside employing fuzzy techniques with Deep Learning (DL) neural networks such as CNN, VGG16, and Xception to analyze and classify traffic images. The innovative integration of these technologies augments the precision in categorizing varying traffic conditions, namely fluid and dense traffic, accidents and fires. Thus, this proposal mitigates the ambiguities prevalent in traffic image interpretation, and reduces the dependency on static data sources. The proposed models showed improved results by combining information from the DL models, elevating accuracy from 84% in crisp classification to 90% utilizing fuzzy information.
Keywords
Introduction
Traffic congestion is an important problem in our modern society, affecting millions of citizens worldwide [4]. It not only affects urban areas in large cities, but also occurs frequently on most roads that provide access to those cities or that circumnavigate them. While applications like Google Maps or Waze offer real-time traffic congestion alerts to drivers, there is also a need for road operators (public entities or private companies) to monitor this problem using their own data sources and other available open data, without depending on third-party services [1]. In this manner, these road operators will be able to act more appropriately in the different situations that lead to traffic congestion (accidents, massive arrival of vehicles, or unplanned lane blockage).
Typical data sources owned by road operators to monitor traffic are in the form of sensors such as inductive loop detectors [25], microwave radar detectors, and video cameras. While the two first elements may be effective for tracking the passage of vehicles and measuring speed, video cameras offer a more compelling alternative to obtain a better view of the current traffic situation at a specific point on a road. However, a road operator may manage hundreds or even thousands of cameras to oversee the entire road network, with data updating at intervals of just a few minutes. This volume of data can make it challenging for a human operator to detect all potential traffic problems in real-time.
In our previous work [19], we evaluated several Deep Learning (DL) neural network architectures to analyze traffic images obtained from over 1,500 video cameras operated by the Dirección General de Tráfico (General Office of Traffic, known as DGT) in Spain. These cameras were placed on major Spanish roads, capturing a snapshot of the corresponding road section every 4 minutes. The aim of our system was to automatically classify the traffic images from DGT into four categories: fluid traffic, dense traffic, accident, or fire. The results showed that our proposal reached an accuracy rate of 71%. More importantly, this previous work highlighted two key limitations. First, the location of traffic events was constrained by the placement of the cameras, predominantly positioned on highways. This left uncovered areas on secondary roads and within major cities. Secondly, a significant portion of misclassifications made by the DL models were due to the inherent ambiguity present in traffic images. For example, traffic flowing smoothly was sometimes classified as dense due to the high volume of vehicles and the distances between them. Another example occurred in images depicting a traffic accident, which were misclassified as dense traffic, incorrectly suggesting a less severe situation, due to the consequence of such an accident.
To overcome these two limitations, the present study proposes an extension of the system introduced in [19] by incorporating two new elements. First, the use of Twitter as a complementary open data source to capture any traffic image without being constrained to the fixed locations of DGT cameras. As the majority of tweets that attach photographs of traffic events also contain local information in the text or hashtags, it could be relatively easy to link the traffic event detected in the photograph to a specific location. Moreover, considering Twitter as a social-sensing platform has gained an increasing interest in the last few years because of the real-time nature of its posts [8,21]. It is also a well-known space where users tend to voice complaints and share negative experiences, making Twitter a valuable source for identifying and understanding traffic problems in real time [2]. Second, the use of fuzzy techniques combined with the DL neural network in order to address the ambiguity of the images and offer a more realistic result. Thus, the output of the presented models will have an interval output representing the classification of the initial image and the fuzzy classification considering the ambiguity of the images.
The contribution of this paper is based on the development of a real-time traffic alert system based on the analysis of traffic images from Twitter by means of a combination of DL neural networks and fuzzy techniques. This work builds upon previous research conducted in a controlled environment, where images were obtained from a specific set of cameras dedicated to traffic monitoring. The novelty in this extended version lies in adapting the DL models to deal with a broader and less curated range of traffic images from Twitter. Additionally, it integrates fuzzy techniques with these DL models to address the ambiguity in classifying traffic situations. Consequently, this extended system provides a more reliable and adaptable solution for monitoring traffic situations reducing the reliance on proprietary data.
The rest of the paper is structured as follows. Section 2 provides an overview of recent developments in traffic alert systems. Section 3 depicts our system architecture based on DL neural network models and fuzzy techniques. Then, Section 4 discusses the results of our proposal. Finally, Section 5 summarizes the content of this work and outlines some future lines of research.
Related works
Road congestion is an escalating problem, leading to an increase in the number of accidents. The current challenges include the need to monitor road conditions, detect traffic jams, provide solutions to reduce them, and minimize the number of accidents, as well as manage traffic in general [16]. In this regard, a traffic monitoring system is able to address many issues, such as traffic jams, accidents, stopped vehicles, traffic density, or emergency situations that may occur on the road such as fire [13]. In relation to our proposal, we focus on the classification of traffic events such as traffic jams, accidents, or road emergencies such as a fire. To this end, traffic images are one of the most abundant types of data for the classification and detection of such traffic phenomena.
Recently, image classification has shown very positive results using deep Convolutional Neural Networks (CNN) [7]. CNNs have proven their capacity to automatically detect and extract hierarchical features, distinguishing them from conventional networks [3]. These advancements have also led to their widespread adoption in the realm of Deep Learning (DL), particularly in applications such as Traffic Sign Recognition (TSR), even though they are based on selective search [28]. In addition, VGGNet models are pre-trained with a dataset of millions of images. For example, VGG16 supports 16 layers and has 1000 categories. These models can be extrapolated to similar problems saving the training time involved in pre-training, and therefore, subsequent training is lighter because fewer images are needed [24].
There are several proposals in literature that introduce methods to detect traffic congestion based on the classification of images obtained with cameras. Nevertheless, real-time recognition and reporting of traffic congestion remain a persistent challenge, particularly given the dynamic variables encompassing lighting, weather conditions, and unexpected situations [24].
In [14,17,26] a CNN is used to classify images and congestion traffic. In particular, for this purpose, Xu et al. [26] use satellite imagery of the city of Los Angeles and a MobileNet network while Kang et al. [14] utilize images taken by citizens using their mobile devices, encompassing a range of urban scenes such as road traffic, electric vehicles, illegal parking of motor vehicles, and littering. The authors adopt a CNN structure that is designed to remain efficient in terms of size, minimize training time, and reduce operating costs, all without compromising accuracy. A total of 5,200 cases were sorted into four different categories. Kurniawan et al. [17] utilize a total of 1000 small gray-scale images labeled with balanced distribution (jammed and not jammed) for training and classification where the results show an average accuracy of 89.5%. More recently, the authors of [10] present a framework for estimating traffic congestion using a Faster R-CNN. They classify whether there is congestion or not in the images by identifying the days as sunny or rainy. To do this, they use a dataset of images obtained from traffic cameras in China. The results indicate that their approach is better compared to other techniques for estimating traffic congestion.
Alternative proposals present solutions based on the combination of several models for traffic congestion detection [6,24]. Cui et al. [6] present two CNNs for highway traffic camera image prediction. The difference between these images and the usual ImageNet images is that these surveillance cameras have a wider perspective range and a large background. By leveraging AlexNet and GoogLeNet, the authors manage to classify the congestion state of highways with 98% accuracy by creating a proprietary database of images extracted from videos. Wang et al. [24] introduce four variations of TrafficNet models including AlexNet with SVM, transfer learning from AlexNet, VGGNet with SVM, and Transfer learning from VGGNet, which are tested and compared. As a result, images are classified as traffic congestion and non-congestion, achieving a maximum accuracy of 90% considering different weather and illumination conditions. Considering the combination of models, Zhuo et al. [29] also extract video images that were recorded in different seasons of the year and with different weather and light conditions. To facilitate dataset creation and labeling, the authors employ a semi-supervised approach. The study involves a comparative evaluation of four models, including AlexNet and Detec-Net1/2/3, each with varying depths. The pre-trained ILSVRC-2012 network is used and subsequently fine-tuned for integration into Detect-Net, and finally yields an accuracy rate of 93%.
In addition, other proposals incorporate YOLO as part of their approach to identifying congestion and monitoring traffic [12,18,28]. Ikiriwatte et al. [12] address the problem of traffic density detection using YOLO and compare two CNNs, including Darknet and ResNet. The authors employ a dataset of traffic images of a four-way junction from different perspectives. Experiments show that better results are obtained with DarkNet. In turn, Lin et al. [18] use YOLO to classify images and monitor traffic and then use two fuzzy neural network approaches to perform vehicle classification. The experiments are performed with the Beijing Institute of Technology’s public dataset. Furthermore, Zhu et al. [28] use a real-time TSR model based on DL to avoid accidents, protect drivers, and reduce manpower and resources. They have created a dataset that integrates 2,182 images with 8 classes (no u-turn, rad bump, road works, watch for children crossing, etc.) and made a comparison with SSD (Single Shot Multibox Detector) and YOLOv5 obtaining an average accuracy of 90.14% and 97.70%, respectively.
As observed, most of these proposals focus on detecting traffic congestion, but only a few address fire detection, and even fewer specifically target road fire detection. In this regard, Talaat et al. [23] present an enhanced fire detection approach for smart cities utilizing the YOLOv8 algorithm, referred to as the Smart Fire Detection System (SFDS). The dataset, consisting of 26,520 indoor and outdoor fire and smoke images, is divided into 21,216 for training and 5,304 for testing. YOLOv8 achieves an accuracy of 97.1% for fire detection and 99.3% for smoke. In our work, we evaluate not only traffic congestion but also the presence of accidents or fires on the road. In addition, we employ fuzzy techniques to obtain a more realistic and reliable classification result, since the images used in the test and in most of the training dataset are real images from Twitter, without any previous pre-processing or manipulation. Finally, to the best of our knowledge, only some of the proposals offer a real-time response. In particular, only one of the systems reviewed has a real-time TSR model which is used for purposes other than fire and accident detection. Therefore, due to the importance of immediacy in the smart cities domain, our proposal focuses on identifying the situation in real-time.
System architecture
Architecture of the multi-DL fuzzy system for real-time traffic alerts.
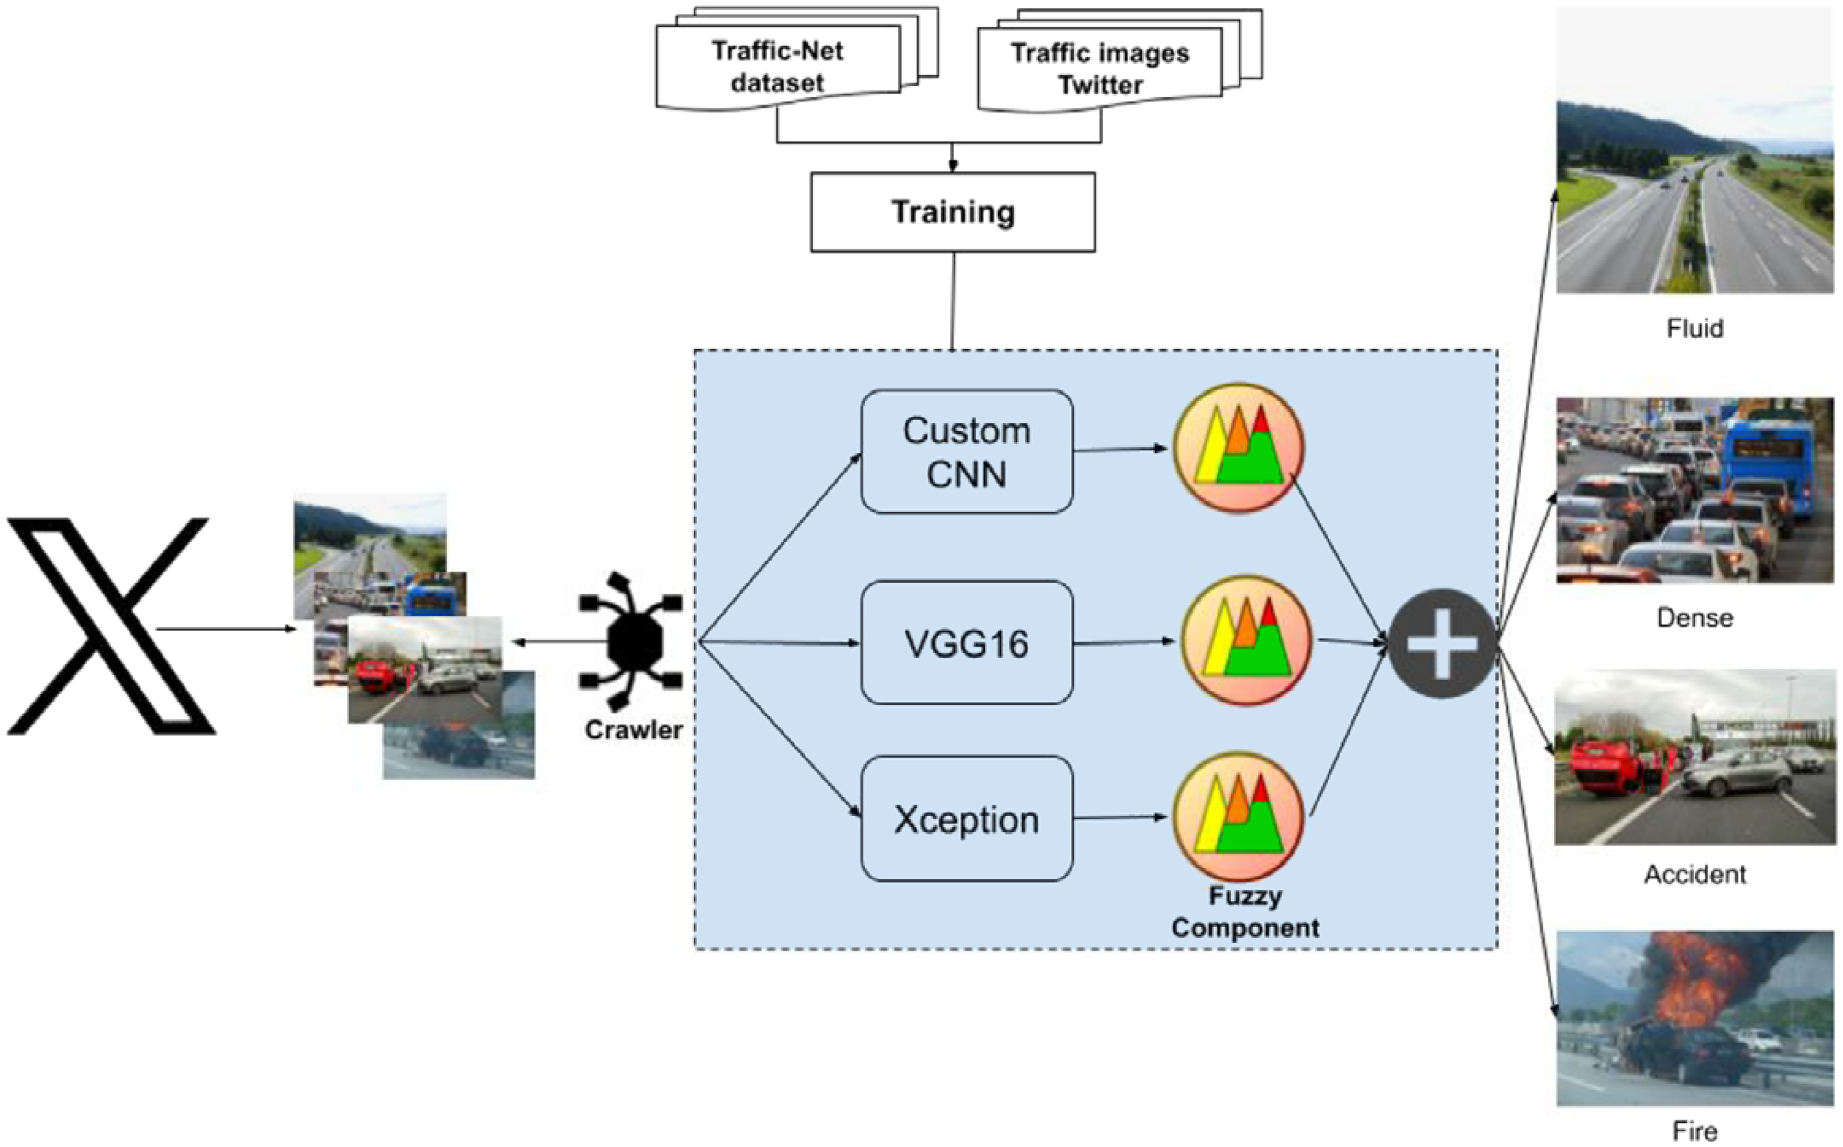
This section describes our proposal for a real-time traffic management system. Figure 1 shows the architecture of this system. The input data is crawled from Twitter (now known as “X”) every 15 minutes. The Twitter API is queried using a set of keywords related to traffic events like “traffic jam”, “traffic accident”, “road congestion”, “dense traffic”, “fluid traffic”, and “vehicle fire”. The stream of images retrieved from Twitter is then directly fed into the three DL models of the system: a custom CNN model, a VGG16 network, and an Xception architecture. These three models were selected due to their widespread use in traffic image recognition. Then, each DL model returns a membership function for each image to each possible label. In classical (crisp) classification, the label with the highest membership function value would be chosen. However, due to the ambiguity of the images, they may be classified under more than one label. Therefore, we employ soft computing algorithms to return a fuzzy classification [11]. In addition, we propose the combination of information provided by the three models to improve the classification results. To do so, the classification performed individually by each DL model is combined to obtain the final result, represented by the ⊕ operator in Figure 1. The following subsections describe each of the system components in detail.
The datasets used for this study are two. A first generic dataset, called Traffic-Net,1 is used for training the models in the system. It contains 3,600 images covering 4 classes, namely accident, dense traffic, fluid traffic, and fire. Figure 2 shows an example image for each category.
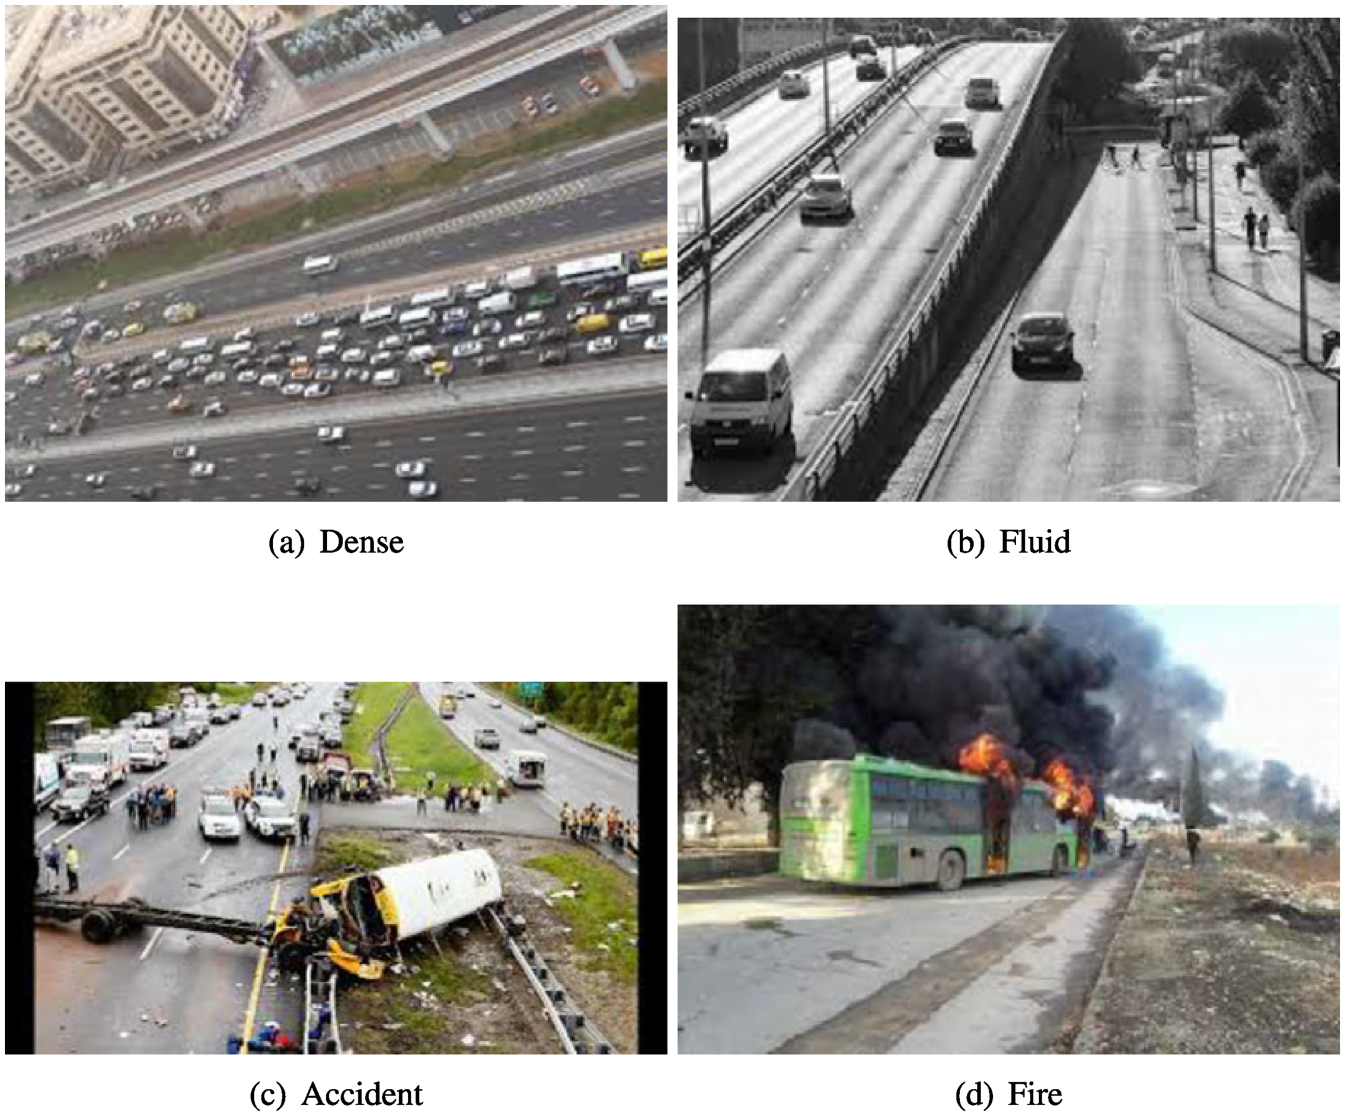
Images of the Traffic-Net training dataset.
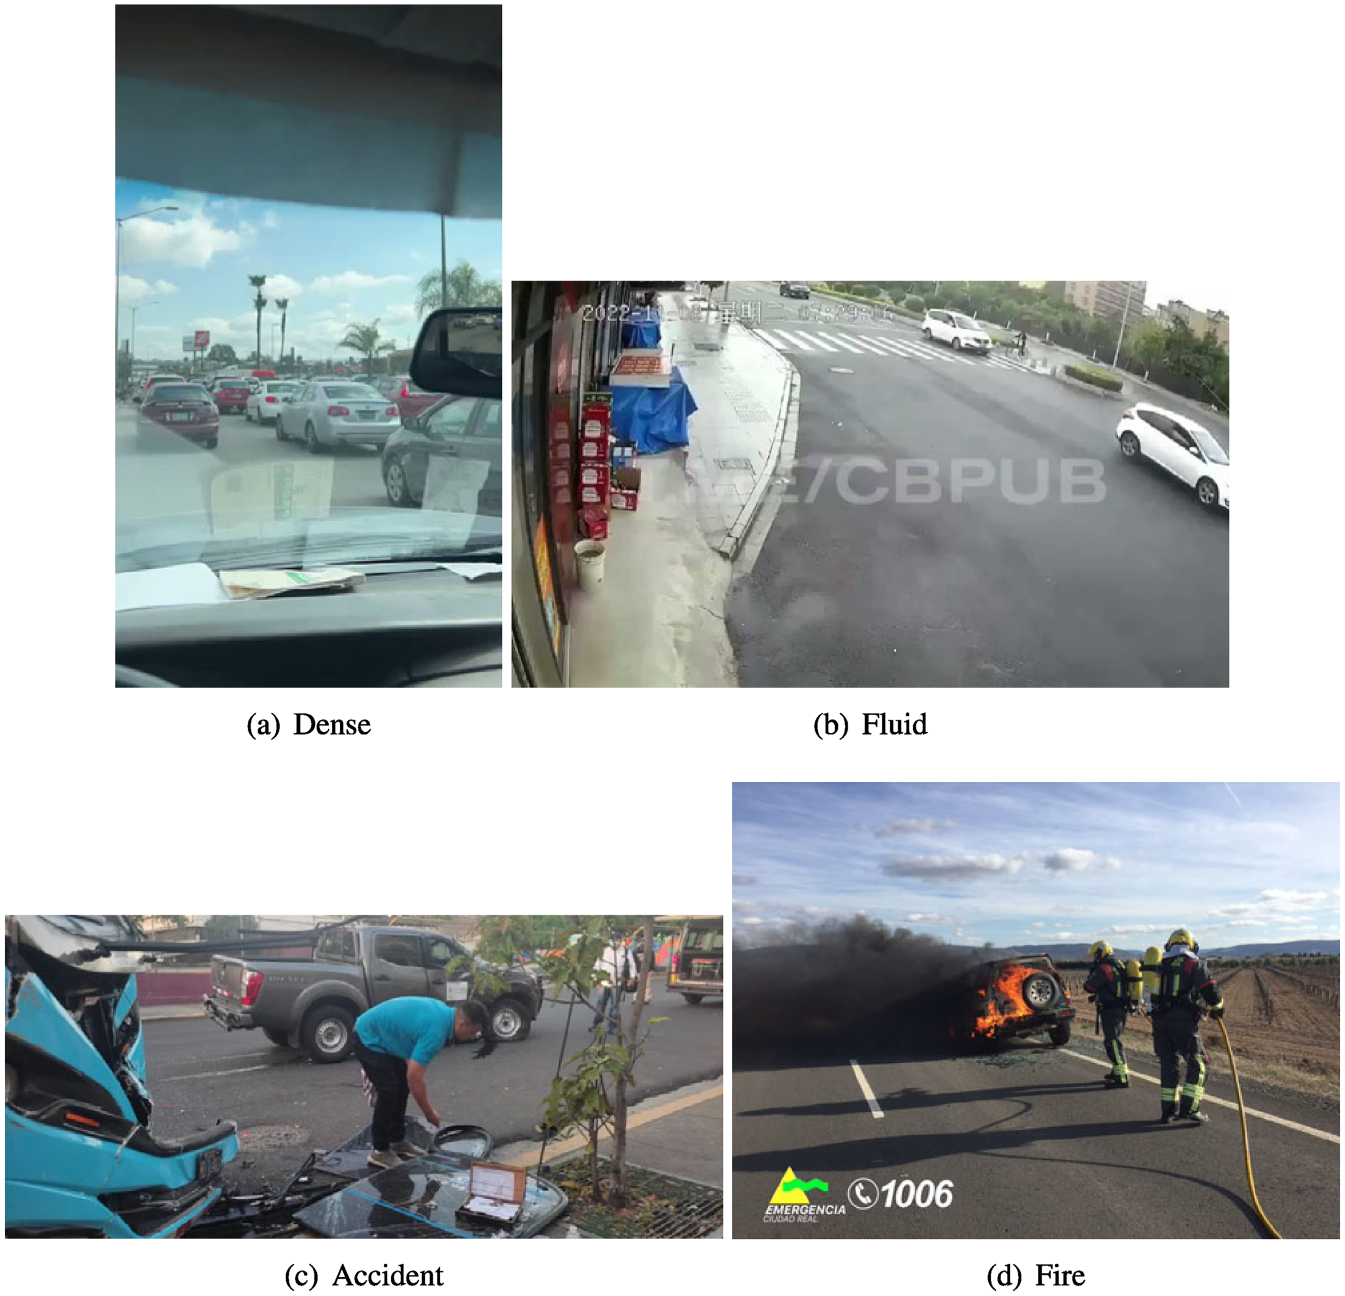
Images of the Twitter dataset.
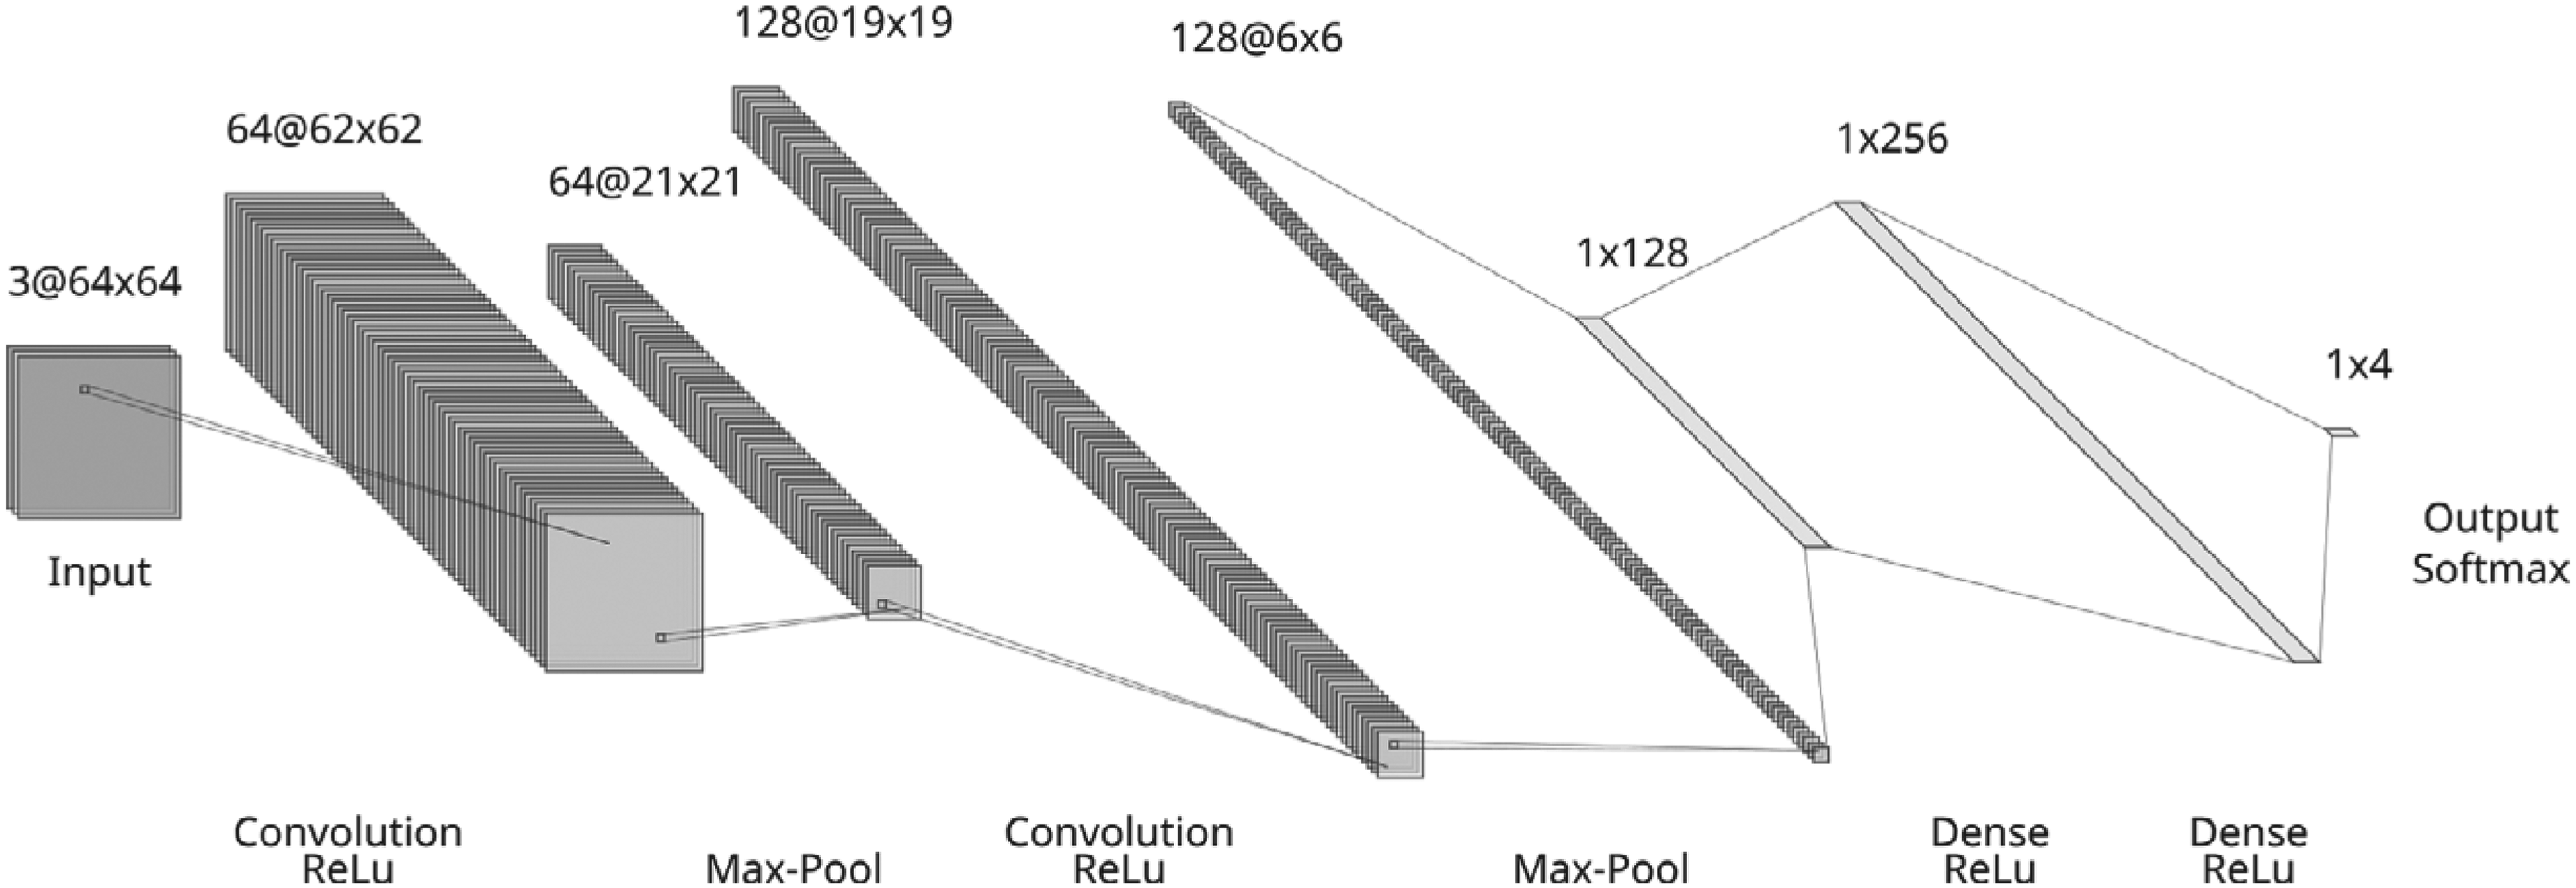
Architecture of the proposed CNN model.
The second dataset was acquired using the Twitter API on a series of specific hashtags related with our 4 classes as indicated above. Out of 11,557 tweets collected, 867 images of sufficient quality were selected. All images were manually labeled using a cross-processing process. Each image has two labels: a primary tag and a secondary tag. The primary label describes the major problem that has been identified whereas the secondary label identifies other possible problems detected in the image, e.g. if there is an accident, there may also be a fire, or if there is dense traffic in one lane, there may also be fluid traffic in another part of the image. Thus, the primary labels have resulted in 476 accident, 246 dense, 96 fluid, and 49 fire images. Figure 3 shows examples of the 4 categories from an on-the-ground perspective and other common features of images tweeted by spontaneous users and news of current events, such as vertical format factor, watermarks or subjective perspective, among others. In total, the models are trained with 4,347 images from both datasets, where 3,600 are from the first dataset and 747 are from the second dataset. For the test, the models only use 30 images of each label extracted only from Twitter images.
CNN model
The proposed CNN architecture comprises two convolutional layers, two max-pooling layers, and two fully connected layers. Figure 4 depicts the architecture design. The initial convolution layer utilizes a 3x3 filter with 64 feature maps, processing an input of size 64x64 and a depth of 3, resulting in an output size of 62x62. Subsequently, each sample of the feature map undergoes reduction through a 3x3 max-pooling layer. The subsequent convolution layer utilizes a 3x3 filter with 128 feature maps, leading to an output size of 19x19, which is further reduced to 6x6 through another 3x3 max-pooling layer. Following this, two dense layers with 128 and 256 perceptrons, respectively, employ the ReLU activation function. The output layer consists of four perceptrons, one for each class, with the softmax activation function.
The CNN model was trained using a batch gradient descent approach with the Adam optimizer in Python 3.10, leveraging the Keras library. The loss function chosen was categorical cross entropy, with a batch size of 64 and training for 50 epochs. To avoid memory congestion, images were resized to 64x64 pixels. To augment the dataset and diversify the training samples, the following augmentation parameters were used: rescaling (by a factor of 1/255), rotation (up to 20 degrees), zooming (with a range of 0.2), and horizontal flipping. The augmentation process aims to enhance the model’s robustness by introducing variations in the dataset, thereby mitigating overfitting tendencies. The training of the CNN was conducted on a computing system equipped with 16 GiB of RAM and powered by a 12th Gen Intel(R) Core(TM) i7-1260P processor running at 2.10 GHz. The training process of the CNN on this hardware configuration lasted approximately 17 minutes.
VGG16
This model was created by Simonyan and Zisserman as a CNN model for large-scale image recognition [22]. This network uses blocks composed of an incremental number of convolutional layers with filters of size 3Õ3. It has an input of 224x224 in three channels (RGB) and to reduce the size of the layers that are generated, max-pooling blocks are used interspersed between the activation maps, so that they reduce these maps to half their original size. The final part of the network is composed of two fully connected dense layers of 4,096 neurons each and a final softmax output layer of 1,000 neurons. This network comes pre-trained with the ImageNet image library, which simplifies its training as it is a network with a high computational cost in training. Figure 5 shows this architecture where the interleaving of convolution and max-pooling layers can be observed.

Architecture of the VGG16 model.
The Xception architecture [5] is based on an inception network model, which uses wider and shallower layers, introducing in the same layer several convolution operators where their results are finally concatenated. In this manner, they differ from conventional CNN architectures which add layers one after the other. Xception is a limiting case of Inception that allows optimal prediction without the need for great depth by adding a novel concept, the depth-separable convolutions. The default format is a 299x299 RGB (3-channel) image. It uses 36 convolutional layers that allow it to extract features in a depth of 126. Each of the 36 convolutional layers is divided into 3 components: input stream, mean stream, and output stream. The data goes first through the inflow, then through the mean flow, which is repeated eight times, and finally through the outflow (see Figure 6). The fully connected layer is replaced by a global mean pooling layer, and the prediction is obtained using the softmax function. The network contains a pre-training with ImageNet, which means that the basic features of image recognition are already learned.

Architecture of the Xception model.
Fuzzy logic enables the classification and expression of uncertainty while respecting the nature of the data. It can be applied in many areas where decisions are not clear-cut and multiple options may be considered [15,27]. A core concept of fuzzy logic is the membership function
Thus, we propose a fuzzy output for the deep neural networks in our system, along with a fuzzy classification technique. The last layer of all the DL networks provides an output in the form of the membership functions for each image in each of the four possible categories (fluid, dense, accident or fire). Thus, the output of the DL models consists of a value between 0 and 1 for each of the 4 labels. This value is considered as the membership function of each label with respect to the image classification. The membership functions are of the Ruspinni type [20]. The membership function with the highest value indicates the classification of the first label as initially determined by the DL model, while the second highest value suggests a possible alternative classification, reflecting the scenario depicted in the image. Employing fuzzy methodologies allows us to classify images with varying degrees of certainty, focusing on the most significant details used by the model for classification. This approach also provides flexibility for images that are clearly associated with only one label.
When classifying images, we can opt for either a classical (crisp) classification, which involves selecting the label with the highest membership function value, or a fuzzy classification that considers the membership function value of the second most probable label. As a result, the classification output is represented as an interval. The minimum value within this interval corresponds to the primary class of the image (classical classification), determined by the maximum membership function value. The maximum value encompasses images whose membership function deviates by a certain γ value from the membership function and corresponds to the secondary label.
Algorithm 1 describes the fuzzy classification process for a set of images I to be classified (ImageTest), where i is an image,

Note that Algorithm 1 returns an interval output, where the minimum value of the interval indicates a classical classification. This classification is deemed successful only if the actual class matches the majority class predicted by the DL models. The maximum value of the interval is obtained by also counting as success those outputs of the DL model that coincide with the second label of the image. This interval provides a unique output, offering flexibility depending on the type of classification and the methodology to consider when analyzing the traffic images.
Combining information
The fusion of information can be instrumental in achieving more accurate classification, thereby enhancing the performance of predictive systems [9]. In this work, we propose a method for combining information to improve image classification without increasing the response time or adding more complexity to the system. This process uses the value of the membership functions of an image i for each class/label l,

Results
Configuration
For the experiments performed in this work, we have set the γ parameter used in the fuzzy classification to 0.5. The tuning of this value has been done through a parameter adjustment taking values from 0 to 1 in steps of 0.1 and searching for the best optimisation. The best value resulted in 0.5. Note that this value makes sense on the basis of the great ambiguity in the traffic images obtained from Twitter. In terms of presenting the results, crisp classifications will be displayed in a confusion matrix, while fuzzy results will be shown in a table format. In this table, the diagonal entries will correspond to the crisp classification successes, whereas the rest of the row values will indicate the label to which the image was classified using the fuzzy algorithm. In addition, the interval precision result [success, success+successFuzzy] will be shown at the end of each row in these tables.
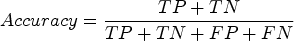
As evaluation metric, we have utilized the accuracy as the proportion of correct predictions (both true positives and true negatives) among the total number of cases examined. It is determined by:

CNN model
The proposed CNN network provides acceptable accuracy in classifying images from the test set. Specifically, it achieves an accuracy of 79% using a crisp classification approach, meaning it determines the class of the image solely based on one of the labels with the highest probability predicted by the network. Figure 7 shows the confusion matrix for this approach, where it can be observed that the model is correctly balanced and achieves an accuracy of 90% for the labels accident, 80% for dense and fire, and 67% for fluid.

Confusion matrix using the CNN model and a crisp approach.
Accuracy interval of the proposed CNN network using a fuzzy model.
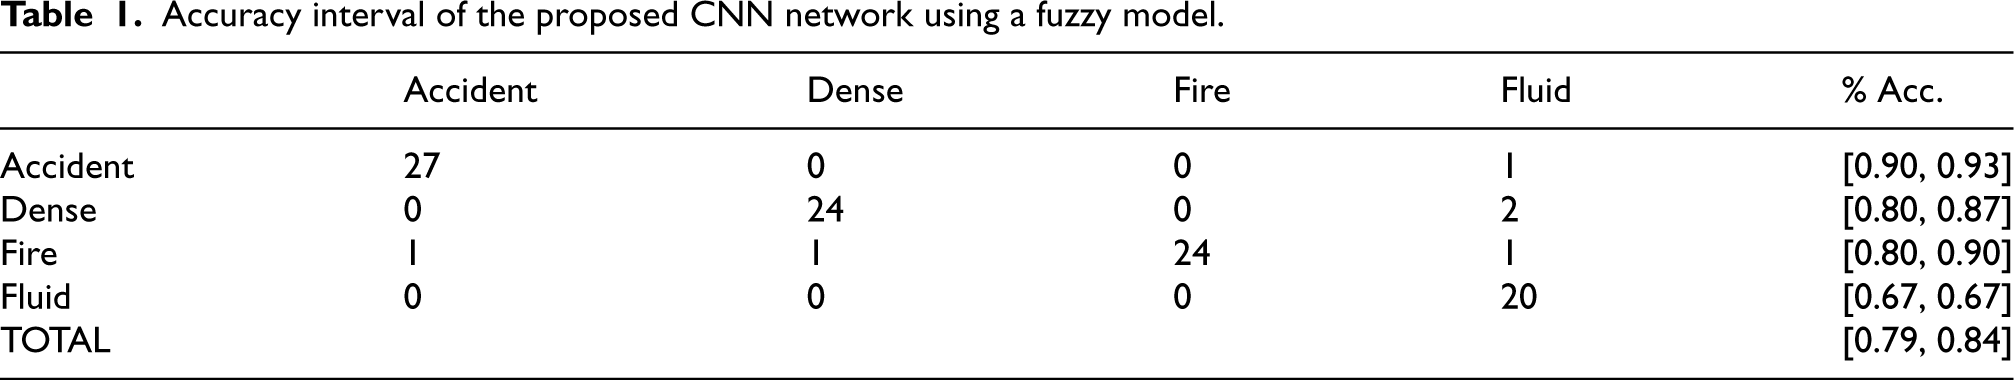
Following a fuzzy approach, where the two labels with the highest priority for image classification are considered, the accuracy of the network significantly increases to 84%. The developed model remains balanced, as shown in Table 1. The classification accuracy for each label improves as follows: 93% for the accident class, 87% for dense, and 90% for fire. However, there is no improvement for the fluid label. The overall accuracy improvement is 5% compared to the traditional approach, and the fire label benefits the most from the fuzzy approach, increasing its accuracy by 10% compared to the crisp approach.
The VGG16 network exhibits moderate accuracy, primarily due to classification errors in the dense label, while for the rest of the labels it is acceptable. Specifically, it presents an overall model accuracy of 75%, where the individual accuracy for each label is as follows (Figure 8): accident 97%, dense 43%, fire, and fluid 80%. By using the fuzzy approach, Table 2 shows as the dense label is improved by taking an accuracy of 63%. For the rest of the labels, fluid have the same accuracy as the crisp approach, while the fire label improves to an accuracy of 87%. Finally, accident label obtain an accuracy of 100% for fuzzy approach.

Confusion matrices using the VGG16 model.
Accuracy interval of the proposed VGG network using a fuzzy model.

The Xception network has an accuracy of 82% for the crisp approach. This can be seen in Figure 9 where both models have the same accuracy values for fluid and fire labels obtaining an accuracy of 93%. For the accident label the model obtains an accuracy of 80% and for dense labels obtains the lowest value with a 60%. This lowest value is not improved by the fuzzy approach, that is shown in Table 3. The labels fire and fluid improve to 97% of accuracy and the label accident obtains the same result than in crisp approach.

Confusion matrices using the Xception model.
As described in Section 3.4, we propose to enhance the system accuracy by combining the information from the three DL models compared to the individual output of each network. Thus, the results have yielded an improvement of classification accuracy, increasing from 84% with crisp classification to 90% when utilizing the combined fuzzy information.
Figure 10 shows the confusion matrix for the crisp approach. Note that, in this case, the combination information model obtains an accuracy of 90% for the accident label, 70% for the dense label, 90% for the fire label and 86% for the fluid label. Table 4 shows the results for the fuzzy approach, where it is observed that the crisp results are improved for all labels. The accuracy for the accident label increases to 97%, for the dense label it rises to 73%, for the fire label it escalates to 97% and for the fluid label it reaches 93%. Therefore, the combined information model utilizing the fuzzy approach outperforms the individual techniques.
Accuracy interval of the proposed Xception network using a fuzzy model.

Accuracy interval of the proposed Xception network using a fuzzy model.

Confusion matrices using the proposed combination information model.
Accuracy interval of the proposed combination information technique using a fuzzy model.

Regarding the results provided by the CNN model when using a crisp approach, it is observed that the fluid class has one of the lower accuracies. Figure 11 presents some images labeled as fluid that the network incorrectly classifies as dense. Thus, Figure 11(a) shows a nighttime image where the road lights might confuse the network, interpreting them as car headlights in a traffic jam. Likewise, Figure 11(b) displays a street with some traffic, but not at a severe level that would classify it as dense. This latter image is a good example of the potential ambiguity in the classification task, as the distinction between fluid and dense traffic can be subtle, making the classification subjective even to the human eye.

Example of incorrect classifications of the proposed CNN model using a crisp approach. A) fluid image classified as dense due to streetlights, which can be mistaken for car headlights. B) fluid image classified as dense due to moderate traffic.
In contrast, when using the fuzzy approach by the CNN model, more images can be considered as successfully classified. Some of these images are shown in Figure 12. Thus, Figure 12(a) displays an image showing an accident; however, the CNN network classifies it with a higher probability as dense, followed by accident. Observing the image, it is reasonable to conclude that, besides the accident, the traffic is dense as well. Another example can be seen in Figure 12(b), where a vehicle is shown on fire, but the flames are almost extinguished. Although the image is labeled as fire, the network assigns a higher probability to the class accident, followed by fire. As can be observed, apart from the remains of the fire, the image can also undoubtedly be classified as a traffic accident.

Example of fuzzy classifications of the proposed CNN model. A) accident image classified as dense due to the road being occupied as a result of the accident. B) fire image classified as accident because the fire is nearly extinguished, and only the remnants of the accident remain.
On the other hand, both the Xception network and VGG16 encounter difficulties detecting the dense class, often confusing it with fluid traffic. Figure 13 shows examples of dense class classification for the Xception and VGG16 networks. In the case of Figure 13(a), both networks incorrectly classify the traffic as fluid. This may occur because the networks interpret the existing gap as a fluid lane. The fuzzy model for these networks also yields the same incorrect prediction. However, in the case of Figure 13(b), while the VGG16 network misclassifies the traffic, the Xception network correctly identifies it as dense, both in the crisp and fuzzy classification. VGG16’s incorrect classification as fluid traffic could be due to the gloss in the image, which this model possibly interprets as a free lane. Interestingly, when the fuzzy model is applied to the VGG16 network, it correctly classifies the traffic as dense.

Example of dense class classification for Xception and VGG16. A) both networks incorrectly classify the image as fluid, most likely due to the existing gap. B) the Xception network gets the classification right while VGG16 classifies it as fluid. However, the fuzzy model of VGG16 classifies it correctly.

Example of fuzzy classification of the combination information technique. A) first label fluid, second label dense. B) first label fire, second label accident.
Finally, the combination of information from the three DL models yields more accurate results, even surpassing those achieved when using the fuzzy approach individually in each model. Indeed, note that the fuzzy technique shows lower accuracy for images primarily labeled as dense and fluid compared to the best-performing individual DL model. This is caused by the misclassification of these labels by the other two models. Thus, thanks to the combined information approach, it is possible to correct errors made by the individual networks, such as in the images in Figure 11(b), which the CNN model classifies incorrectly but the combined fuzzy information model achieves a success. Another case of dense/fluid ambiguity, also correctly classified by the combined fuzzy information model, is shown in Figure 14(a). This image is initially classified as dense, but it can be seen that there are a dense lane and a fluid one at the same time, so both labels would be correct. The same applies to images in Figure 14(b), where a crashed car and smoke are visible. This image is labeled primarily as fire, but it could also be considered an accident. Nevertheless, the combined fuzzy information model still has some limitations and fails to classify images such as the one presented in Figure 11(a), where the blurred lights mislead the system by classifying it as dense traffic even when the road is clear.
The inclusion of Twitter data, despite its inherent imbalance, was a deliberate choice intended to assess the robustness of the system in real-world scenarios where data distribution may not be uniform, providing valuable information on its adaptability to diverse and challenging conditions. In any case, the results obtained are promising, since most classification errors are due to special situations, such as those shown in Figures 12, 13, and 14. It is also worth mentioning that in our previous study [19], the performance of CNN, VGG16, and Xception models was evaluated with different datasets. In that work, they were trained with Traffic-Net images and independently tested with both Traffic-Net images and a manually labeled dataset with images from highway cameras. The latter offered a higher quality and less ambiguity compared to the images from Twitter. The results (Table 5) demonstrate that the training dataset can influence the generalization of the model to some extent. However, in some cases, the differences are very noticeable, as can be seen in the customized CNN.
Accuracy results of CNN, VGG16, and Xception models trained with Traffic-Net and independently tested with Traffic-Net and DGT test data as in our previous work (first two rows); and trained with Traffic-Net and Twitter and tested with Twitter as proposed in this work (third row, showing the accuracy interval obtained using fuzzy techniques, where the minimum value of the interval represents accuracy using the crisp approach and the maximum is obtained through the fuzzy approach).

Traffic problems are a pervasive issue affecting millions worldwide, impacting both urban areas and access roads to cities. Road operators need effective monitoring of these issues, especially for incidents like accidents or lane blockages. These operators typically use video cameras to provide accurate information, but this approach has shortcomings such as the lack of global coverage. Thus, our previous research on traffic image analysis achieved a 71% accuracy rate in detecting fluid and dense traffic, but it faced limitations regarding camera placement and ambiguity in image content. To address these challenges, this study proposes using Twitter as a complementary data source and integrating fuzzy techniques with three Deep Learning (DL) neural network models, namely CNN, VGG16, and Xception. These models, trained on a combination of labeled data from Traffic-Net and Twitter images, are utilized to classify traffic images into categories such as fluid traffic, dense traffic, accidents, or fires.
Combining information from these DL models enhances classification accuracy, particularly when adopting fuzzy classification techniques. We evaluate the performance of each model, highlighting its strengths and weaknesses. For instance, while CNN and Xception yield good results in general, VGG16 struggles with dense traffic classification. In our experiments, the CNN model achieves an accuracy of 79% using crisp classification, which increases to 84% with a fuzzy approach. For the VGG16 network, the crisp accuracy is 75%, which improves to 87% with fuzziness. The Xception network performs at 82% accuracy in crisp classification, with minimal improvement in the fuzzy approach. Notably, the combination of information from all three DL models increases the accuracy from 84% in crisp classification to 90% when utilizing fuzzy techniques.
Despite the improvements achieved in this work, challenges persist when solving image ambiguity. Situations such as nighttime road illumination and ambiguous fluid/dense traffic conditions still pose difficulties for accurate classification. As future work, we plan to analyse the textual content of tweets alongside visual information. By employing natural language processing techniques, we could extract valuable contextual information from tweets, such as location-specific details, user sentiment, problem type and real-time updates related to traffic incidents. Fusing visual and textual data in a multimodal framework would allow us to provide even more accurate and context-aware traffic alerts.
Footnotes
Author contributions
All authors have contributed equally in the following elements: Conceptualization, methodology, software, validation, formal analysis, investigation, writing—original draft preparation, writing—review and editing and visualization. A.M. is also responsible for the supervision, project administration, and funding acquisition. All authors have read and agreed to the published version of the manuscript.
Funding
Financial support for this research has been provided under grants PID2020-112675RB-C44 and PID2020-112827GB-I00, both funded by MCIN/AEI/10.13039/501100011033. It is also partially granted by the “EMERGIA” programme, funded by the Junta de Andalucía through the grant EMC21_00417.
Conflict of interest
The authors declare they do not have any conflict of interest.
Ethical approval
Not applicable