
Abstract
Background:
Worldwide, about 56% of the amputees are upper limb amputees. This research deals a method with two-channel surface electromyogram (SEMG) signal recorded from around shoulder to estimate the changes in muscle activity in non-amputee and the residual limb of trans humeral amputees with different movements of arm.
Objective:
Identification of different muscles activity of near shoulder amputee and non-amputee persons.
Methods:
SEMG signal were acquired during three distinct exercises from three-selected muscles location around shoulder. The participants were asked to move their dominant arm from an assigned position to record their muscles activity recorded with change in position.
Results:
Results shows the muscles activity in scalene is more than the other muscles like pectoralis and infraspinatus with the same shoulder motion. In addition, STFT (Short-Time Fourier Transform) spectrogram with window length of 256 samples at maximum of 512 frequency bins using hamming window has used to identify the signal for the maximum muscles activity with best resolution in spectrum plot.
Conclusions:
The results suggest that one can use this analysis for making a suitable device for around shoulder prosthetic users based on muscles activation of amputee persons.
Introduction
Upper-limb amputations account for the vast majority (68.6%) in United States with the leading causes linked to vascular diseases (54%) – including diabetes and peripheral arterial disease – trauma (45%) and cancer (less than 2%) [1,2]. Males are at a significantly higher risk for amputations than females with a ratio of 4:1. In 2005, approximately 1.6 million persons were living with limb loss in the US and this number was projected to become more than double to 3.6 million by the year 2050 [3]. After the limb amputation, the control strategy is no longer available. SEMG is a non-invasive measuring technique of muscle activity. SEMG signal is difficult to analyze because it is a complex non-linear and non-stationary signal which shows large variations [1,2]. Sensors with proper location of electrodes on the active muscles give useful information. Various methodologies and algorithms provide efficient way of understanding the EMG signal and its nature [1].
For feature extraction of the signal, the most important factors are amplitude, root mean square (RMS) value, mean, variance, mode and various time domain and frequency domain parameters of SEMG signal [3,4]. Numerous studies have been done with different positions of the arm to analyze the upper arm movement from biceps, triceps, deltoid and brachioradialis for below-elbow amputees and around shoulder for above-elbow amputees. Data can be obtained from infraspinatus, trapezius, latissimus, Doris, scalene, pectoralis major and deltoid muscles [5,6]. Most of the researchers have analyzed small sets of muscles but did not compare the amputee muscles activity results with non-amputees in the above-elbow conditions. The study was also carried out to investigate the around shoulder muscles activity with the hand and arm motion movement of the normal person while doing the grasping tasks [7].
In the present research work, examination of SEMG signal across a wide range of steady-state changes in muscle activity for above-elbow amputees was carried out. The results showed that there was more muscles activity in amputees in comparison with able-bodied persons and the muscles activity in one of the three muscles was more than the other muscles. The SEMG signal continuously changes over time and can be described in terms of its amplitude, phase and frequency. SEMG signal is also dependent on the physiological purpose of muscles. Time frequency representations such as STFT and the wavelet transform gave the effective representation for determining and improving the accuracy of signal [3,8,9]. The EMG signal analysis using STFT indicated more variability in the signal with dynamic exercise [9]. STFT spectrogram with window length of 32 samples at maximum of 512 frequency bins with 12 time steps was selected to identify the signal for the maximum muscles activity with best resolution in spectrum plot.
Material and method
Fourteen subjects’ data was acquired using NeXus-10 Mark II International BV, Netherlands machine. The subjects, procedures and analyses performed are described below.
Subjects
In the present investigation, eight non-amputees (control subjects) with 25 ± 13 years age, 60 ± 15 kg weight and six right hand amputees 25 ± 13 years age, 60 ± 15 kg weight, time since amputation 11 ± 15 years were part of the research work. Control subjects had no history of muscular disorder. All the subjects were healthy having no other medical problem. For comparative analysis, the SEMG data was collected from different positions around the shoulder. All the subjects were properly trained before collecting data.
Procedure
Two channel combinations were selected to study the different values of muscles activity according to the specified exercises. Several muscles contribute the movement around the shoulder. The dual electrodes were placed at the desired locations for maximum coverage of the signal after the skin dried. The distance maintained between the two electrodes on single location was less than 15 mm. During the training session, subjects were asked to perform four sets of action of the shoulder as resting, elevation, adduction and abduction described in Table 1. Control subjects were asked to do the exercise from the neutral position. The amputee participants were asked to perform the same with their missing arm. Prior to the placement of electrode, oil or dust were removed from the skin surface with alcohol swab. The three primary muscle point combinations (p1, p2 and p3); infraspinatus muscle at the backside of the shoulder (I), scalene at the shoulder (S) and pectoralis major at the position on the chest (P) of the amputee person were taken/marked as shown in Fig. 1.
Description of muscles activation
Description of muscles activation
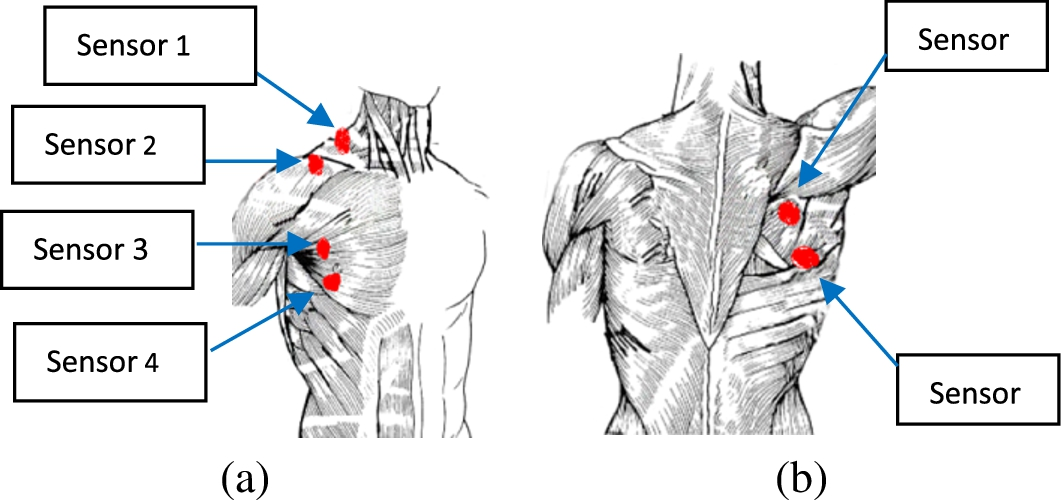
Location of sensors around shoulder. (a) Front, (b) back.
Bipolar electrodes were placed on the shoulder muscle of subjects of both groups and the SEMG signal was recorded by the NeXus-10 Mark II hardware. The SEMG system had a gain factor of 19.5 and CMRR ⩾ 100 dB. The sampling rate of SEMG signal was kept 1024 samples/second for each channel and the resolution were 12.2 nV/bit.
The signals were recorded from the indicated muscle with single channel and two channels. With two channels, the combination of two muscles (SP, IP, IS) were taken for collecting the signal.
IIR bandpass Butterworth filter with range of frequency from 20–500 Hz was used [10,11]. The Root Mean Square is a statistical measure of the magnitude of a varying quantity [12]. It represents the square root of the average power of the EMG signal for a given period. The corresponding formula for the EMG signal is given as:
Normalized smoothed data eliminates the effect of large values.
Joint time frequency representation is preliminary step in the analysis of SEMG signal.
STFT is evaluated by applying some suitable windowing function to the original signal the spectrogram of a signal
The STFT spectrogram is a visual representation of the sinusoidal frequency and phase content of a signal as it changes over time [13,14]. The different window size and frequency bins can be set according to the signal variation. In this investigation, first a suitable Hamming window size was determined [14] and then the spectrogram of the signal was found with best resolution.
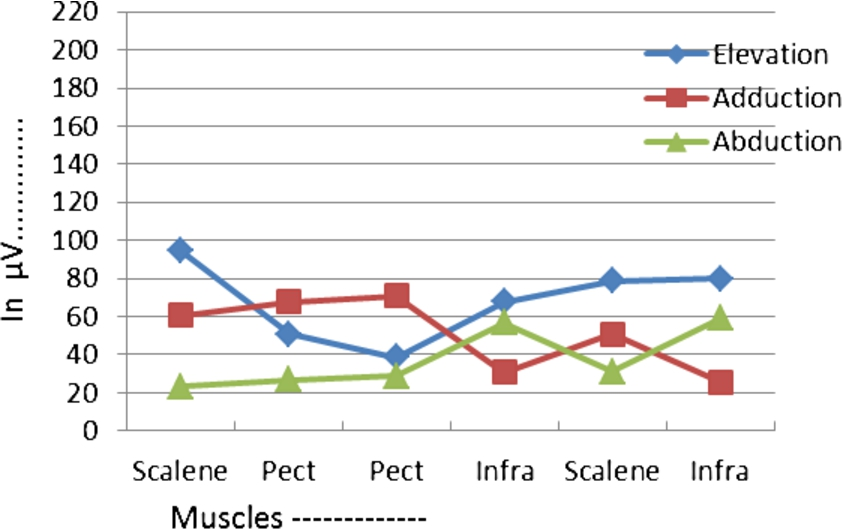
EMG signal produced by the muscles of non-amputee subject during three movements of shoulder.
SEMG signal was recorded from the muscles around shoulder. Figures 2 and 3 represent the changes in muscles activity throughout the elevation task for normal and amputee persons. The scalene muscles produced more electrical voltage due to elevation movements of shoulder than the Pectoralis and Infraspanatus. In non-amputee, the activation is more due to adduction and in amputee, due to abduction.

Different electrical voltage in microvolt produced by the muscles of amputee subject with the three movements of shoulder.
Time varying amplitude of SEMG signal at the same muscle point with the same movement of shoulder of non-amputee and amputee subjects
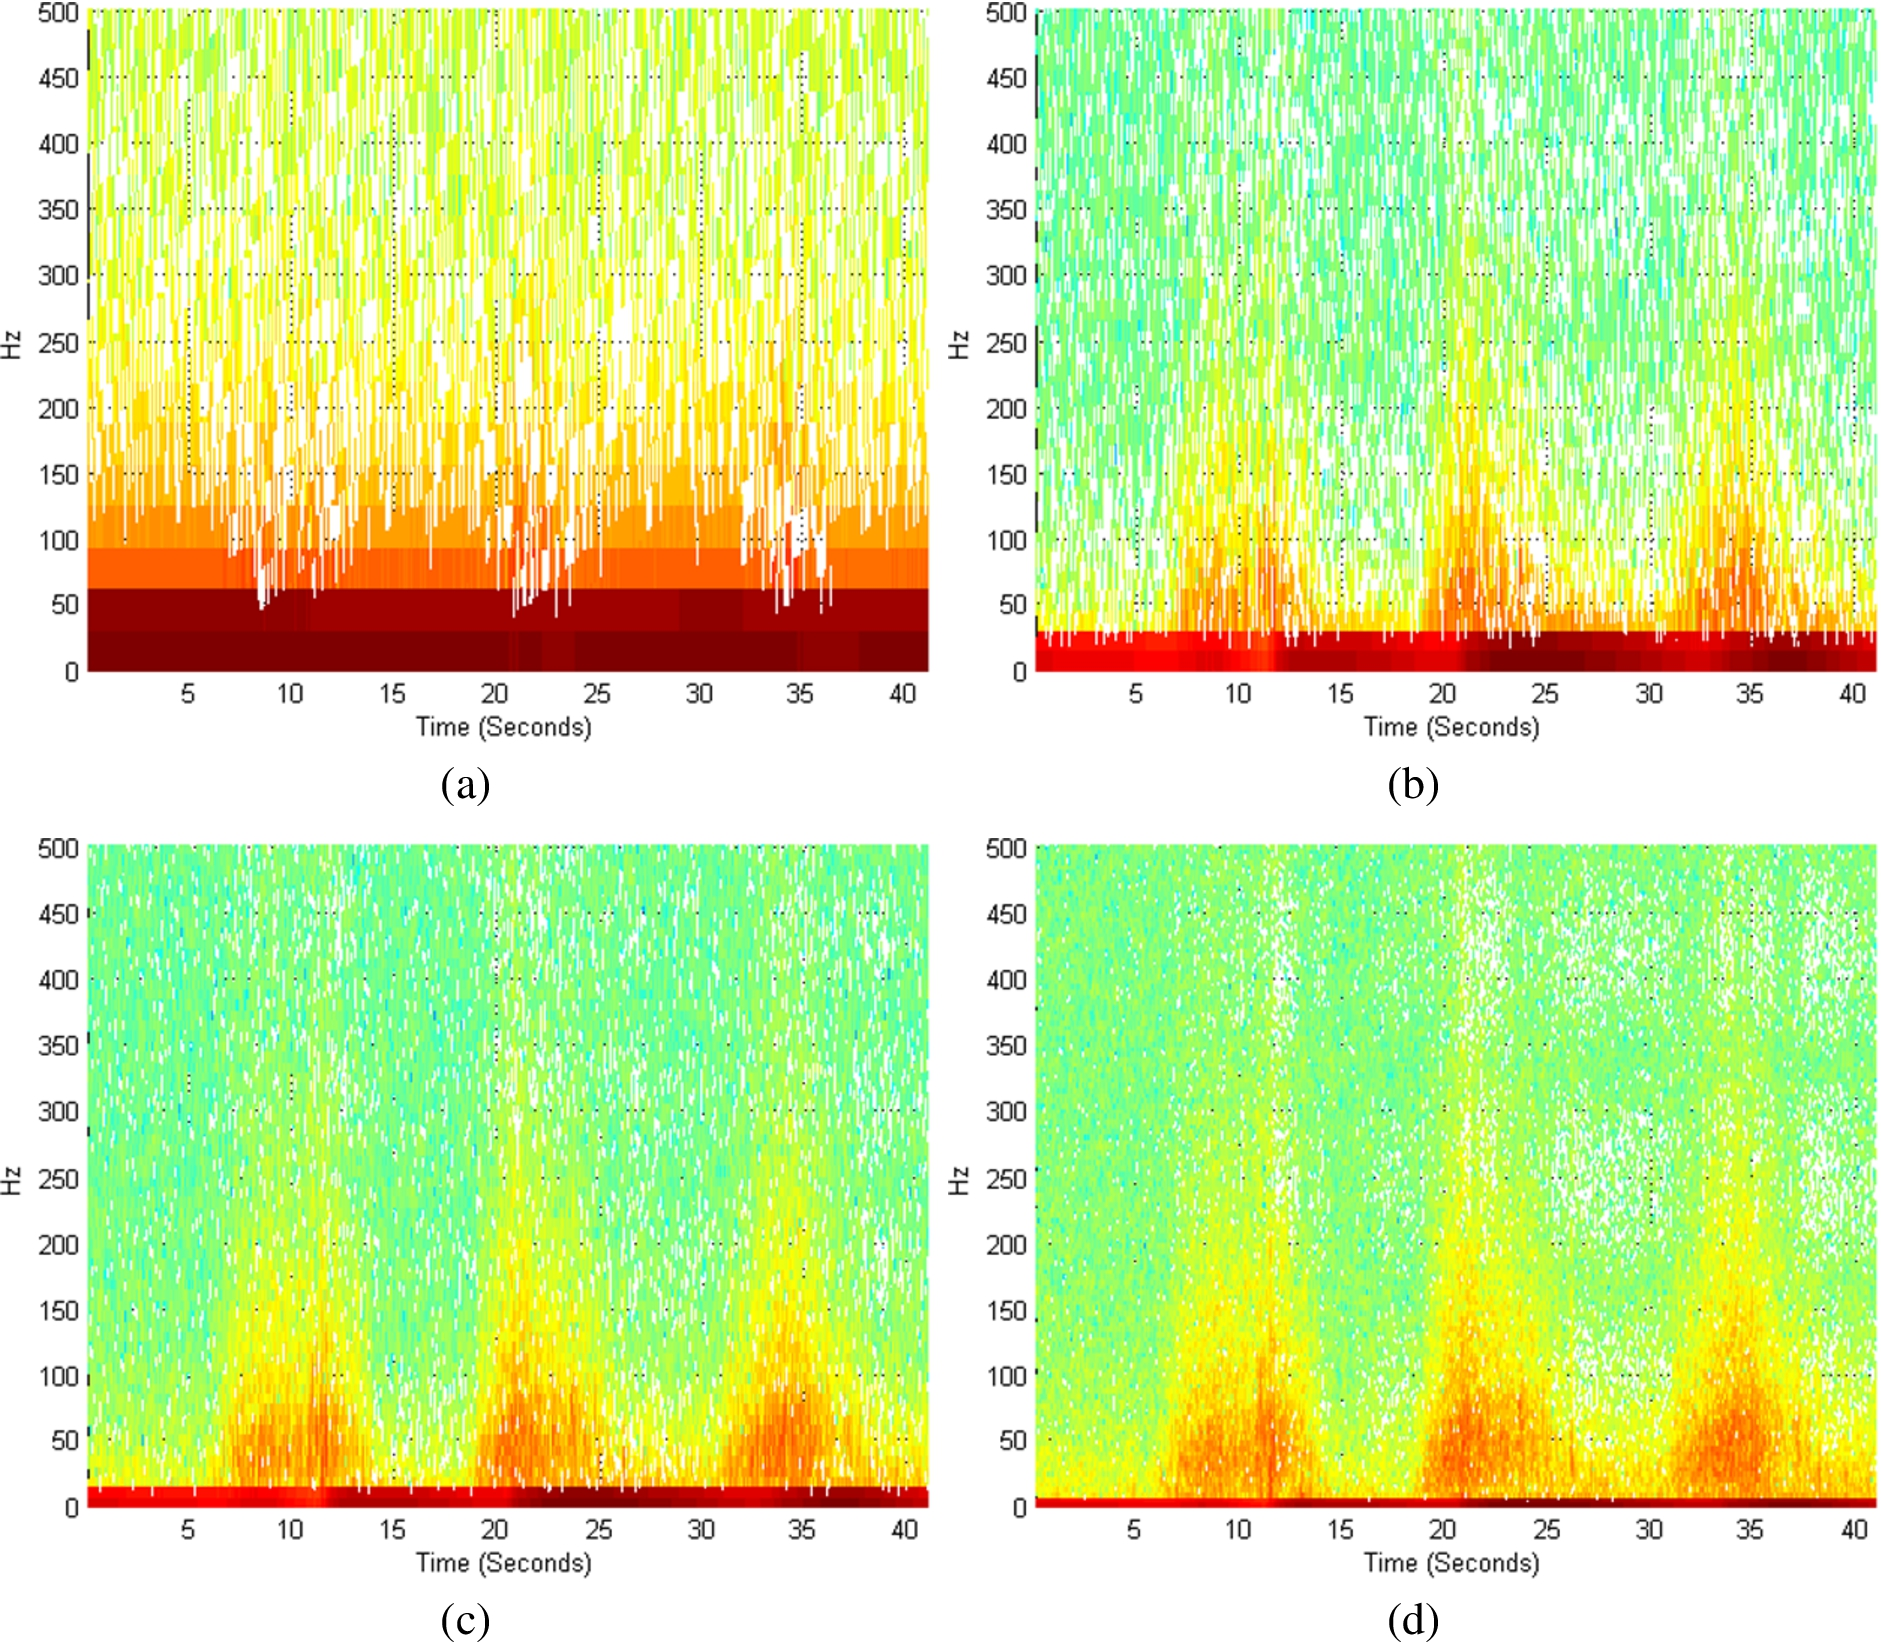
(a)–(d) Different spectrogram plots with different window length. (a) 32 samples, (b) 64 samples, (c) 128 samples, (d) 256 samples.
The overall activation of muscles was more in amputee than non-amputee persons. The values of the activated muscles were different at different time at same position and with same movement. Table 2 represents the change in SEMG amplitude with the time duration.
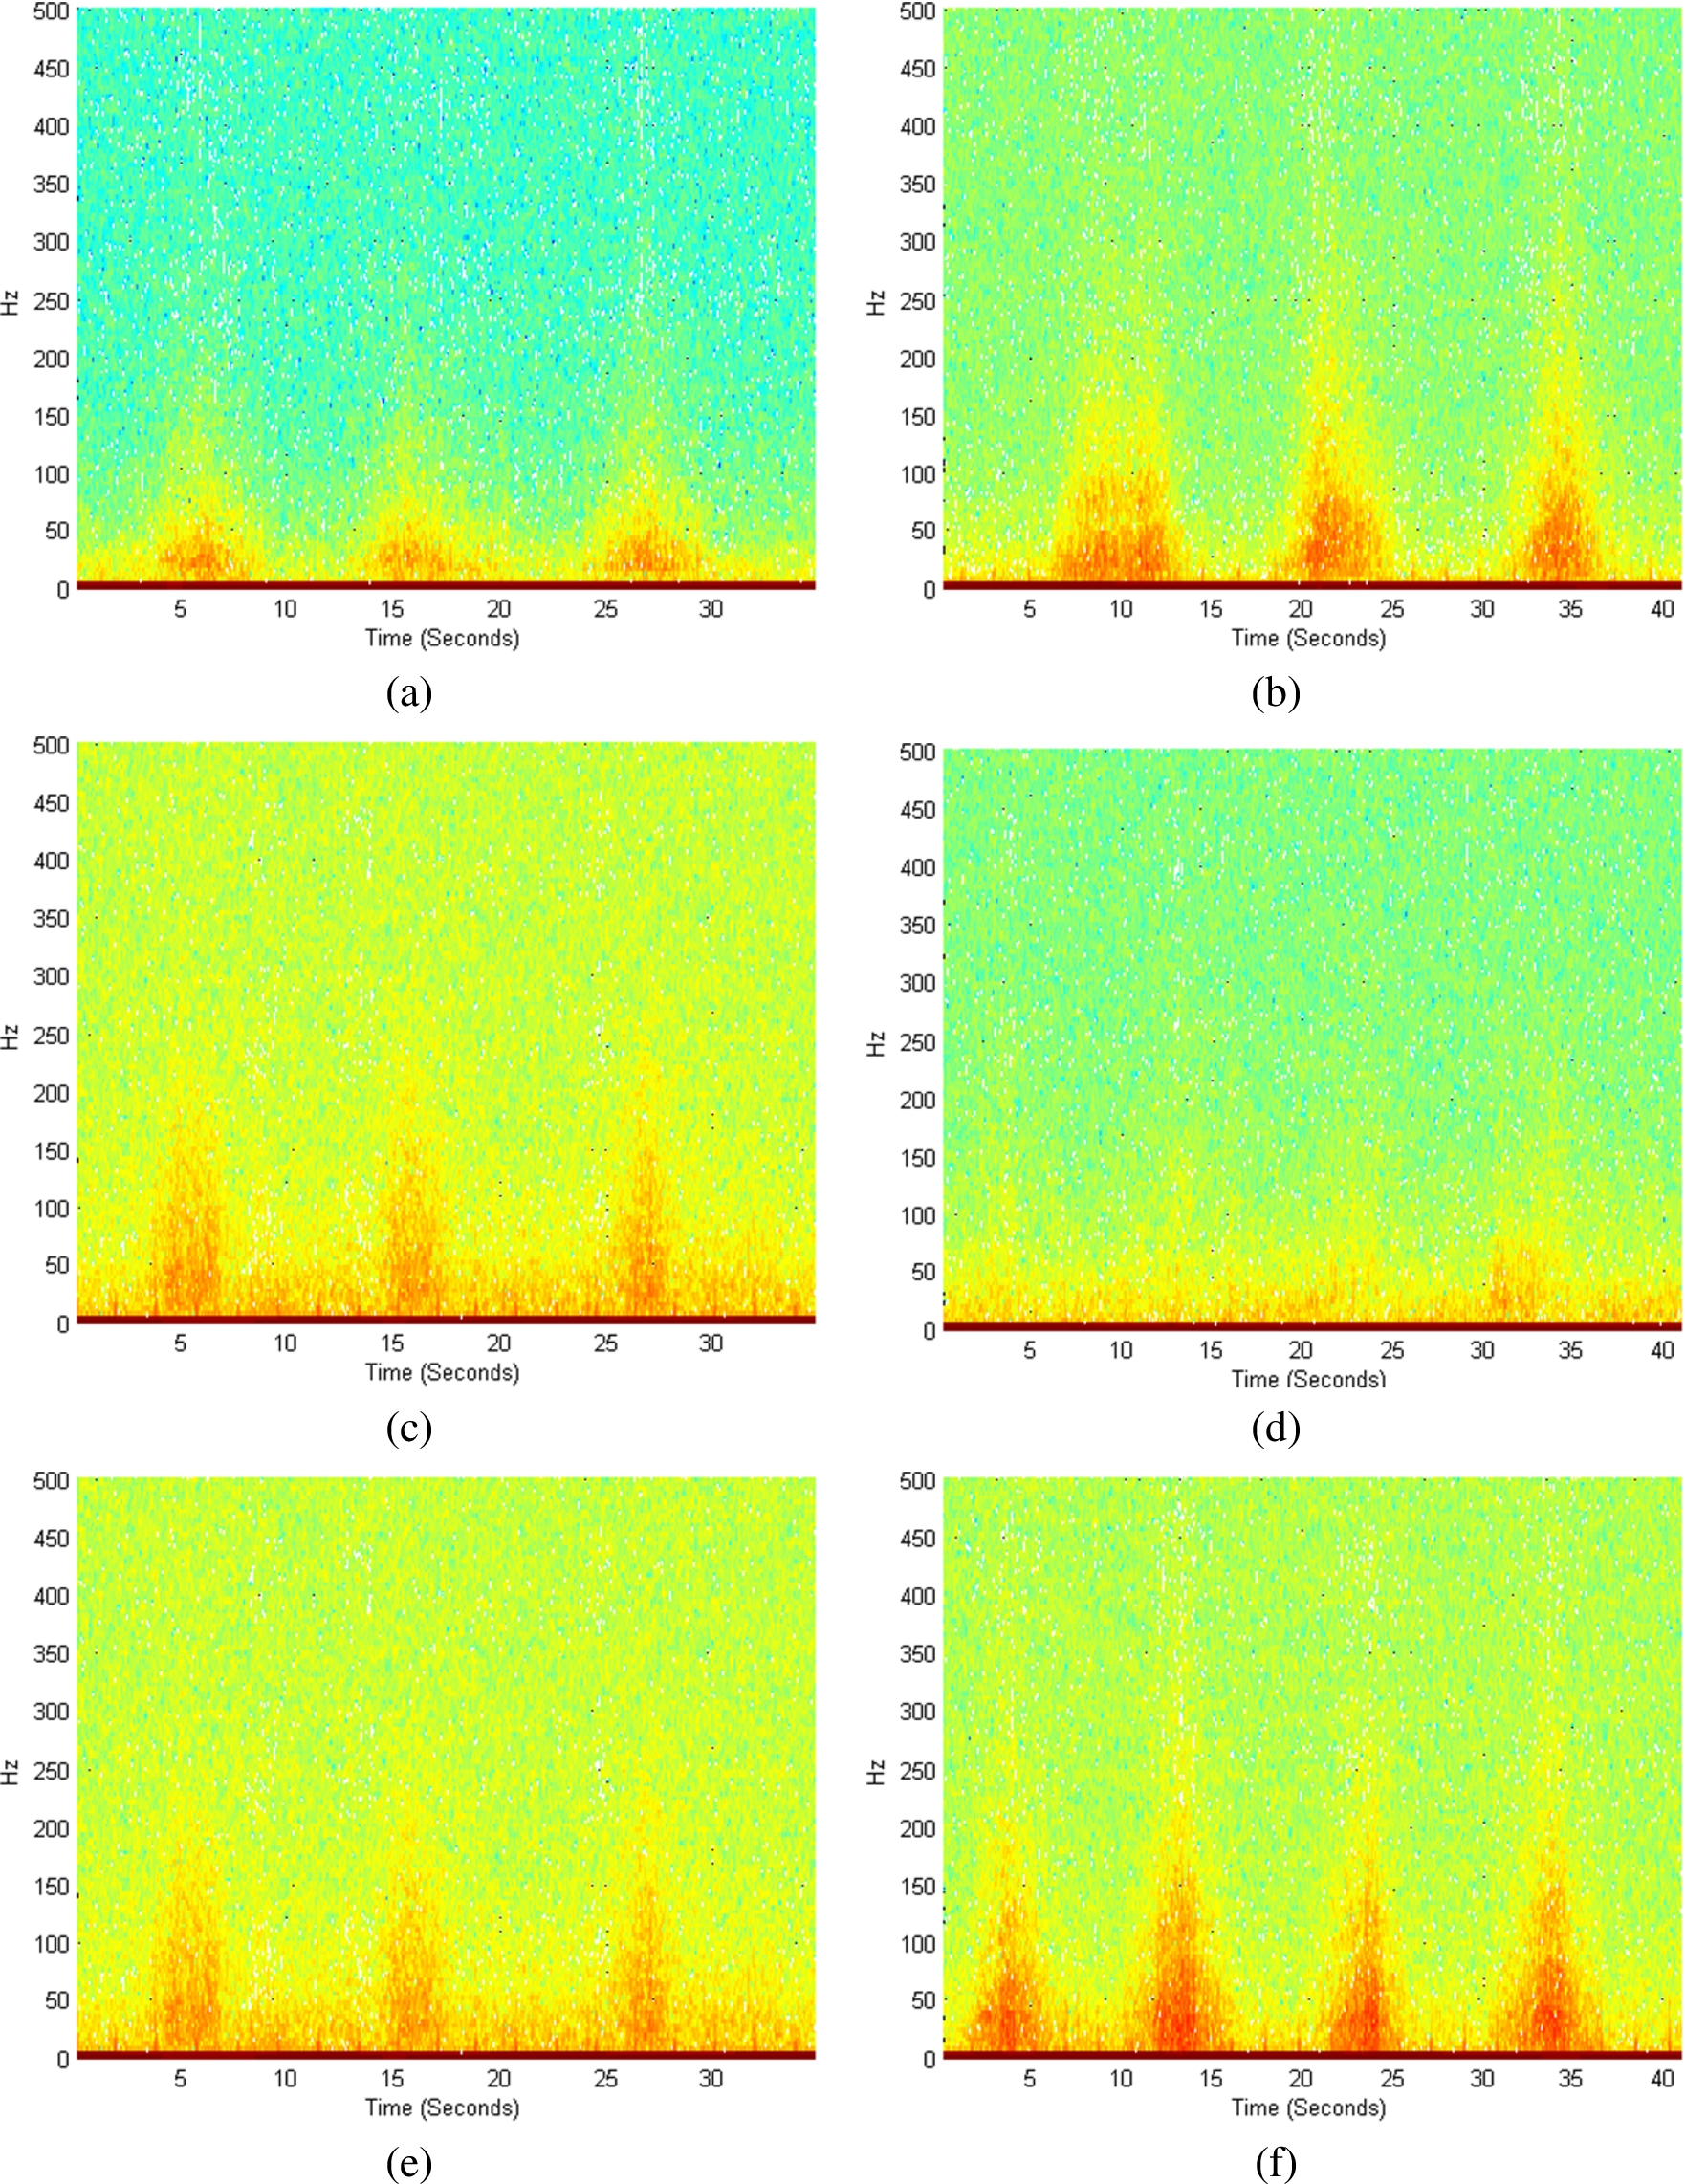
(a)–(f) Different muscles activation of infra and pect for non-amputee subjects. (a) Infra muscles with elevation. (b) Infra muscle with abduction. (c) Infra muscle with adduction. (d) Pectoralis muscle with elevation. (e) Pectoralis muscle with abduction. (f) Pectoralis muscle with adduction.
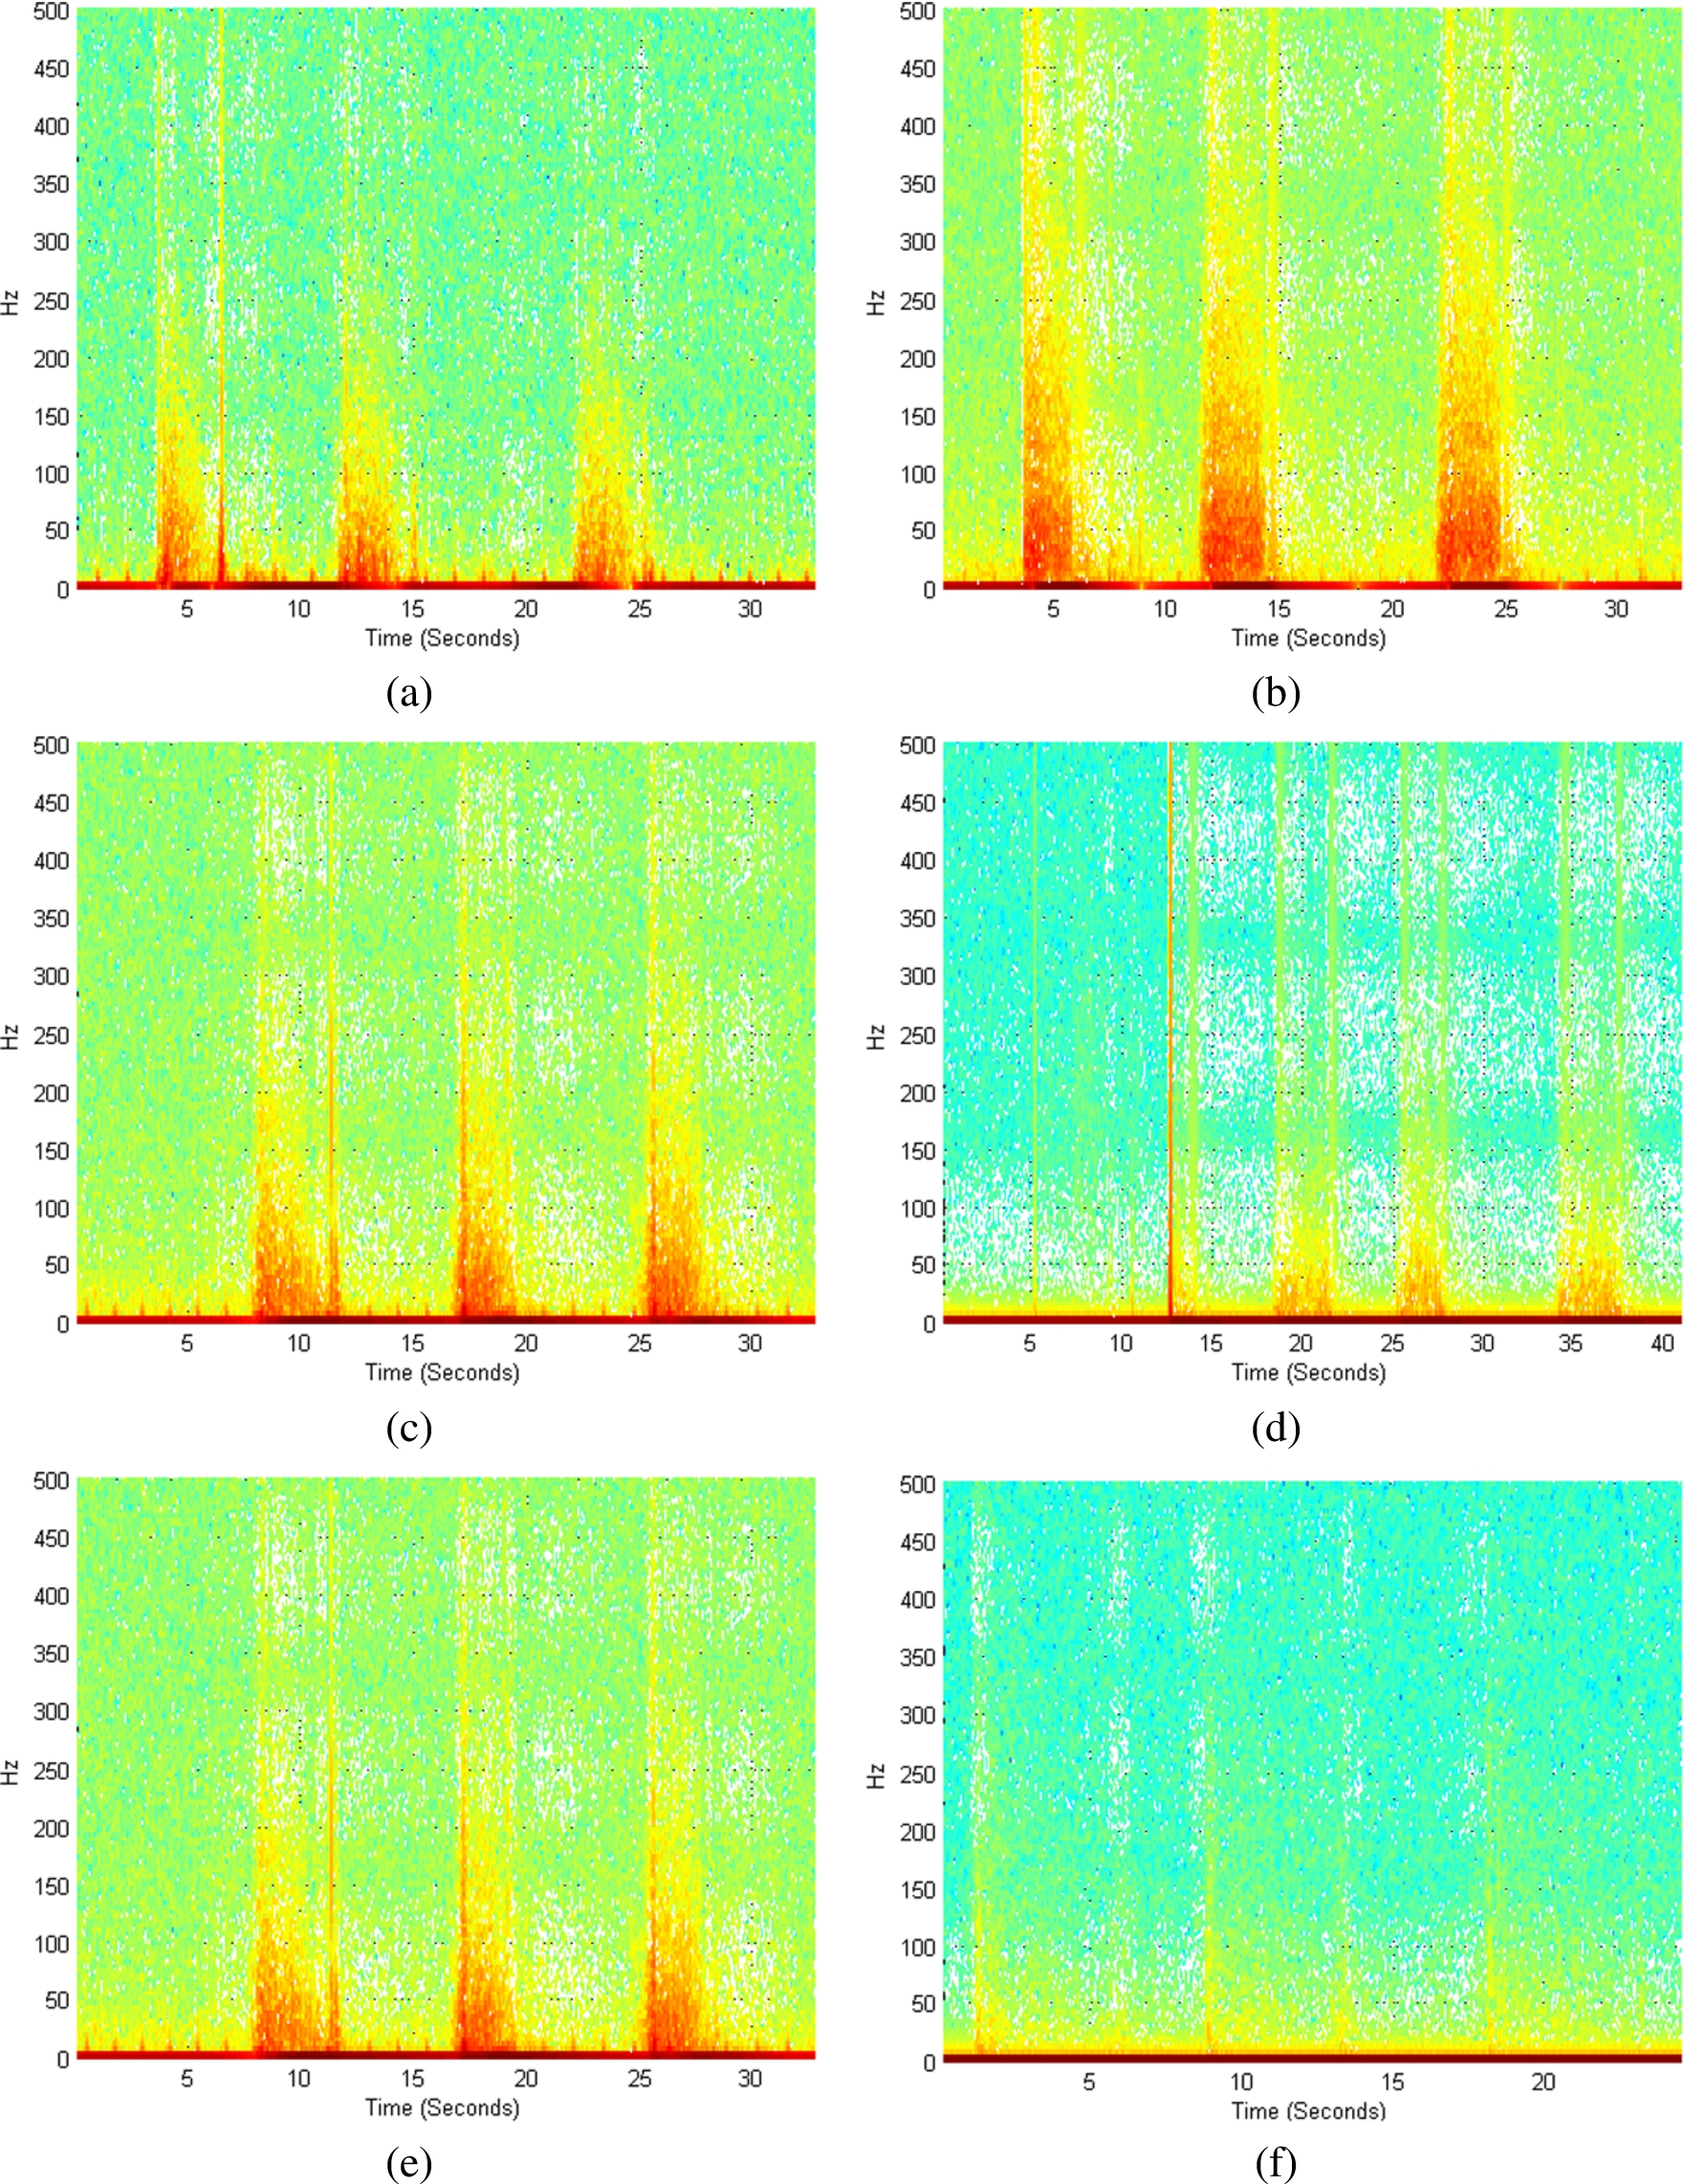
(a)–(e) Different muscles activation at infra and pect for amputee subjects. (a) Infra muscles with elevation. (b) Infra muscle with abduction. (c) Infra muscle with adduction. (d) Pectoralis muscle with elevation. (e) Pectoralis muscle with abduction. (f) Pectoralis muscle with adduction.
For time frequency representation of SEMG signal, the next parameter was the short-time STFT spectrogram [15]. The minimum sampling rate of the SEMG signal was set at 2048 samples per second. Figure 4 shows different spectrogram plots with different window sizes. The window size was increased from 32 to 512 and best resolution in the plot was found with 256-window size. The maximum value of frequency bins was selected as 512.
Next approach for determining the muscles activity was the STFT spectrogram. Figures 5 and 6 show the muscle activation with the STFT spectrogram for the both amputee and non-amputee subjects with Pectoralis and Infraspanatus muscles for three specified motions. In Pectoralis muscle, the maximum activation of muscles was in adduction motion than other motions. However, in Infraspanatus, the maximum activation was in abduction motion.
The electrode points were then attached at the Pectoralis and Infraspanatus muscles. Figure 5 shows the activated Infraspanatus with abduction and Pectoralis muscles with adduction in case of non amputation. However, in case of amputation, Infraspanatus and Pectoralis muscles gave the maximum activation at abduction muscles than other muscles.
This study helps to distinguish different motion of shoulder between amputee and control subjects. Implementation of these types of system gives the prosthetic user capability to perform different tasks with maximum efficiency in daily living. Using SEMG signal, it was observed that muscles around the shoulder indicate more activity in amputee person than in a normal person STFT spectrogram gives the plot of maximum muscles contraction. By varying the STFT window size, choice of 64 samples window with 512 frequency bins gives the best resolution for spectrogram plot. One can use this analysis for making a suitable device for around shoulder prosthetic user.
Conflict of interest
The authors have no conflict of interest to report.