
Abstract
The adsorption capacity of mesoporous silicate (MPS) materials as an adsorbent for protein adsorption from the aqueous phase and the mechanism of the adsorption processes by comparative analyses of the applicability of five kinetic transfer models, pseudo-first-order model, pseudo-second-order model, Elovich kinetic model, Bangham’s equation model, and intraparticle diffusion model, were investigated. A mixture of tetraethyl orthosilicate (TEOS) and triblock copolymer as a template was stirred, hydrothermally treated to form the mesoporous SBA-15 structure, and heat-treated at 550°C to form the MPS material, SBA-15. The synthesized SBA-15 was immersed in a phosphate buffered saline (PBS) solution containing cytochrome c for 2, 48, and 120 hours at 4°C. The TEM observations of proteins on/in mesoporous SBA-15 revealed the protein behaviors. The holes of the MPS materials were observed to overlap those of the stained proteins for the first 2 hours of immersion. The stained proteins were observed between primary particles and partly inside the mesoporous channels in the MPS material when it had been immersed for 48 hours. For MPS when it had been immersed for 120 hours, stained proteins were observed in almost all meso-scale channels of MPS. The time profiles for adsorption of proteins can be described well by Bangham’s equation model and the intraparticle diffusion model. The Bangham’s equation model is based on the assumption that pore diffusion was the only rate controlling step during adsorption, whose contribution to the overall mechanism of cytochrome c adsorption on SBA-15 should not be neglected. The kinetic curves obtained from the experiment for cytochrome c adsorption on SBA-15 could show the three steps: the initial rapid increase of the adsorbed amount of cytochrome c, the second gradual increase, and the final equilibrium stage. These three adsorption steps can be interpreted well by the multi-linearity of the intraparticle diffusion model, proving the significant role of intraparticle diffusion as one of the rate controlling mechanisms.
Background
Recently, there has been much interest in proteins such as bone-derived growth factors for the regulation of bone formation, and adsorption for developing useful carriers. The ordered mesoporous silicate (MPS) materials have a high surface area, their pore sizes are close to the diameters of biomolecules, and enclosure of the proteins and enzymes in a well-defined space may help to prevent denaturation. Since the M41 family (MCM-41 et al), various types of MPS materials have been synthesized by using the nonionic surfactant as a template [1]. SBA-15 prepared by using a commercial triblock co-polymer, Pluronic P123 (PEO20PPO40PEO20), has thicker pore walls compared to the MCM-41 and is stable and favorable for synthesis and applications.
The uniformity and direction of the pores of MPS materials allow control of molecular adsorption based on the size relation between the mesopores and the molecular dimensions of biomolecules. There have been many reports on protein adsorption capacity in the channel of the MPS support, and the capacity should be related to the electrostatic interactions, the protein, and the pore sizes [2,3].
Protein adsorption kinetics have been reported by T. P. B. Nguyen et al. [4]. They studied the adsorption mechanism by using the pseudo-first order model, pseudo-second order model, and intraparticle diffusion model of bovine serum albumin (BSA) adsorption on SBA-15 and reported that the adsorption kinetic data matches the pseudo-second order model, and the intraparticle diffusion model [5] is dominant with larger pore sizes [4]. The authors also used three kinetic models to investigate the adsorption processes of four kinds of proteins (BSA, β-lactoglobulin, myoglobin, and cytochrome c) on SBA-15. The adsorption processes of all proteins on/in SBA-15 could be better described by intraparticle diffusion model and confirmed by TEM observation [6].
Objective
The aim of this study was to investigate the adsorption capacity of SBA-15 as an adsorbent for protein adsorption from the aqueous phase and establish the mechanism of the proposed processes by comparative analyses of the applicability of five kinetic transfer models: pseudo-first-order model, pseudo-second-order model, Elovich kinetic model, Bangham’s equation model and intraparticle diffusion model, to lead an understanding of protein adsorption on the mesoporous material.
Method
MPS was synthesized by using a triblock copolymer, PEO20PPO70PEO20 (P123, Mw = 5,800, Aldrich), and TEOS. All chemicals used in this study except the triblock copolymer were supplied by Wako Pure Chemical Industries, Ltd. Japan and were used without further purification. 2.0 g of P123 was dissolved in 60 g of 2M HCl solution with continuous stirring at different temperatures varying from 35°C–60°C. 4.25 g of TEOS was added to the solution, and the solution was further stirred for 1 hour. The solution was hydrothermally treated at 100°C for 24 hours after stirring at each temperature for 24 hours. The precipitates were filtered, washed using Milli-Q water, dried at 80°C for 24 hours, and calcined. The temperature was increased up to 550°C with a heating rate of 1°C/min and kept at 550°C for 6 hours.
X-ray diffraction (XRD) analysis was carried out using an X-ray diffractometer (RINT 2000, Rigaku Co., Japan) at 40 KV and at 30 mA for a Bragg-Brentano geometry using Co Kα radiation and a graphite monochromator. The data were obtained by scanning for
Cytochrome c (Wako Pure Chemical Industries, Ltd. Japan) was used for protein adsorption and desorption on SBA-15. 50 mg of SBA-15, 50 mg of protein and 50 ml of protein were put into a 1/15 mol/l phosphate buffered saline (PBS) solution (pH 7.0) in a tightly sealed bottle and cooled to 4°C for 24 h statically. Then, the solution was filtered to remove SBA-15 and adsorbed protein. The amount of protein encapsulated on/in SBA-15 was determined by absorbance of the solution at a wavelength of 279 nm using UV-spectrometry (JASCO V-500, JASCO, Japan).
The mechanism of the adsorption processes determined by comparative analyses of the applicability of the five kinetic transfer models, pseudo-first-order model (1), pseudo-second-order model (2), Elovich kinetic model (3), and intraparticle diffusion model (4), Bangham’s equation model (5), can be expressed as follows [7]:
The TEM observation was carried out to investigate the protein adsorption behavior on/in SBA-15. For this observation, MPS powder before or after the protein adsorption process was embedded in epoxy resin. The MPS powder was soaked in 2% glutaraldehyde solution for 30 min. and then the rinsed thoroughly using PBS solution twice for 5 min. and ethanol for 10 min. After the dehydration process using anhydrous ethanol, the MPS powder was dispersed in resin solution (Ouken, Queto-812) and kept at 45°C for several days. After being embedded in the resin, the MPS material was cut out to form an ultra-thin section by conventional microtoming and was put onto carbon foils supported by copper grids. TEM observation was performed using a conventional TEM (JEM-2100, JEOL) operated at 200 kV. To avoid the charging problem during TEM observation, amorphous carbon was deposited onto the sample surface.
Results
The XRD analysis for SBA-15 presents a typical pattern, a sharp peak and two weak peaks, and these d-spacings show that this material has a 2 D hexagonal structure. The SEM observation revealed that the rod-like primary particles with length 1–2 µm were linked together in the long axis direction to form straw bundle-like secondary particles 20–30 µm long as shown in Fig. 1(a). The TEM images of synthesized SBA-15 shown in Fig. 1(b) show the ordered pores configuration in hexagonal-close packing. Longitudinal pores of uniform diameter are arranged in parallel as shown in Fig. 1(c). The specific surface area, mean pore size, and pore volume of a synthesized SBF-15 obtained by gas adsorption were 689 m2/g, 7.9 nm, and 0.92 cc/g, respectively.
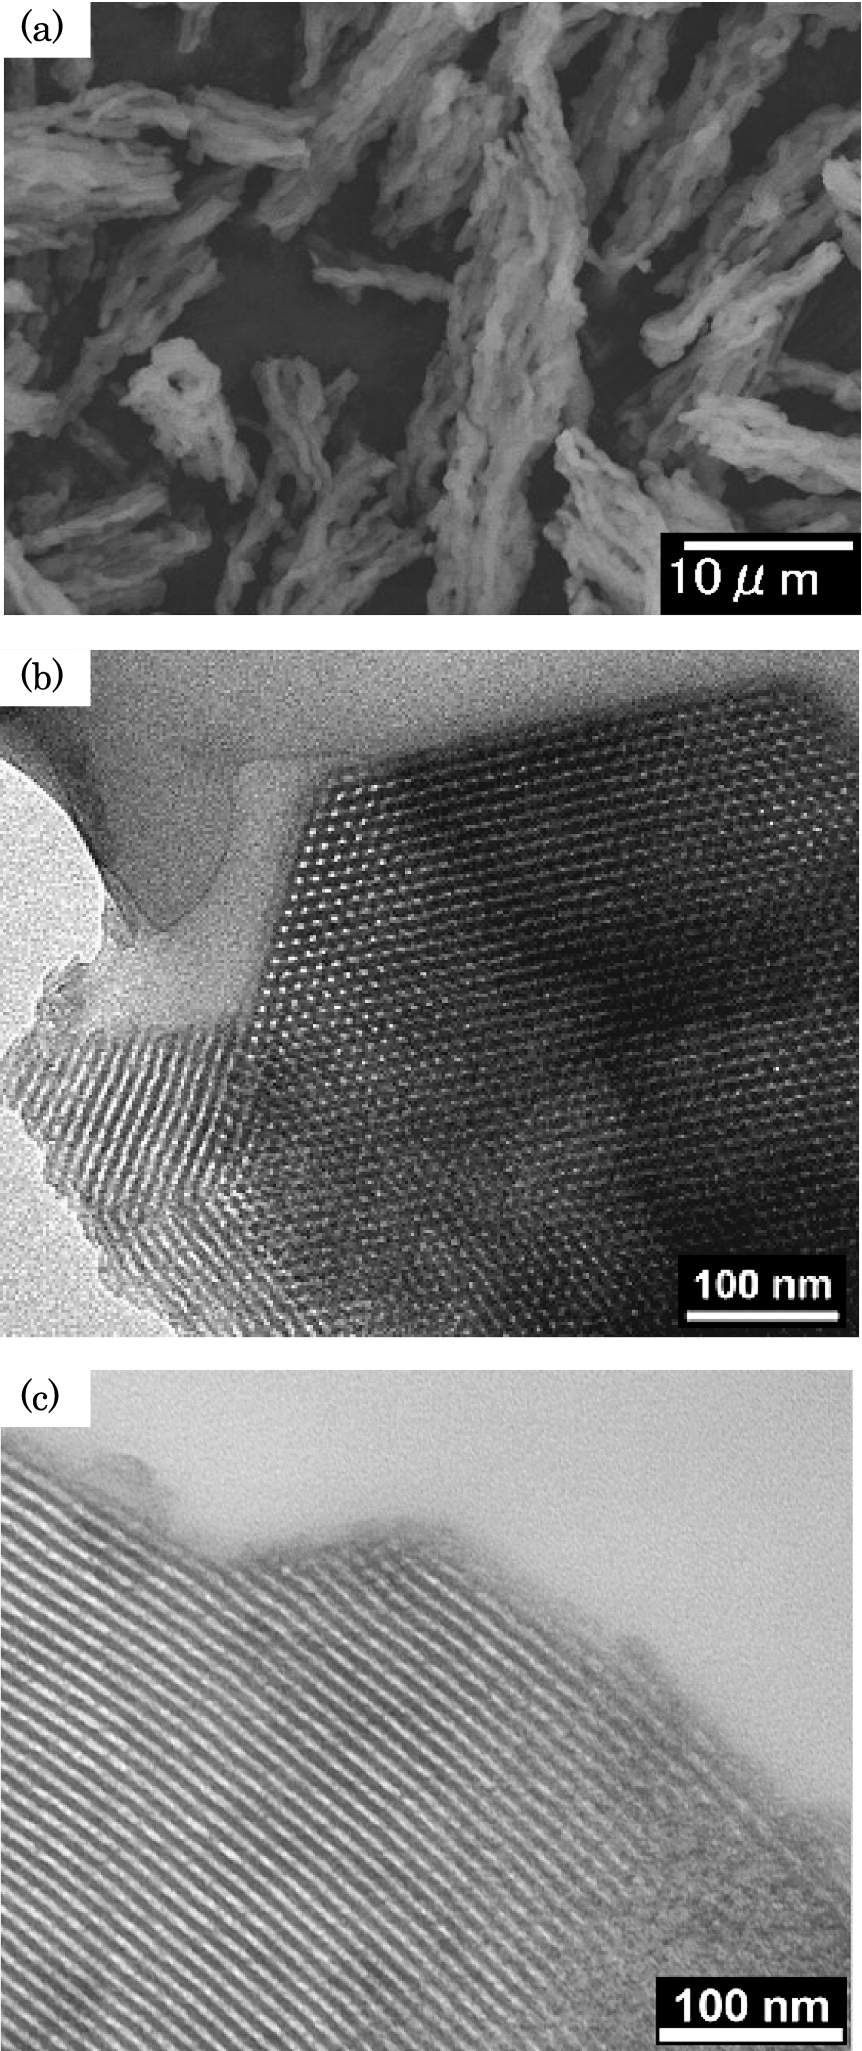
SEM (a) and TEM (b, c) images of SBA-15. Cross-section (b) and longitudinal direction (c) of primary particle of SBA-15.
Figure 2 shows the rate curve of different protein adsorption on SBA-15 in a PBS solution at pH 7. Cytochrome c shows a higher adsorption capacity due to the electrostatic interactions and size difference between protein and SBA-15 materials. Cytochrome c is small (12.4 kDa, 2.6 × 3.2 × 3.3 nm) compared to the pore size of SBA-15 and has an IP value of 10.1 [8] when positively charged in PBS solution.
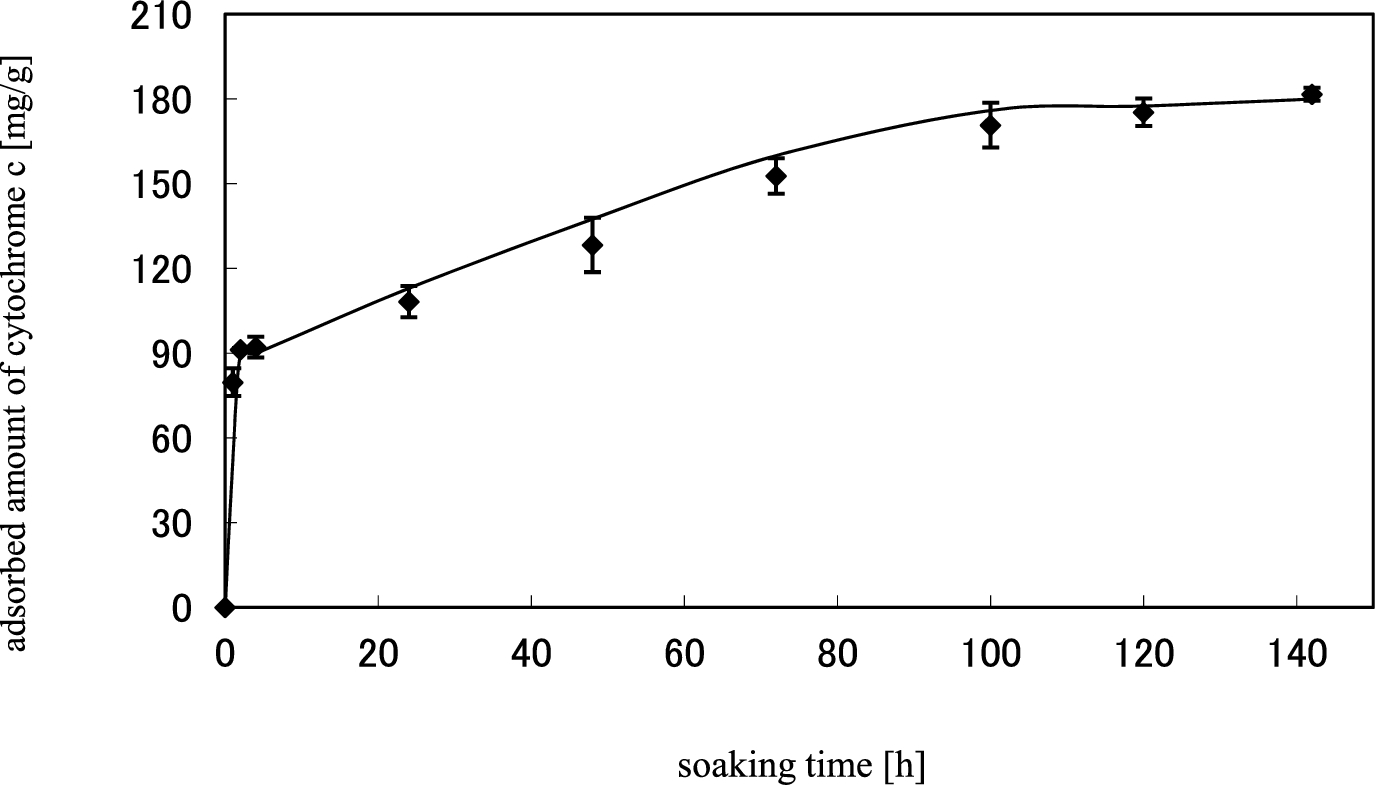
Adsorbed amount of cytochrome c on SBA-15 as function of soaking time.
Figure 3 shows the TEM images of SBA-15 soaked in cytochrome c solution for 96 hours. The mesoporous channels can be observed but look partially shaded compared to those before the adsorption process, which may overlap the stained proteins. The stained proteins were also observed between primary particles and inside the mesoporous channels.
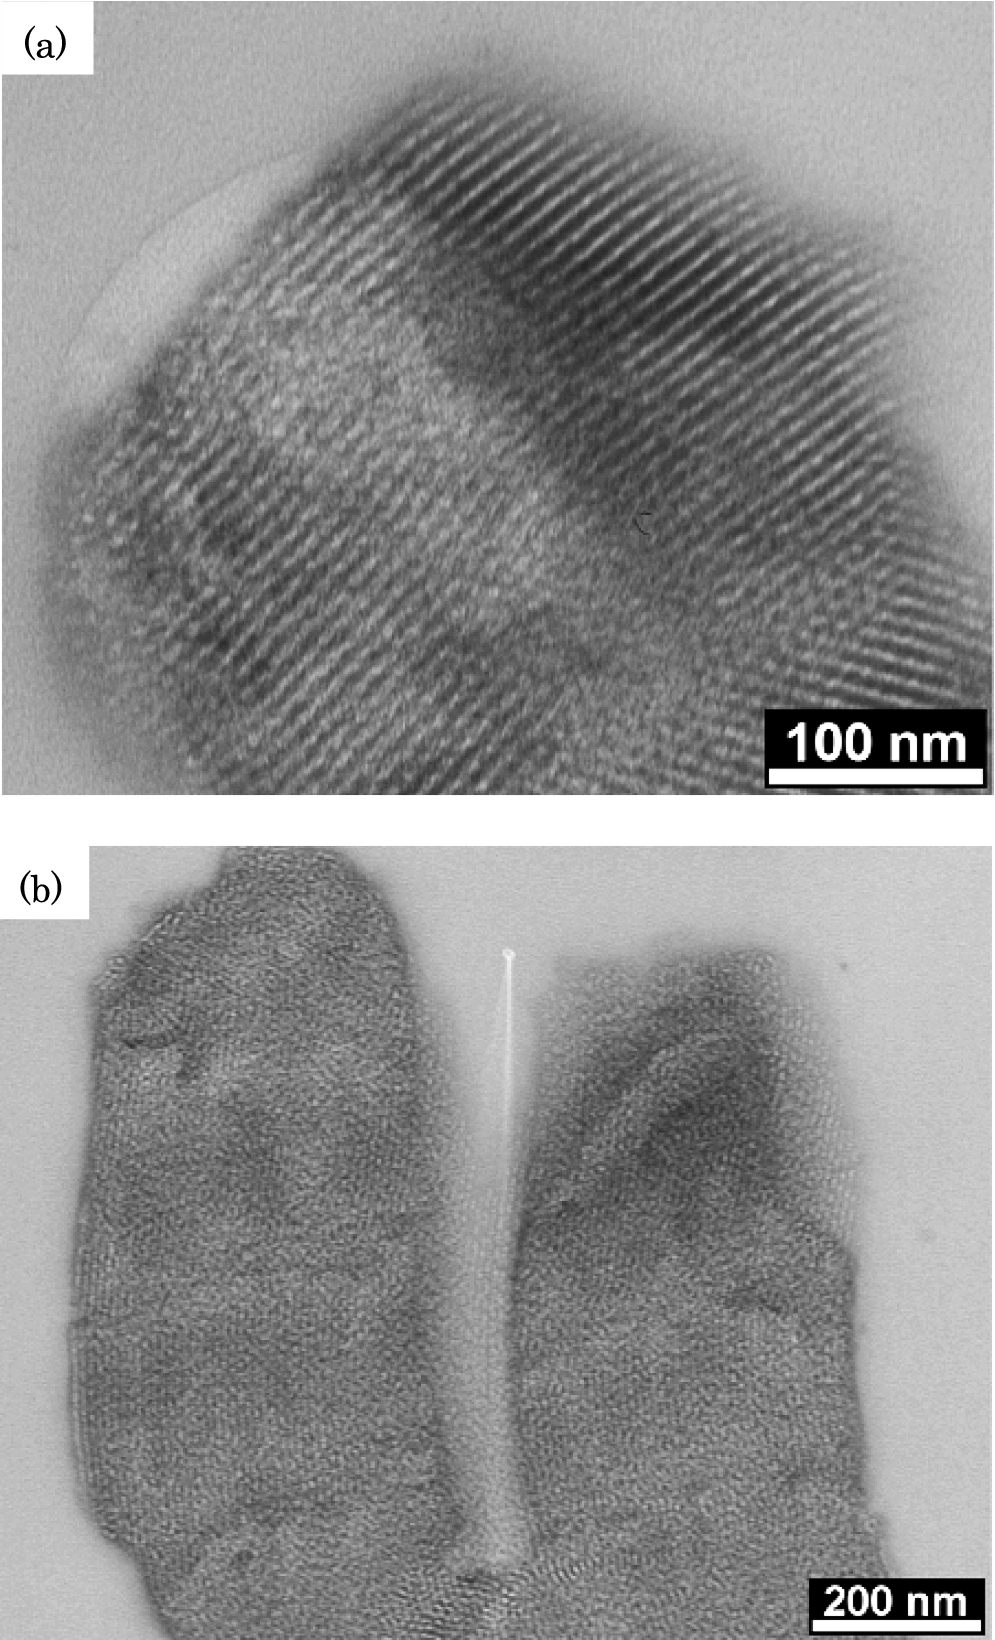
TEM images of SBA-15 soaking in protein solution for 24 hours. Stained proteins in mesoporous channels (a) between the primary particles (b).
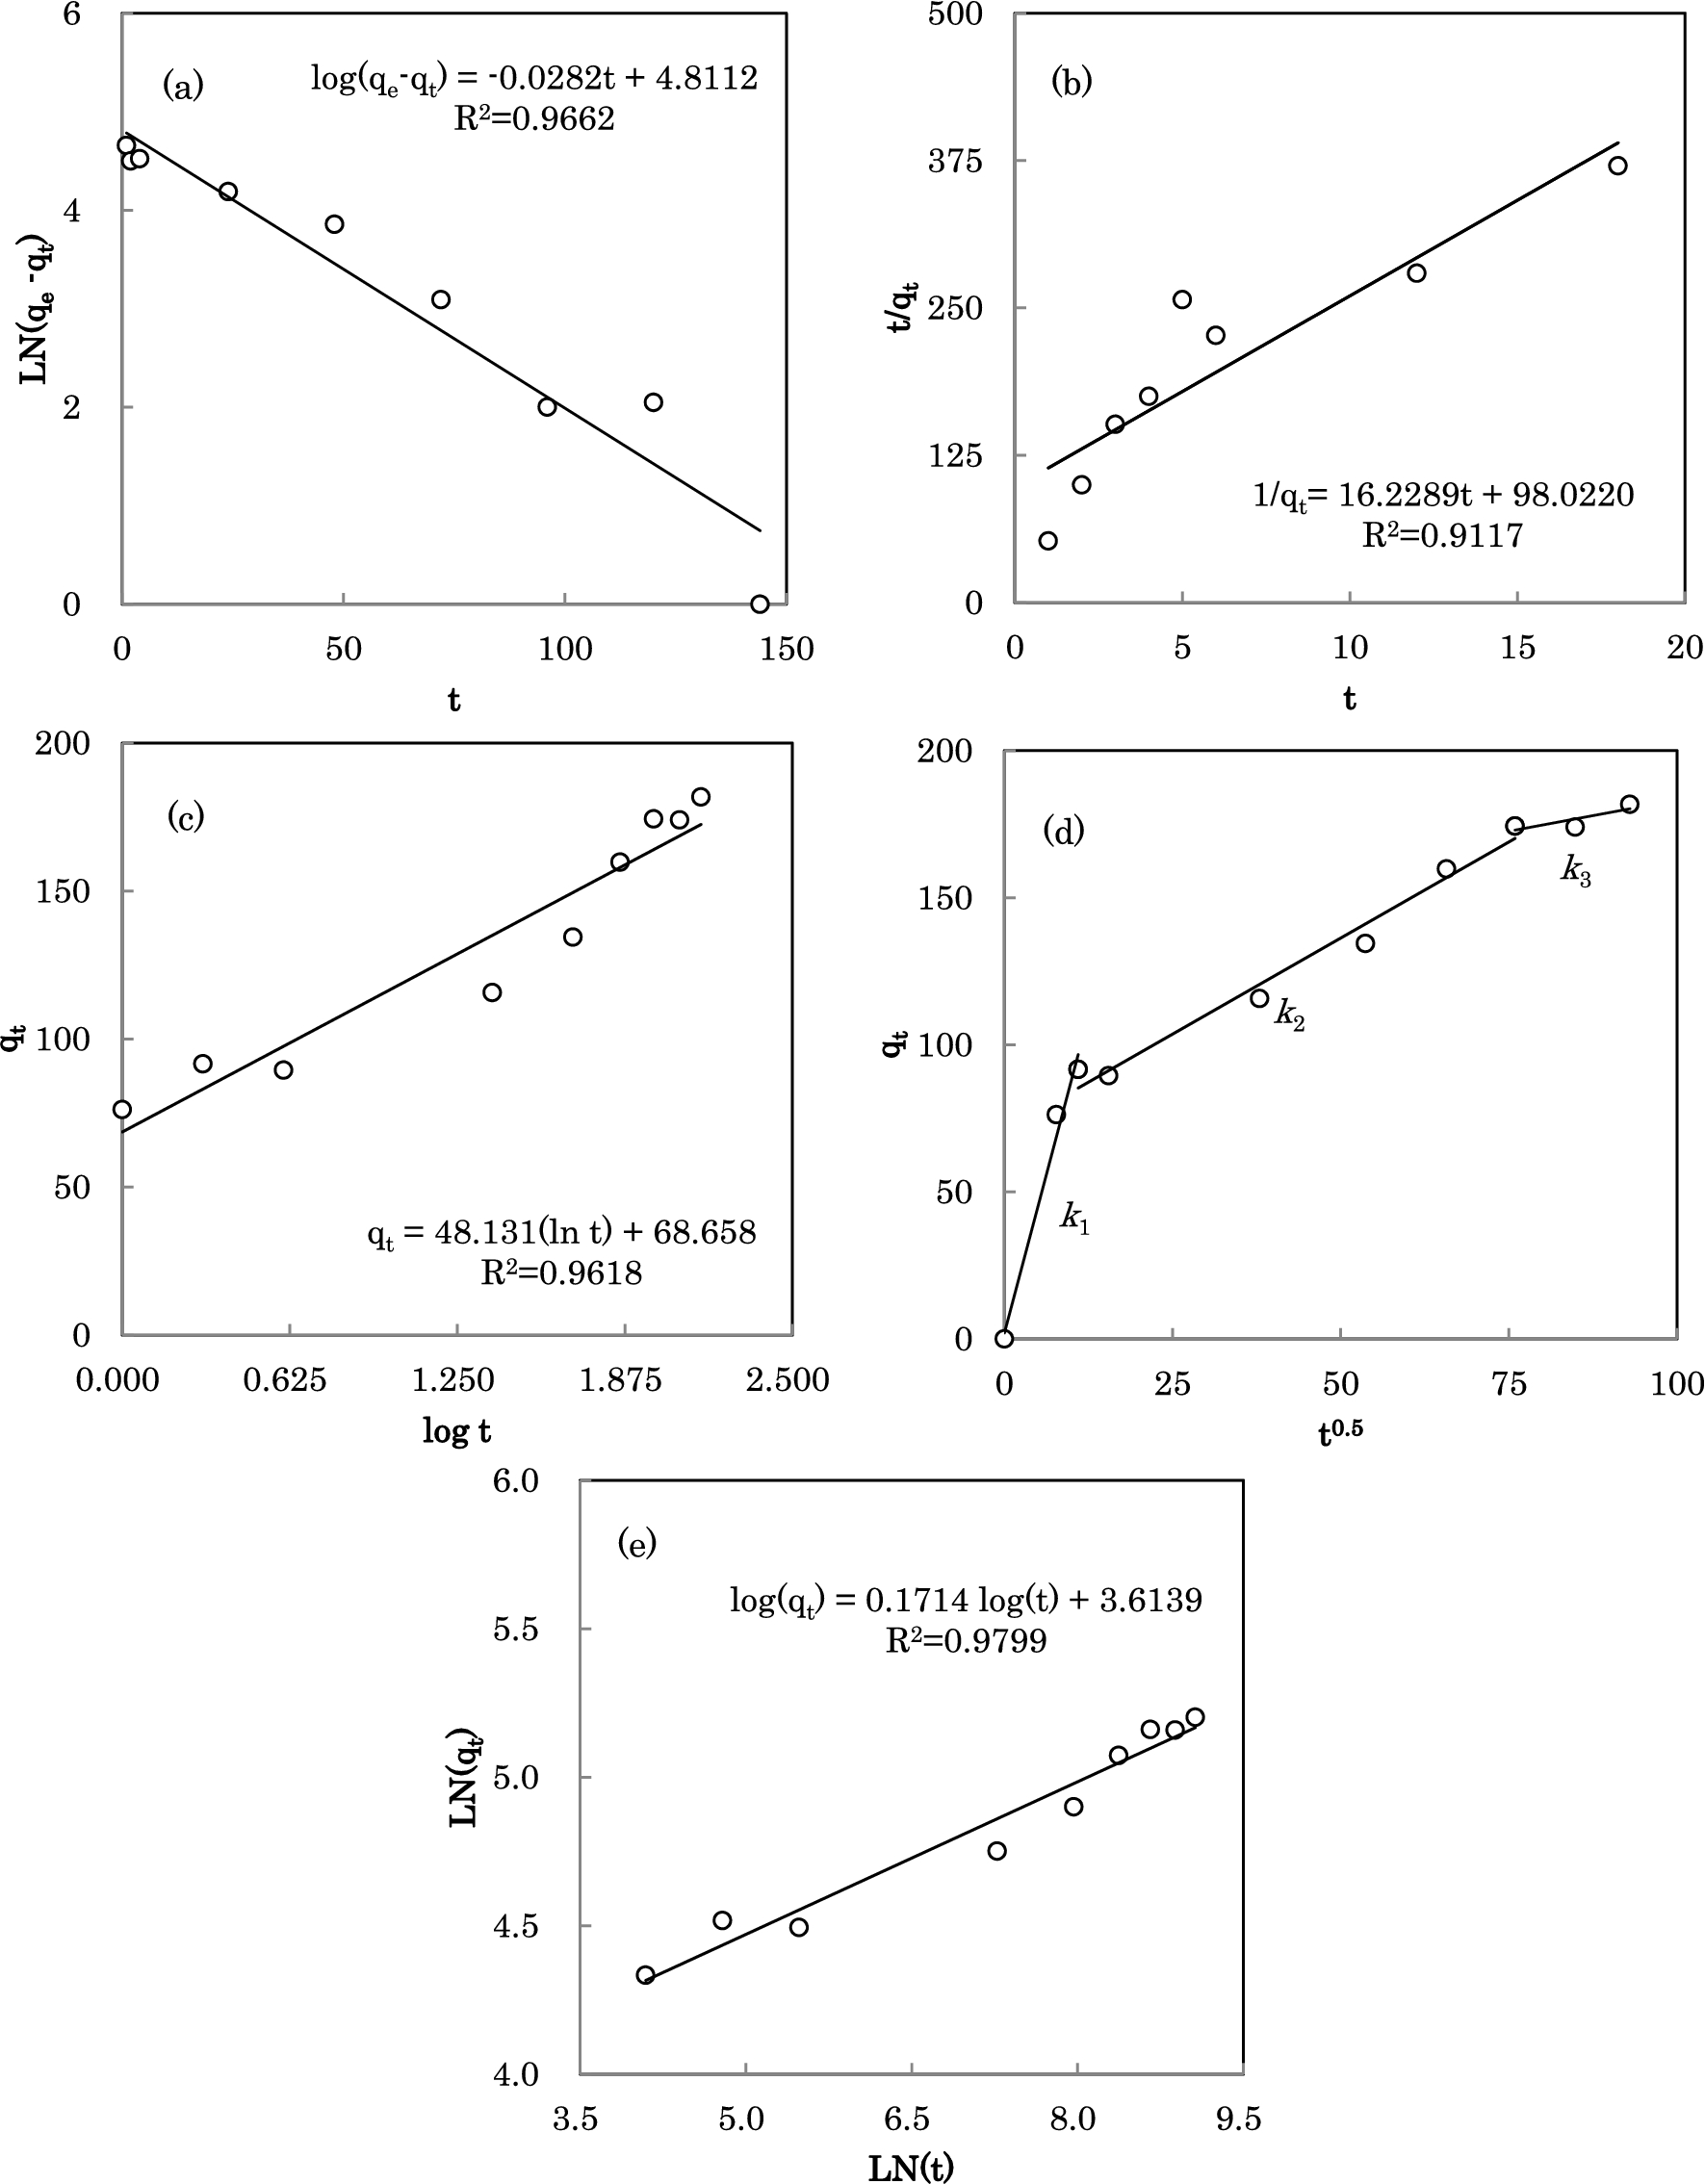
Figure 4 shows the straight line plots of cytochrome c adsorbed amounts in linear forms of the kinetic models and the coefficients (
Adsorbed amount (
Table 1 lists the rate constants (k), standard deviation (
The value of the regression coefficients of the pseudo-first-order model was lower than those of the other models, and the standard deviation (
The low value of the standard deviation of the intraparticle diffusion model and Bangham’s equation model proves the significant role of the rate controlling mechanism during cytochrome c adsorption on SBA-15. The Bangham’s equation model is based on the assumption that pore diffusion was the only rate controlling step during adsorption, whose contribution to the overall mechanism of cytochrome c adsorption on SBA-15 should not be neglected.
The kinetic curves obtained from the experiment for cytochrome c adsorption on SBA-15 could show the three steps: the initial rapid increase of the adsorbed amount of cytochrome c, the second gradual increase, and the final equilibrium stage. As shown in Fig. 1, SBA-15 forms straw bundle-like secondary particles composed of many rod-like primary particles linked together in the long axis direction. The adsorbed amount at the initial stage may be due to larger external cytochrome c transfers on the surface area of secondary particles available for adsorption. The second portion is the gradual adsorption stage, where the cytochrome c diffusion proceeds between the primary particles in the secondary particles. The third portion is the final equilibrium stage, where the diffusion inside the mesopores starts to slow down. The equation of the intraparticle diffusion model is also a diffusion kinetic model, where a graph of the adsorbed amount of protein against the square root of time may present a multi-linearity, which may be associated with the many steps in the adsorption processes. These three adsorption steps can be interpreted well by the multi-linearity of the intraparticle diffusion model, proving the significant role of intraparticle diffusion as one of the rate controlling mechanisms.
The protein adsorption on/in mesoporous SBA-15 was studied by using transmission electron microscopy (TEM) and the adsorption model is discussed with regard to time profiles for protein adsorption on/in SBA-15. SBA-15 was synthesized using P123 and TEOS and protein adsorption was carried out in PBS buffer saline at pH 7. The protein is used was cytochrome c, and the adsorption processes of protein on/in SBA-15 can be described well by Bangham’s model and the intraparticle diffusion model. The proteins were observed on the surface between primary particles and inside the mesoporous channels of SBA-15 using TEM, which can be interpreted with regard to the adsorbed area of protein on SBA-15.
Values of kinetic and diffusion parameters characterizing protein adsorption on SBA-15

Plot of measured and modelled time profiles for adsorption of cytochrome c on SBA-15. ∘: experimental, : pseudo-first-order model,  : pseudo-second-order model,
  : Elovich model,
  : intraparticle diffusion model,
  : Bangham’s equation model.
Footnotes
Acknowledgements
The authors thank Dr. T. Inamura for carrying out the BJH pore size distribution measurement at the Technology Research Institute of Osaka Prefecture.
Conflict of interest
The authors have no conflict of interest to report.