



Abstract
The article deals with the testing of features for fatigue detection in electrooculography (EOG) records. An optimal methodology for EOG signal acquisition is described; the Biopac data acquisition system was used. EOG signals were being recorded while 10 volunteers were watching prepared scenes. Three scenes were created for this purpose – a rotating ball, a video of driving a car, and a cross. Recorded EOG signals were processed and 20 features were extracted. The features involved blinks, slow eye movement (SEM), rapid eye movement (REM), eye instability, magnitude, and periodicity. These features were statistically tested and discussed in terms of fatigue detection ability. Some of the features were compared with published results. Finally, the best features – fatigue indicators – were selected.
Introduction
Fatigue is a complex phenomenon [1]. It has subjective symptoms and is not very well understood [2]. Moreover, its causes are varied [2]. This means it cannot be objectively measured. Fatigue can be divided into physical (muscle) and mental fatigue. Muscle fatigue results in decreased force of the muscles [3]. Mental fatigue is usually caused by prolonged periods of cognitive activities [1].
Fatigue influences concentrating, focusing on tasks, and flexibility [1,4]. Mental fatigue impairs physical performance [5]. Fatigue can be very dangerous. For example, an exhausted driver cannot react properly to unexpected situations and can cause accidents [4]. Fatigue constitutes a potential risk in many other jobs such as those of a soldier, police officer, rescuer, operator of hazardous equipment, physician, and other jobs where people have to be concentrated for a long time and their jobs are very responsible and dangerous [5,6].
These reasons are good enough to deal with fatigue – to evaluate it and, if need be, to warn the respective person that they are fatigued.
There are different methods for fatigue detection. The most widely used methods (especially for drivers and pilots) are based on biosignals [5–10], video recording [5,10], and steering wheel grip force [8] or their combinations. Frequently used biosignals include, in particular, the electrooculogram (EOG) [5–10] and electroencephalogram (EEG) [4]. The parameters extracted from videos are the eye-closure percentage (PERCLOS), blink frequency, eye movements, yawn frequency, and body posture [5,11].
The EOG signal seems to be appropriate for fatigue evaluation. Its measurement is noninvasive and needs only few electrodes. These electrodes are deployed on easily accessible body parts, around the eyes and on the forehead. Alternative electrode placement is only on the forehead [7]. This placement of electrodes does not obstruct the view and the electrodes are therefore more comfortable to wear in practice. The main disadvantage is here the necessity of separating the EOG signal from the forehead signal. The measurement of EOG is comfortable for the volunteer research subjects and quite simple for the experimenter. The advantageous characteristics of EOG signals are their great magnitude and high signal-to-noise ratio. These facts are useful for signal processing and evaluation. If we compare EOG with EEG, the acquisition of EOG data is easier, there are fewer artifacts in EOG and subsequent processing is faster [6].
The aim of this work is to extract various features from EOG signals and to test them in terms of fatigue detection ability. For this purpose, 3 different scenes were created which are seen by the subjects with simultaneous recording of EOG signal. The objective is also to find out the influence of each scene or different eye movements on fatigue.
The general process of fatigue evaluation from EOG signals is shown in Fig. 1.
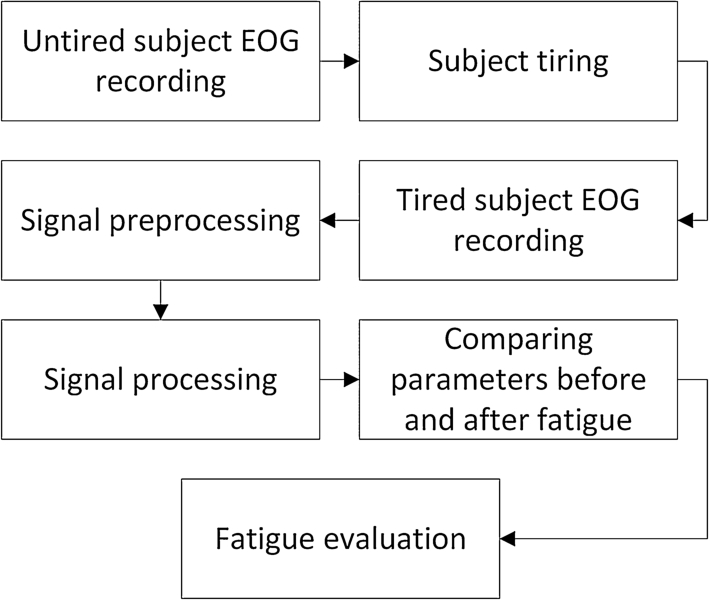
Block diagram of the general process of fatigue evaluation from EOG signals.
Fatigue can be evaluated only relatively. There are two possible ways of doing it:
To record EOG signals of the untired subject (human volunteer), to fatigue this subject and to record the signals again.
To record EOG signals continuously while tiring the subject.
The process of EOG signal recording is described below as well as the scenes the subjects were watching during the acquisition.
To become fatigued, the subject did various but defined extreme eye movements (maximized the range of eye movements) for 7 minutes. The subject sat in front of a fan to enhance and speed up the onset of fatigue. The fan simulated, for example, the influence of air-conditioning.
First, the recorded signals were preprocessed. They were cut off in time to have the defined length. In particular, the initial unstable part was cut off. The length of each signal should be the same for all the subjects.
Different parameters can be obtained from the EOG signal via signal processing. The algorithms were different for every type of signal (depending on the scene the subject was watching during the recording of the signal). The signal-processing is described in Methods. In this work we extracted 20 parameters. In the Results these parameters are statistically evaluated and discussed in terms of fatigue detection ability.
Ten volunteers participated in this experiment.
The EOG signals were acquired at a Brno University of Technology (BUT) laboratory. In accord with the applicable laws of the Czech Republic, we did not need the ethics committee approval for this kind of research project. We acquired signals from 10 healthy volunteers on an ethically solid base: with their written informed consent, the measurement was noninvasive and only minimal risk was involved. Personal data and other sensitive data have been neither collected nor processed.
In following chapters, the acquisition system, newly prepared scenes and three different methods for 20 features extraction are described. The first method used for magnitude and period length feature extraction is completely new. We also improved the second algorithm for blink feature extraction in terms of precisely marking the blinks – for this purpose, the set of rules was established. The second algorithm was partially utilized for extraction of the next new feature – eye instability. We eliminated blinks from vertical EOG and then we newly calculated the Euclidean distance in 2D space to quantify the eye movements (instability). The last method for REM feature extraction was enriched by the automatic threshold calculation in this article.
Biopac acquisition system
To record EOG signals, we used the Biopac acquisition system. According to [12,13], this system consists of the Biopac MP35 acquisition unit, SS2L electrode lead set, Ag–AgCl electrodes, a PC with monitor and installed Biopac software, and another PC with monitor for the prepared scene projection.
We placed 6 Ag–AgCl electrodes around the subject’s eyes and on the forehead as described in [12]. These electrodes were connected via electrode lead sets to the acquisition unit. The EOG was recorded in two channels – one for horizontal movements and the other for vertical movements. The subject was sitting on a chair and his/her eyes were 40 cm far from the monitor. The monitor was shifted such that the subject’s eyes looked at the center of the monitor. The subject watched the prepared scenes described below.
To acquire EOG signals, we set the acquisition parameters as in [13]. Table 1 shows these parameters.
EOG Acquisition Parameters
EOG Acquisition Parameters
In this work, we created three different scenes (picture, animation, and video). The subject was watching these scenes while the EOG signal was being recorded. The aim of each scene was to lead the subject’s eyes in the desired way (3 scenes, 3 different ways).
The first scene was the animation of a ball moving on circular trajectory (rotating ball). While watching this scene, the subject’s eyes did the same movement repeatedly (periodically).
The second scene was a video of driving a car and it was dynamic. The subject should watch this scene naturally.
The third scene was a cross. The subject’s eyes were fixed on the center of the cross. Our goal was to record very small, in particular involuntary eye movements. Because of the small magnitude of this signal, the blinks were clearly visible. This was advantageous for the signal processing.
Magnitude and period length feature extraction
The magnitude and period length features were extracted from the signal recorded while watching the rotating ball. The block diagram of this new algorithm, which we created for magnitude and period length estimation, is shown in Fig. 2.
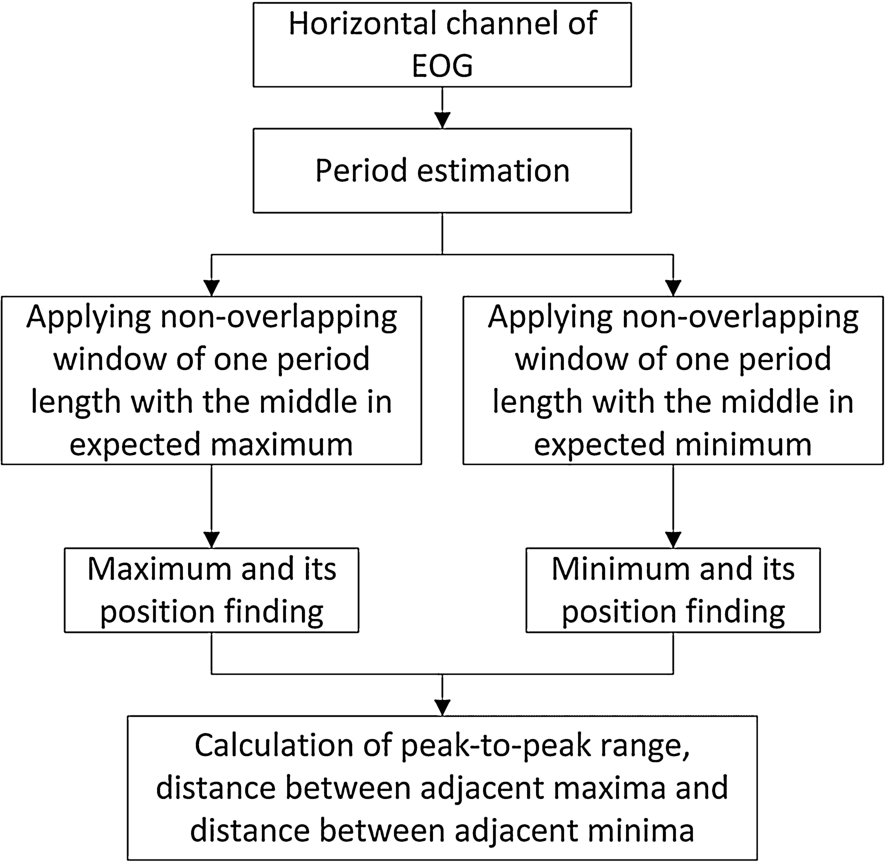
Block diagram of the algorithm for magnitude and period length extraction.
The input of this algorithm was the horizontal component of the EOG signal. In the horizontal component, blinks were not visible and did not distort the parameters. The period of this signal was estimated directly from the signal (high accuracy was not required). The non-overlapping window was applied to the signal. The length of the window was one period and its middle was in the expected extreme (maximum or minimum) of the period of the signal. The algorithm searched for the maximum and minimum and their positions (time) in every window. In the next iteration, the window position was adjusted according to the position of the preceding extreme. This was done in order to find the proper extreme although the initial estimation of the period was inaccurate or there were big deviations from signal periodicity. Maximum in each period, minimum in each period, peak-to-peak range, distance between adjacent maxima, and distance between adjacent minima were calculated.
Two signals from each subject were processed. This is illustrated in Fig. 3. The first estimated period is marked by the dashed vertical line. The first signal should not include fatigue (upper signal) whereas the second could (lower signal). The circles mark the maxima and crosses mark the minima in each period.

Horizontal component of EOG recorded while watching the rotating ball. Signal before fatigue is above. Signal after fatigue is below. The dashed line marks the estimated first period. Crosses mark the minima. Circles mark the maxima.
The blink features were extracted from the signal recorded while fixating the cross. The algorithm was based on the articles [6,9], where the description of the original algorithm can be found in detail. It was adapted to the background and signals in this work. A simplified block diagram is shown in Fig. 4.

Simplified block diagram of the algorithm for blink feature extraction.
The input of this algorithm was the vertical component of the EOG signal, where the blinks were clearly visible. As in [5,6], the signal was filtered by a low-pass filter with a frequency of 10 Hz and the delay was compensated for; the difference of the signal was then computed. To obtain the best results possible, we estimated two thresholds (positive and negative) empirically and individually for each subject. We applied these thresholds to the difference signal and obtained intersection points. The aim was to preserve only those intersection points that mark blinks, other intersection points were deleted.
To detect blinks more precisely, we made some improvements. If a peak had just one point in common with the threshold, the point was deleted. If there were two adjacent peaks (either both positive or both negative) above the threshold and their distance was smaller than the estimated distance, we deleted the two inner points. These two peaks were evaluated as one. The remaining intersection points were projected into the filtered signal. After that we investigated whether four adjacent points marked one blink. If they did, we preserved them. If they did not, we deleted them. If fewer than four points marked the possible blink, we deleted these points as well. Then the length of each blink should not exceed the estimated limit. If it did, the peak was not a blink and we deleted the corresponding intersection points. Four points mark the whole blink, the first two points mark the eye closure, and the other two points mark the eye opening. The difference between the function values of these pairs of points should exceed the estimated limit. The limits were estimated individually for each subject.
After marking all the possible blinks, we calculated the blink voltage as described in [6]. If the voltage was higher than the estimated threshold voltage, the peak (possible blink) was considered to be a blink. If not, the peak was not a blink and we deleted the corresponding points. After marking all the blinks by four points as shown in Fig. 5, we calculated 11 blink parameters according to the equations in [6].

Marking all the blinks by four points. The difference of the filtered vertical channel is shown above. The dashed lines are thresholds. Intersections between signal and thresholds are marked by crosses. Below, these intersections are projected into the filtered signal. These points mark blinks. After the processing is finished, the first peak does not represent the blink (that is why it is not marked).
This algorithm was applied only to one long signal of each subject, because in this signal fatigue should increase with time.
The algorithm for the eye instability feature extraction was based on the algorithm used for the blink feature extraction. The relevant block diagram is shown in Fig. 6.

Block diagram of the algorithm for eye instability feature extraction.
The inputs of this algorithm were the vertical and horizontal components of the EOG signal recorded while the subject was fixed on the cross. We recorded and processed this signal only once because fatigue should increase with time. In contrast to the algorithm mentioned in previous subchapter, in this algorithm we did not filter this signal because we needed all the frequencies of the signal. For this algorithm to be compatible with the algorithm from previous subchapter, we also compensated for the delay in this signal. Blinks were marked in the unfiltered vertical EOG channel and our aim was to delete blinks or, more precisely, replace them by interpolated values. That is why we used linear interpolation between two outer marks of a blink.
Then we calculated the Euclidean distance between each point and the origin

Illustration of 2D space of EOG (horizontal and vertical components) with points (positions the subject is looking at the particular time). The biggest point is the origin

Graph of development of sum of Euclidean distances in dependence of time (in each window).
The algorithm used for the REM (rapid eye movement) feature extraction from the signal recorded while watching the video of driving a car was based on a method described in [8]. The block diagram of this algorithm is shown in Fig. 9.
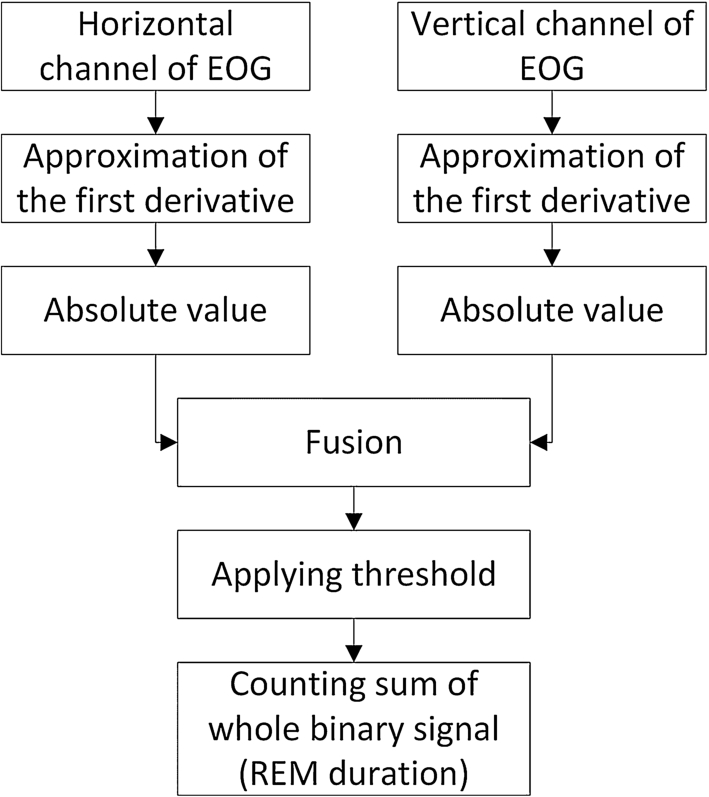
The block diagram of the algorithm for the REM feature extraction.
The inputs of the algorithm were horizontal and vertical EOG components. We calculated the approximation of the first derivative as the difference between the original signal and its n-samples shifted version. We set
Approximations of the first derivatives of the horizontal, vertical and fused signals were compared against the threshold. In this work we calculated the threshold as a median of approximation of the first derivative of the fused signal for each subject. We determined this formula empirically to make the results more objective for all subjects and to automate this algorithm. Only one threshold was used for all the signals (horizontal, vertical, and fused signals before and after fatigue) of each subject. After comparing these signals against the threshold, we obtained a binary signal as shown in Fig. 10, where 0 means SEM (slow eye movement) and 1 means REM. The output of this algorithm was the sum of the whole binary signal (the duration of REM).

Approximation of the first derivative of the fused signal and the resulting binary signal after threshold application. Approximation of the first derivative of the fused signal is shown above. The dashed line is the threshold. The result of applying the threshold to the signal is the binary signal below (0 means SEM and 1 means REM).
In the end, we obtained 3 parameters (3 values from an untired subject and 3 values after fatigue): duration of REM in the horizontal channel, duration of REM in the vertical channel and duration of REM in the fused signal. The duration of SEM was redundant, because it was the difference between the length of the signal and the duration of REM.
We extracted 20 different parameters from the signals acquired. We did the statistical evaluation of these parameters. Before that, we needed to test the normality of the data and decided what kind of test we would use. To test data normality, we made histograms and did the Shapiro–Wilk (S–W) test.
Magnitude and period length
We statistically evaluated the following parameters: minimum in each period, maximum in each period, peak-to-peak range, distance between adjacent minima, and distance between adjacent maxima. We could look at these parameters from two different angles. The first one looked at the data and subjects comprehensively and, as a result, we found out if the change in a parameter (caused by fatigue) was statistically significant. The second one looked at the data of each subject separately. For each subject we found out whether or not the parameters changed significantly with fatigue.
Fatigue evaluation in terms of parameters
Our aim was to find out whether there was any significant difference between the parameters before and after fatigue, i.e. whether the parameter was an indicator of fatigue.
Signal magnitudes were slightly different across the subjects (especially due to the different skin impedance) so we had to normalize the data. We calculated the means of all the parameters for all the subjects before and after fatigue. From these means, we calculated the percentage differences in the parameters obtained before and after fatigue.
Data had no normal distribution, so we had to use a nonparametric test – the one-sample Wilcoxon signed-rank test. We tested the percentage differences against zero, i.e. when there is no significant difference between the signals before and after fatigue. The statistical test indicated that the minimum in each period and the peak-to-peak range were fatigue indicators.
Fatigue evaluation in terms of subjects
Our aim was to find out whether there was any significant difference between the data before and after fatigue for each subject. This was the way to find out whether the fatigue manifested itself in each subject.
Depending on data normality, we used either the parametric paired two-sample t-test or the nonparametric two-sample Wilcoxon test. We also plotted graphs of the development of these parameters because we wanted to know if the parameter (fatigue) increased or decreased.
The parameter maximum in each period is significant in 7 subjects out of 10, in 6 subjects this parameter decreases with fatigue. This parameter is not a reliable fatigue indicator. The parameter minimum in each period and the peak-to-peak range are significant in 9 subjects out of 10, in 8 subjects these parameters decrease with fatigue. This means there is a difference between signals acquired before and after fatigue and these parameters are fatigue indicators. The distance between adjacent maxima and minima is not significant. These parameters are not fatigue indicators.
Blink features
We extracted and evaluated 11 parameters (blink features): eye-blink voltage, eye-blink duration, time of closing the eyes, time of opening the eyes, closed-eyes time, time interval between two blinks, average speed of closing the eyes, average speed of opening the eyes, maximum speed of closing the eyes, maximum speed of opening the eyes, eye-blink energy.
Our aim was to evaluate the development of the parameters with time and find out whether the fatigue manifested itself. We used the linear regression method to evaluate these parameters. Time was the explanatory variable and each parameter was a dependent variable. We compared some of the parameters with the results in [10].
Table 2 gives the slope values for all the parameters, the results from [10] and the number of subjects with the same result as in [10]. From Table 2 it is clearly visible that no parameter is a hard and fast fatigue indicator. We regard as good results in terms of fatigue indicators the average speed of opening the eyes, the eye-blink voltage, closed-eyes time, and eye-blink energy.
Slope values of all the blink parameters
Slope values of all the blink parameters
The assumptions have been taken over from [10].
According to [11], the assumption is that eye instability should increase with time. In our conditions, this means an increased Euclidean distance. For fatigue evaluation we used linear regression.
Table 3 gives the slope values for all the subjects. Positive slope values mean that the fatigue manifests itself in the parameter of eye instability. In 5 subjects the eye instability increases and in the same number it decreases. That is why the eye instability parameter is not a reliable fatigue indicator. Moreover, this parameter is very sensitive to the method and quality of eye blink filtering.
Slope values of eye instability parameter
Slope values of eye instability parameter
Positive slope values agree with the assumption from [11]. These values are in bold type.
Signal magnitudes differed across the subjects (especially due to the different skin impedance) so we had to normalize the data. We calculated the means of all REM parameters for all the subjects before and after fatigue. From these means, we calculated the percentage differences in the parameters obtained before and after fatigue.
According to [8], the assumption is that the total time of REMs should decrease after fatigue.
Data had no normal distribution, so we had to use a nonparametric test – the one-sample Wilcoxon signed-rank test. We tested the percentage differences against zero, i.e. when there is no significant difference between the signals before and after fatigue. The result of this test is that the total time of REMs (in horizontal, vertical, and fused signals) is not a fatigue indicator.
Conclusion
We extracted and statistically evaluated a total of 20 parameters. A complete overview of the results is in Table 4.
Overview of all the parameters and their evaluation in terms of fatigue
The assumptions have been taken over from [8,10,11]. The best parameters are in bold type.
From Table 4 it follows that none of the parameters only increases or only decreases with time. None of the parameters is an absolutely reliable fatigue indicator. Nevertheless, the best fatigue indicators are the minimum in each period, the peak-to-peak range, and the average speed of opening the eyes.
The first two parameters (in bold) were extracted from the signal acquired while watching the rotating ball. It was statistically proved that there was a significant difference between the parameters before and after fatigue. In 8 subjects these parameters decreased after fatigue. The average-speed-of-opening-the-eyes parameter was extracted from the signal recorded while fixating the cross. This parameter was decreasing with increasing fatigue in 8 subjects.
Good parameters for fatigue detection are also the eye-blink voltage, closed-eyes time, and eye-blink energy from the signal acquired while fixating the cross.
Other parameters are not appropriate for fatigue detection. These parameters are not significant or they increase and decrease in approximately the same number of subjects.
Footnotes
Acknowledgements
This work was supported by grant project GAČR 102/11/1068.
Conflict of interest
The authors have no conflict of interest to report.