
Abstract
Background:
Circle of Willis (COW) is a network of cerebral artery which continually supplies the brain with blood. Any disturbance in this supply will result in trauma or even death. One of these damages is known as brain Aneurysm. Clinical methods for diagnosing aneurysm can only measure blood velocity; while, in order to understand the causes of these occurrences it is necessary to have information about the amount of pressure and wall shear stress, which is possible through computational models.
Objective:
In this study purpose is achieving exact information of hemodynamic blood flow in COW with an aneurysm and investigation of effective factors on growth and rupture of aneurysm.
Methods:
Here, realistic three-dimensional models have been produced from angiography images. Considering fluid-structure interaction have been simulated by the ANSYS.CFX software.
Results:
Hemodynamic Studying of the COW and intra-aneurysm showed that the WSS and wall tension in the neck of aneurysms for case A are 129.5 Pa, and 12.2 kPa and for case B they are 53.3 Pa and 56.2 kPa, and more than their fundus, thus neck of aneurysm is prone to rupture.
Conclusion:
This study showed that the distribution of parameters was dependent on the geometry of the COW, and maximum values are seen in areas prone to aneurysm formation.
Introduction
The life and activity of the cells and organs of the body are related to the circulatory system. The main center of the brain blood distribution is the Circle of Willis (COW). Circle of Willis is a network of cerebral arteries in the base of the brain that blood flow is entered into the skull by common carotid arteries (CCA) from anterior and vertebral arteries (VA) from posterior. Studies have claimed that complete circle of Willis is seen in 21–42% of humans [1]. Another study indicated that 36% of humans have complete COW [2]. In fact, a significant number of people are considered incomplete COW [3]. Generally, geometry of COW can be different for different people. Geometry is one of the important factors in assessing the flow hemodynamic. On the other hand, geometry has a significant impact on COW blood flow [3–6]. Thus, flow hemodynamic can be changed due to the diversity of the COW. Development of any disturbance in the circle and exit of their natural conditions can change the hemodynamic of the blood flow and result in damage of the vascular system. One of these damages is known as brain aneurysm that occurs in 3–6% of people with 75% mortality rate [7]. Nowadays only morphological properties of aneurysm are evaluated such as pretreatment without reference to hemodynamic abnormalities; while hemodynamic factors dramatically influence aneurysm formation and its treatment [8]. Therefore, in order to obtain exact information on cerebral arteries, hemodynamic is important for treatment planning. Computational fluid dynamic (CFD) is one of the most important approaches for obtaining information. It should be noted that the accuracy of this method depends on geometry, boundary conditions and the mechanical properties of the fluid and arterial wall. Considering the conditions close to real in-vivo condition, accurate and reliable information can be obtained from blood hemodynamic.
Studies regarding cerebral arteries hemodynamic have rarely discussed the complete circle of Willis. Also the effect of fluid on the arterial wall and its mechanical parameters have not been considered in circle of Willis [4,9–11], or some of the arteries of the circle [3,12]. This fluid-structure interaction (FSI) has been considered in studies that have been done only in some vessels with aneurysm of cerebral arteries not complete circle [4,6,13–15]. Since FSI is another important factor to investigate hemodynamic parameters and pathological condition. One-way interaction was used for simulation. Also, 3D geometry of circle and aneurysm were obtained from real cases and patient-specific conditions were obtained by Transcranial Doppler (TCD). In fact, conditions were considered close to in-vivo condition.
Method
The anatomy and morphology of Circle of Willis and aneurysm in various people can be different and their geometry can affect the hemodynamic of blood flow. Thus, one of the most important factors in determining flow parameters through circle of Willis and intra-aneurysm is exerted realistic and patient-specific geometry. In the present study, patient-specific geometries of circle of Willis with aneurysm of two cases were studied. The original computer tomography (CT) data in DICOM format was prepared from Iran Imaging Center, Tabriz, Iran. Two dimensional images of head and neck were generated by a Siemens/Sensation 64 CT Scanner. Thick slices and resolution of images are 1 mm and 512 × 512 pixels. Geometries of COWs and site of aneurysm in these circles are different. The first patient (case A) presented here is a 10 years-old male with aneurysm (29 mm × 30 mm) located in the Basilar artery (BA). COW misses posterior communicating arteries (PCoAs) on both sides. Case B is a 70 years-old male with aneurysm sized 7 mm × 6.9 mm located in the left middle cerebral artery (MCA) (Fig. 1).
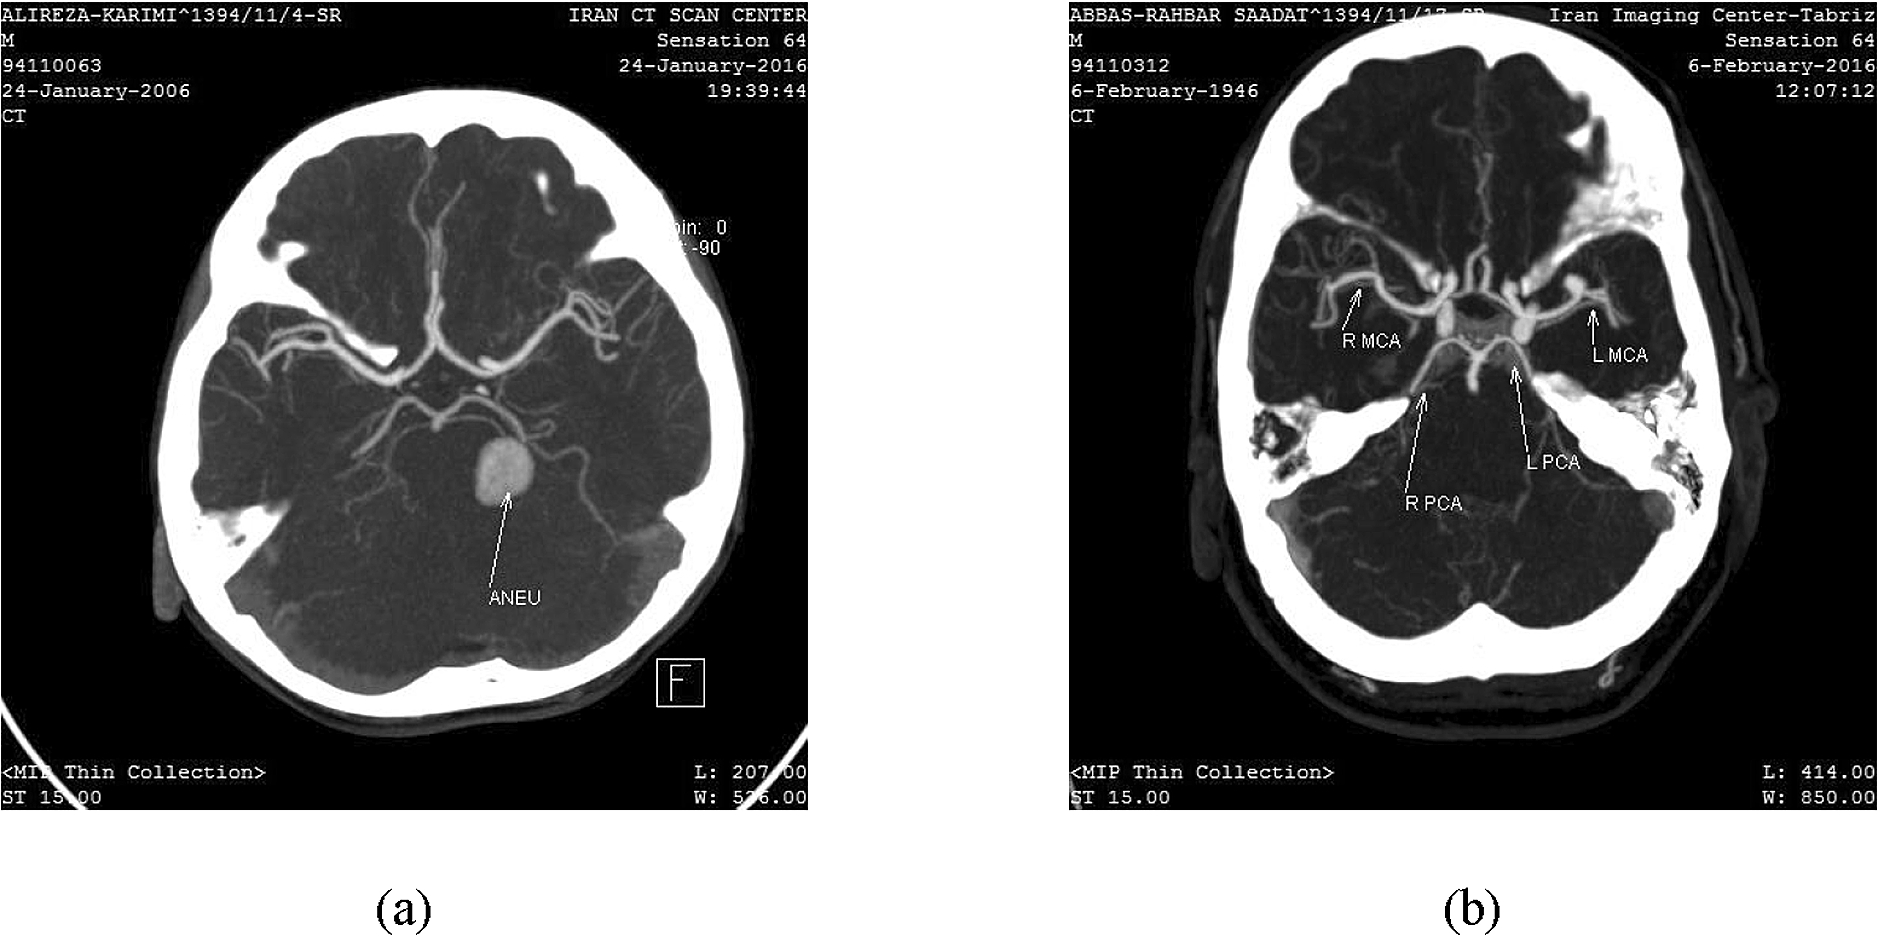
Angiography images of circle of Willis for, (a) case A, (b) case B.
The CT images for each patient were imported to the Mimics software (Materialise) to extract realistic and anatomical CAD model. In Mimics, threshold of vascular tissue was identified and cerebral arteries were separated from other tissues including skull, muscles, skin and other arteries. Finally, for each case 3D model of geometry of COW as cloud points, related to fluid part (blood) were created. Obtained data was compared with anatomical studies for validation of arterial wall thickness acquired from Mimics (Table 1).
Thickness of cerebral arteries wall
ICA: Internal carotid artery, VA: Vertebral artery, BA: Basilar artery, MCA: Middle cerebral artery, P1: Posterior cerebral artery, ACA: Anterior cerebral artery.
After preparation of the anatomical model, files with STL format were imported to the 3-Matic software (Materialise). Because of the small difference between the thicknesses of various vessels, the thickness of the arterial wall was applied 0.4 mm for all the arteries and aneurysm. The process of converting cloud points to exact surface for both fluid and wall was performed by the GEOMAGIC-STUDIO software (3D Systems). Then for one-way FSI, models with IGES format were transferred to the ANSYS.CFX software.
In this study patient-specific conditions were applied. Therefore, the Doppler ultrasound test was done to obtain pulsatile velocity profile in cerebral arteries of COW. The velocities for each patient were measured at Emam Reza Hospital, Tabriz, Iran.
The FSI models were solved by ANSYS.CFX. The Finite Volume Method (FVM) was used for discretizing the fluid governing equations and the Finite Element Method (FEM) was used for the solid parts. Both methods along with coupling conditions were solved by Arbitrary Lagrangian–Eulerian (ALE) which is widely used for blood flow simulation [15].
In cerebral arteries the fluid was considered as Newtonian and incompressible, and the flow was considered laminar as described as:
Unstructured grids with 3D tetrahedral elements and 10 nodes were imposed for both the fluid and solid domains. Also for the fluid domain, prismatic elements were used in boundary layer with 0.2 mm thickness and 5 layers. Computational quality of mesh and skewness were appropriate and approximately 0.81 and 0.27, respectively. For integration of this time-depended problem, the implicit Euler method was used with a time step of 0.01 s. Four cycles of time were simulated and the results were extracted from the third cycle.

Velocity profile obtained from TCD through inlets of (a) case A, (b) case B.
In this study, in addition to measurement of inlet boundaries by TCD, for validation other arteries’ blood velocity was measured as well. For each case, one of the COWs arteries were selected that was located near the surface of the skull and had less curvature. The reason for this choice was that the Doppler test has minimum error in these conditions. In this study, the Middle cerebral artery (MCA) was selected and as shown in Fig. 3. The difference between TCD and numerical method was negligible. In case A, in order to reduce computational time and due to lack of communication between the posterior and anterior part in the circle, the geometry was divided into two distinct parts.
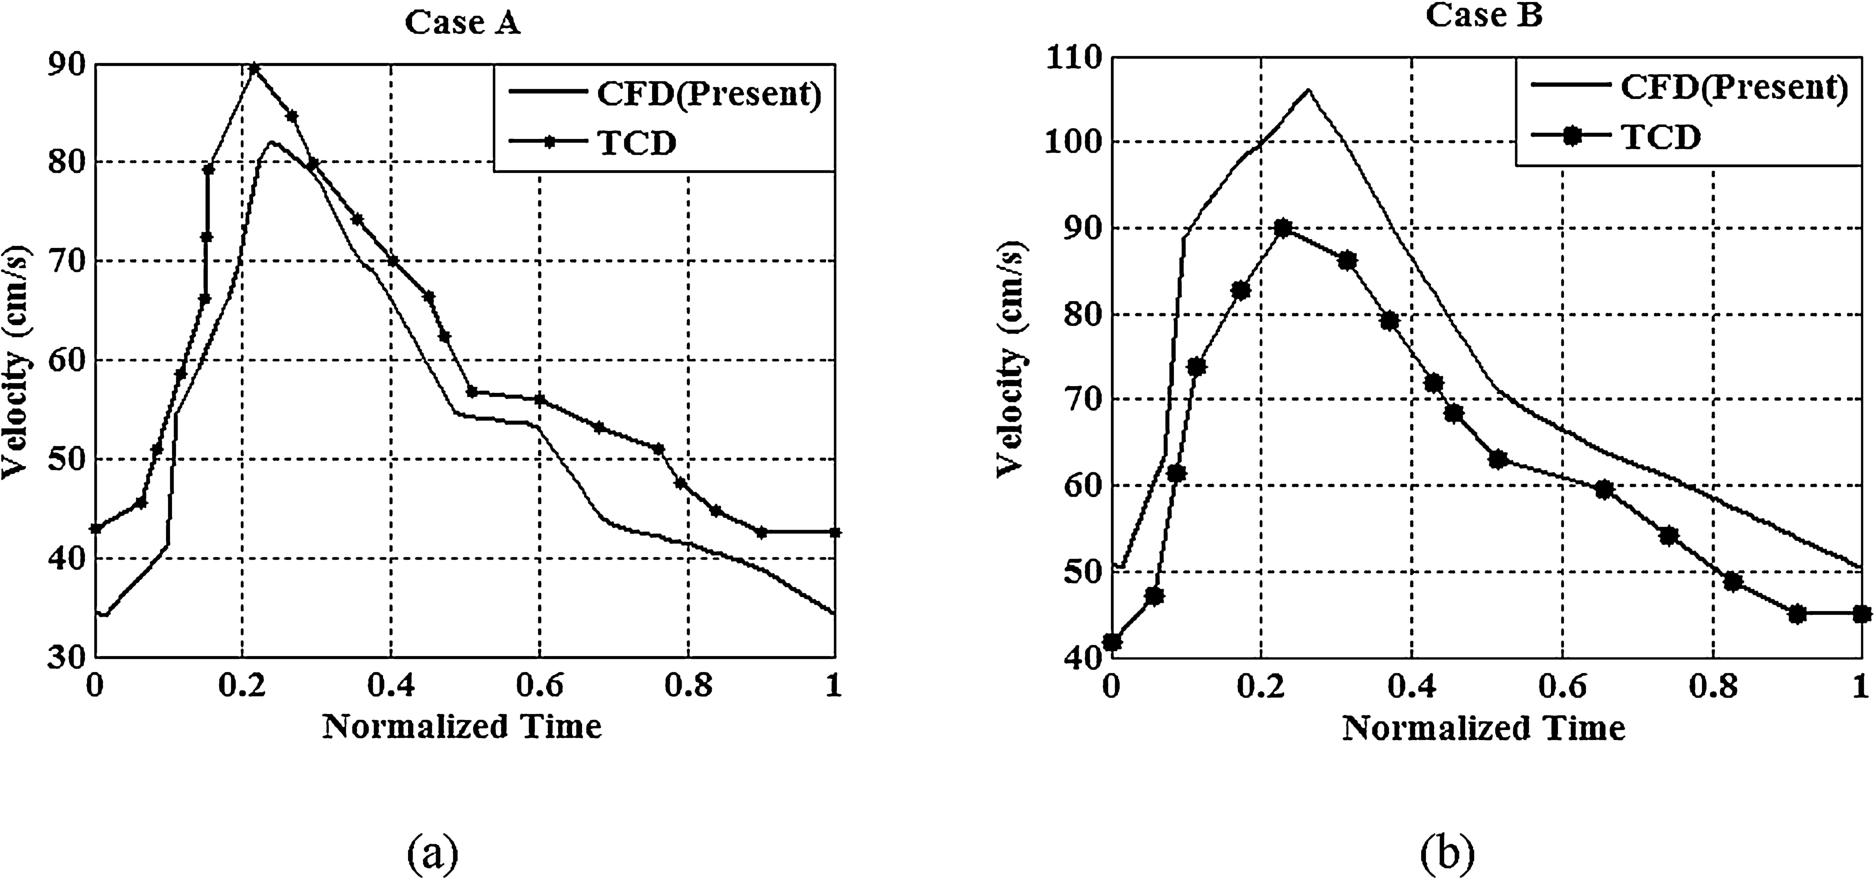
Comparison of velocity profile obtained from TCD and CFD for validation at the left MCA of (a) case A, (b) case B.

Blood flow velocity corresponded to maximum velocity of inlets in cerebral arteries for case A, (a) anterior region, (b) posterior region.
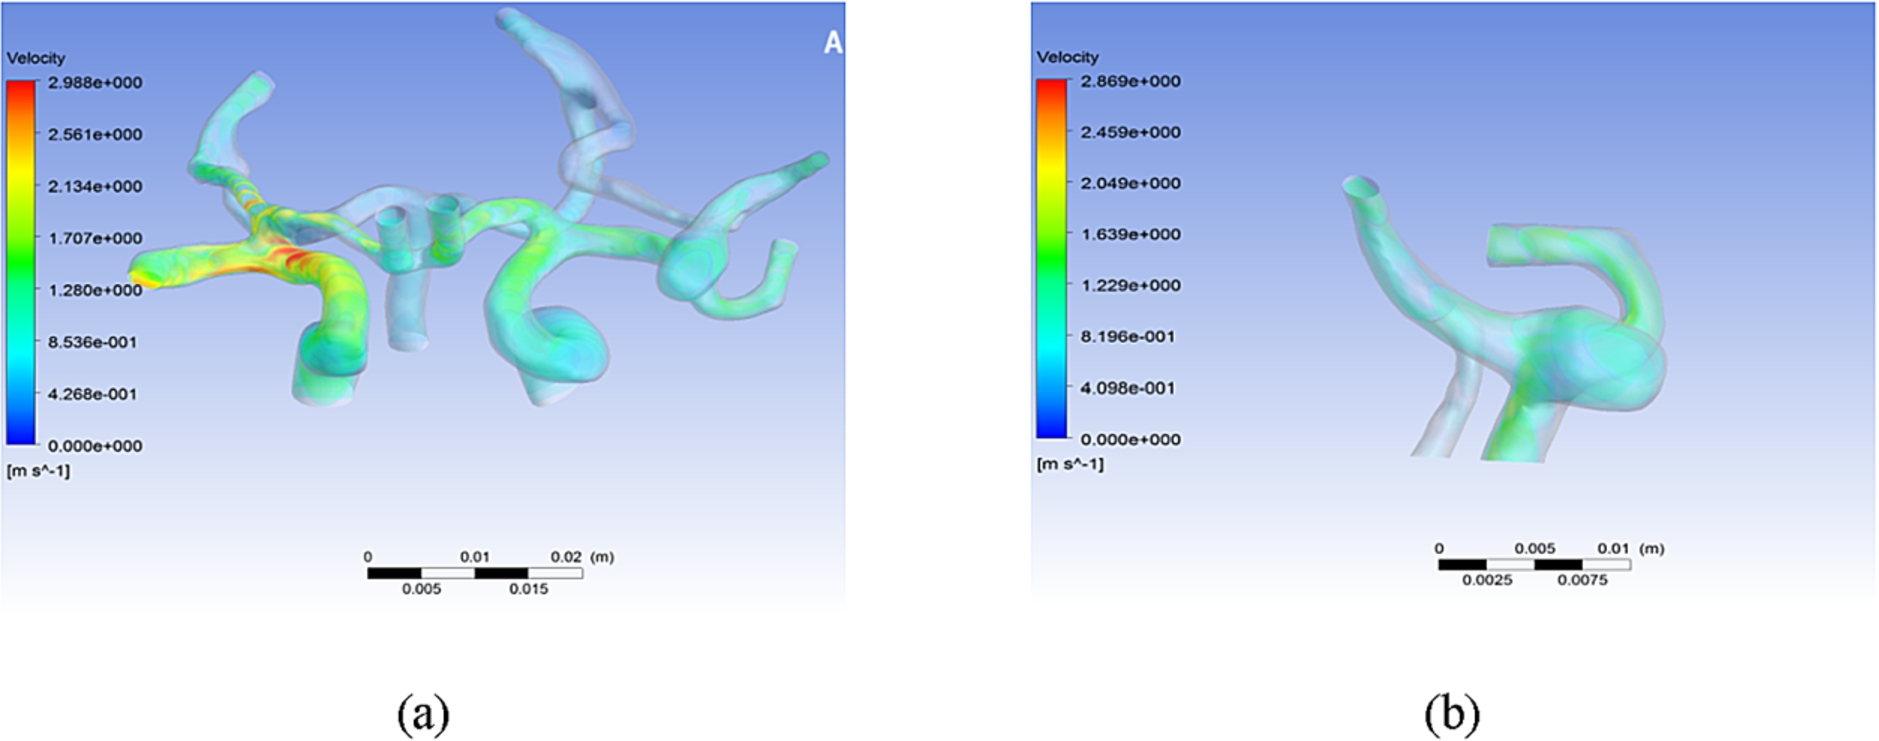
Blood flow velocity corresponded to maximum velocity of inlets in cerebral arteries for case B, (a) circle of Willis, (b) intra-aneurysm.
Velocity distribution in COW for both cases is presented in Figs 4 and 5. These values are exported at the time the inlet velocity is Maximum. As can be seen, distribution because of difference velocity in right and left internal carotid artery (ICA), is different in both sides. Maximum amount is 2.2 m/s.
As demonstrated in Fig. 4, in the posterior region, maximum velocity is about 2.73 m/s and in the intra-aneurysm is 0.12 m/s. Due to the location of aneurysm, blood flow directly enters to lesion from VA and blood velocity strongly decreases because of its size. Then the flow enters BAS due to high pressure difference. After blood goes into Posterior cerebral artery (PCAs), its role is very important for supplying blood in this part of circle. The size of aneurysm makes it possible that sufficient amount of blood be stagnant inside the aneurysm which gradually increases in rupture and inflammation [22]. At the proximal of BAS, exactly after aneurysm, velocity is higher than the distal part. This local high velocity results in high wall shear stress which may lead to stimulation of wall and further growth of aneurysm [22]. Also in the posterior cerebral arteries it has been observed that blood velocity is different in both sides. This difference can be due to angle of bifurcation and diameter of vessels [23]. In this model considering to lack of PCoA at both sides, any damage in any part of the circle imperiled blood supply and created serious danger. Therefore, geometry of circle can significantly affect blood hemodynamic.
Velocity distribution for case B corresponded to maximum velocity of inlets (Fig. 5). As can be seen, the right side velocity is more than the opposite side and most of the flow arrives to the middle cerebral artery. This difference of flow rate in two sides is important when stenosis is strike in upstream vessels which have more flow rate. In this condition, one side blood flow with lower flow rate may not be able to supply blood for the whole brain. Flow impingement in bifurcation region as shown in Fig. 5 is one of the effective factors on endothelial cell degeneration and weak parts of the wall [18]. In case B due to these conditions, the region can be prone to aneurysm formation. At the region of lesion side, blood flow arrives at middle part arteries after aneurysm and lower flow rate enters the PCoA. Actually, transfer of blood flow to the posterior region in this side is less than the other side. This may be due to the anatomy of vessels and bifurcation region or jet flow from outlet of aneurysm. Velocity contour of intra-aneurysm aside is presented in Fig. 5. indicating inflow and outflow of aneurysm impinge with wall near the neck. As mentioned earlier, velocity gradient increases and as a result increases the possibility of growth or rupture [18].

WSS profile corresponded to maximum velocity of inlets for case A, (a) anterior region, (b) posterior region.
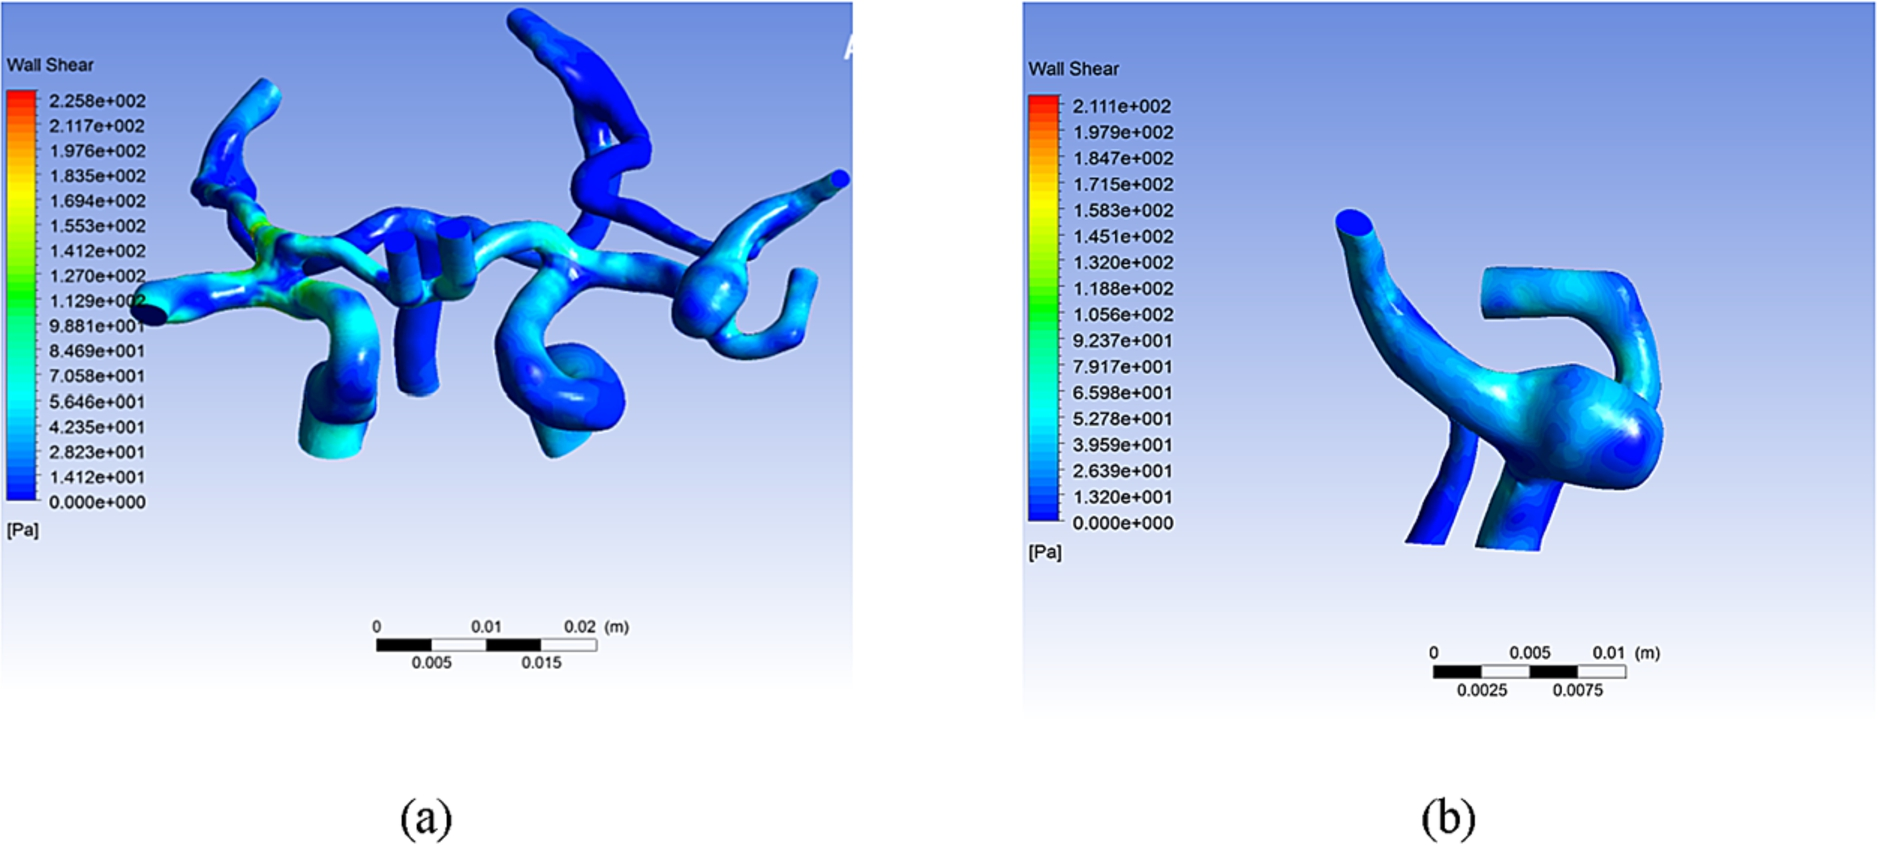
WSS profile corresponded to maximum velocity of inlets for case B, (a) circle of Willis, (b) intra-aneurysm.
Figure 6 shows the wall shear stress distribution for the anterior and posterior region of case A at the time inflow has maximum velocity. As can be seen, at the posterior region WSS is higher than the anterior region. This amount of WSS may be due to existence of lesion and its size. Figure 7 indicates WSS for case B. Maximum value of WSS is observed in bifurcation region between MCA and PCA since this region is prone to vascular lesion formation [7,24,25]. In aneurysm, high WSS is observed in the neck. Considering velocity gradient, WSS is expected to be higher in the neck than fundus; researches have indicated that WSS about 2 Pa is suitable for protection of the arterial wall structure. High WSS is known as a main factor for development of lesions. Thus any rupture is related to low WSS [26].
Von misses tension
Blood flow force in the arteries is applied to the wall of interaction. Afterwards, governing equation of wall structure is solved and is calculated according to von-misses stress and its displacement. Figure 8 presents von-misses stress for case A. Stress contour is almost the same in both sides. At the side that blood pressure is high, stress is also more than the other side. According to Fig. 9, maximum velocity is in regions where WSS, pressure and von-misses stress are high and flow impingement occurs. In the posterior region of case A, as expected, the highest amount of stress occurs in the neck and bifurcation of BA and PCA. Stress in the aneurysm part is lower than other vessels.
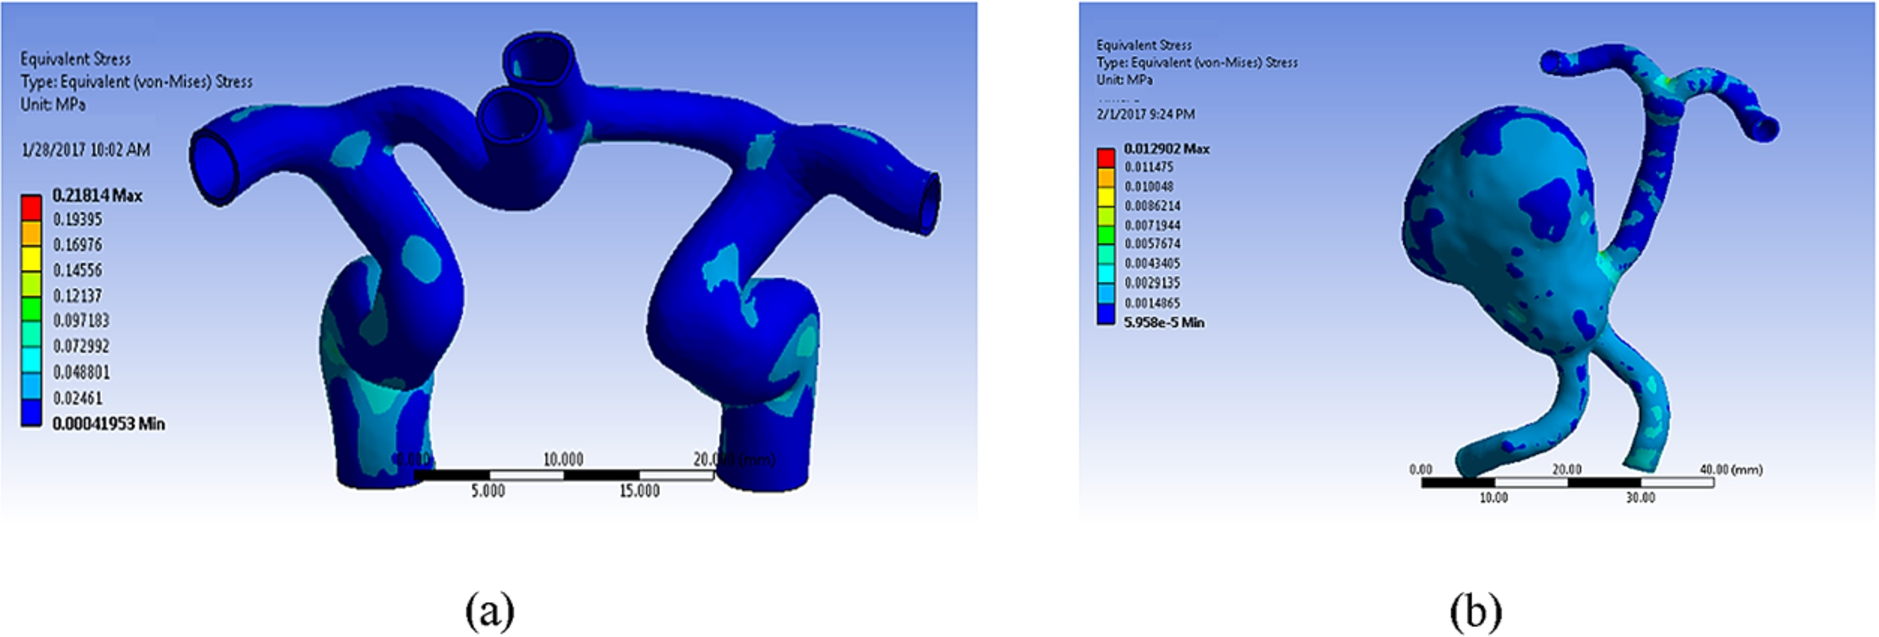
von-misses stress profile corresponded to maximum velocity value of inlets for case A, (a) anterior region, (b) posterior region.
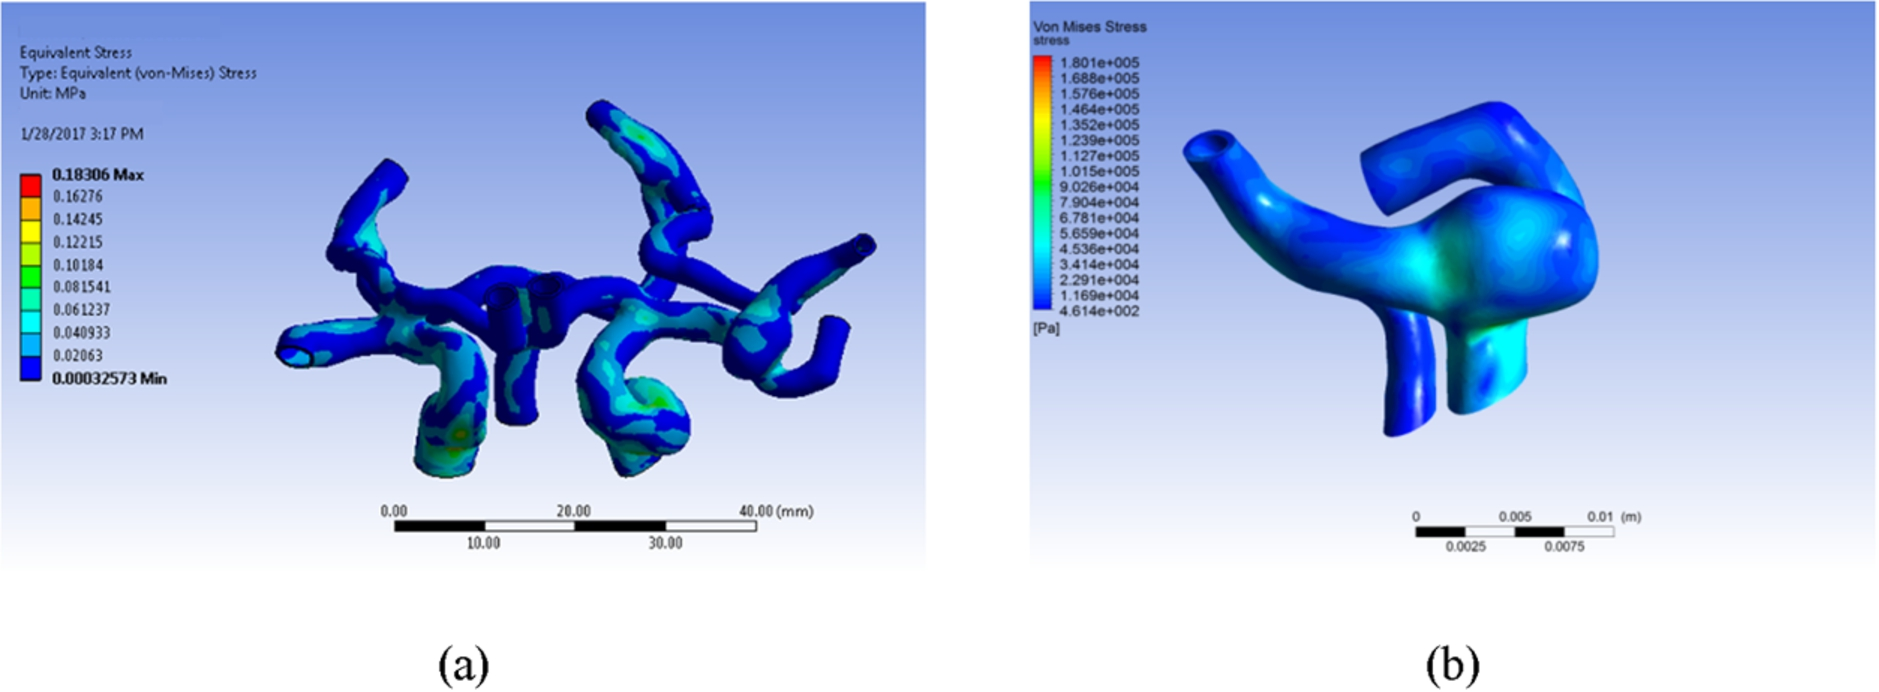
von-misses stress distribution corresponded to maximum velocity value of inlets for case B, (a) circle of Willis, (b) intra-aneurysm.
As shown in Fig. 10 peak of arterial wall displacement is seen in areas that blood pressure is high and flow impingement occurs. In case B, uniform distribution of stress and wall displacement is observed in both sides. Also in areas with high blood pressure and WSS, von-misses stress and displacement is also high. In this study, the stress applied and amount of wall displacement of intra-aneurysm were also investigated (Fig. 11). Results reveal that displacement in the neck and fundus of aneurysm is more than other areas. But the amount of stress is significantly higher in the neck in comparison to the fundus. In fact, the peak of stress is where aneurysm tends to rupture. This stress can be higher for people with high blood pressure. Generally, parameters such as WSS, blood pressure and mechanical stress can affect the pathology of the wall. According to results, areas that are prone to aneurysm or lesion formation, rupture, hemodynamic and mechanical parameters are considerable. However, in few cases only WSS has been mentioned.
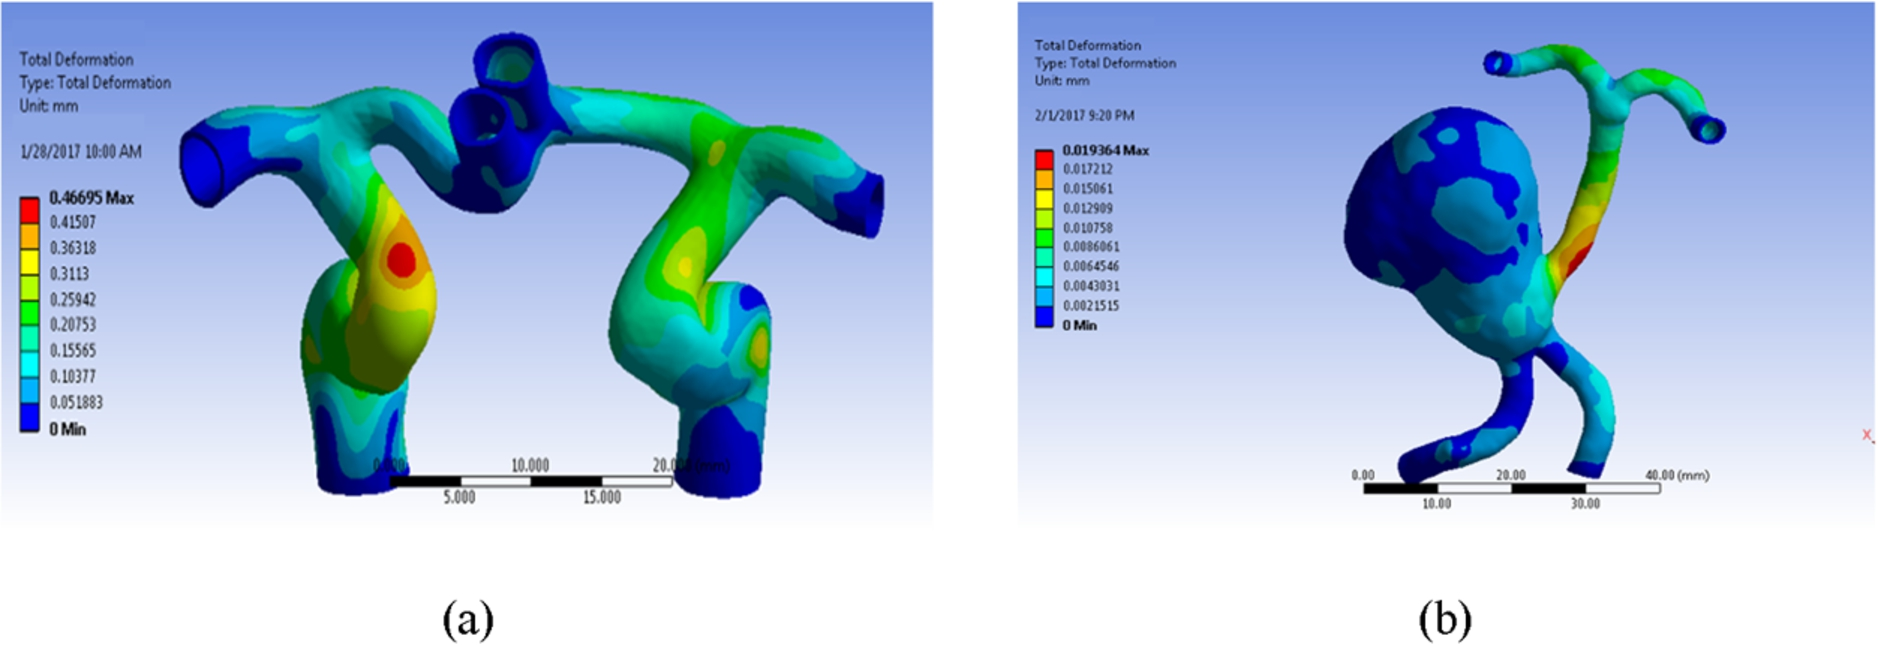
Wall displacement distribution corresponded to maximum velocity of inlets for case A (a) anterior region, (b) posterior region.
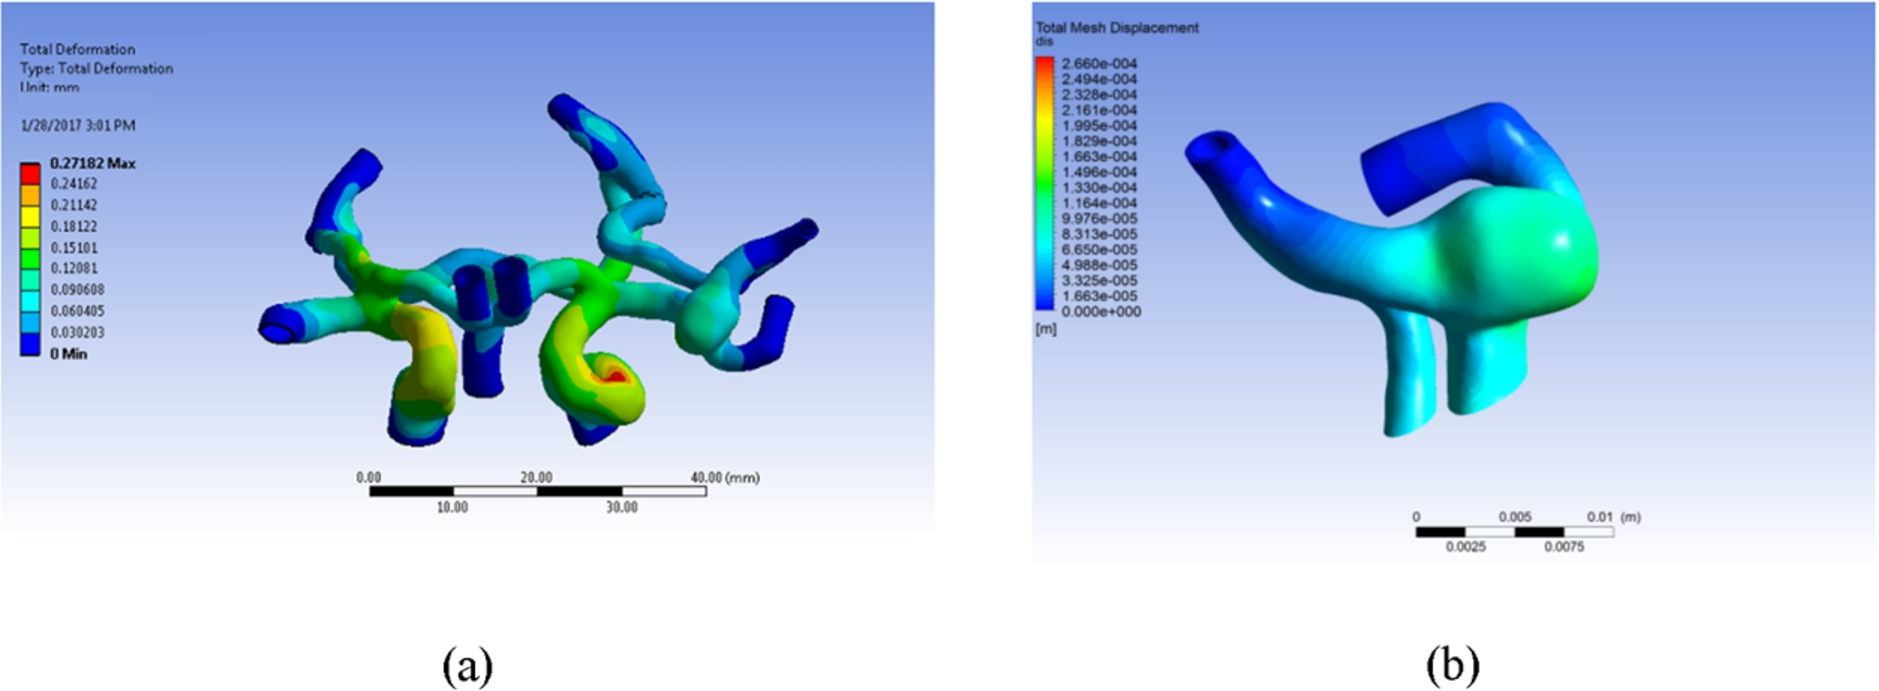
Wall displacement profile corresponded to maximum velocity of inlets for case B, (a) circle of Willis, (b) intra-aneurysm.
Three-dimensional simulation of two different anatomies of cerebral arteries with aneurysm was performed in order to assess hemodynamic of circle of Willis and aneurysm. Assessment of hemodynamic in case A indicated that blood flow hemodynamic can strongly be influenced by the size of aneurysm. Stroke risk increases with the reduction of flow rate and inadequate flow in blood supply vessels. Notably, all conditions depend on the geometry of circle and aneurysm which can be various in difference people.
Additionally, study on cerebral arteries and aneurysm hemodynamic showed that distribution of hemodynamic factors such as WSS, blood velocity and flow impingement for blood flow and mechanicals factors including wall tension and displacement are remarkable in some regions of the circle and cause arterial damages. These regions include arterial bifurcations and the neck of aneurysm.
Footnotes
Acknowledgements
We thank Dr Nader Ghalichi and Mrs Amini, Iran Imaging Center, Tabriz, Iran for their help in providing CT images of Circle of Willis. This work has been supported by the High Performance Computing Research Center (HPCRC) – Amir Kabir university of Technology under Contract No ISI-DCE-DOD-Cloud-900808-1700.
Conflict of interest
The authors have no conflict of interest to report.